Abstract
Chiari I patients have increased CSF velocities in the foramen magnum due hypothetically to increased pressure gradients or reduced flow resistance. We calculated flow resistance in the cervical spinal canal in a group of subjects with and without the Chiari malformation. Eight subjects including healthy volunteers and Chiari I patients were studied. From 3D high resolution MR images of the cervical spine mathematical models of the subarachnoid spaces were created by means of standard programs for segmentation and discretization. Oscillatory flow through the subarachnoid space was simulated. Cross-sectional area of the subarachnoid space was computed at each level from C1 through C4 and the length of this spinal canal segment was measured. Peak caudad CSF flow velocity at each level was plotted against cross-section area. CSF volumetric flux and resistance were calculated for each subject. The correlation between velocity and resistance was calculated. In all subjects, peak velocities increased progressively from C1 to C4 by 0.6 to 0.7 cm/s per level. Spinal canal areas diminished from C1 to C5 in each subject at a rate of 0.25 to 0.29 cm2per level. Resistance averaged 4.3 pascal/ml/s in the eight subjects; 3.8 pascal/ml/s in patients with tonsilar herniation and 6.0 pascal/ml/s in volunteers. Velocity correlated inversely with resistance (R2= 0.6). CSF velocities correlated inversely with the flow resistance in the upper cervical spinal canal. Resistance tends to be lower in Chiari I patients than in healthy volunteers.
Keywords: Chiari I, CSF flow, MR imaging, spine
Introduction
Flow imaging with MR fails to completely characterize CSF flow abnormalities in the Chiari malformation. Phase contrast MR (PC MR) demonstrates time-varying CSF velocities throughout the cardiac cycle with greater peak CSF velocities in Chiari I patients than in controls. Furthermore, PC MR shows synchronous bi-directional flow in Chiari I patients suggesting that they have more complex flow than do normal subjects. Flow imaging does not demonstrate CSF pressure, which may relate more directly to the pathogenesis of syrinx than does velocity. Invasive techniques to measure CSF pressures are rarely used in the evaluation of Chiari I patients. How pressures vary among individuals and among different anatomies is not well-understood. It is currently not known if the elevated CSF velocities in Chiari I are the consequence of abnormal pressure gradients or reduced resistance.
Computational fluid dynamics (CFD) provides a non-invasive means to calculate CSF pressures for a known anatomy of the spinal canal and CSF flow volumes. At present, CFD is not available for CSF flow analysis in clinical practice. CSF pressures are therefore not normally known in patients evaluated for CSF flow abnormalities.
Flow resistance, the ratio between pressure gradient and volumetric flow, provides a means to compared the effect of foramen magnum and spinal cord morphologies on CSF flow. Flow resistance in the spinal subarachnoid space (SAS) is determined by many factors including the length and the cross-sectional area of the space, the roughness of the surfaces facing the CSF, the viscosity of the CSF, and the presence of tissues like nerve roots and ligaments in the SAS. Chiari I patients have tonsi-lar herniation at the foramen magnum causing increased resistance at this level. However, abnormal tapering and increased velocities1-3 in their cervical spinal canals4,5 suggest less than normal resistance in the upper cervical spinal canal. The resistance to CSF flow in the cervical spinal canal has not to our knowledge been reported. Therefore we collected data and performed calculations to estimate CSF resistance and its variance in humans.
Methods
The institutional review board at the University of Wisconsin School of Medicine and Public Health reviewed the protocol for this retrospective study on anonymized image data and approved it, waiving the need for written informed consent. From a registry of 40 subjects we selected two volunteers and seven patients who in addition to the other clinically indicated pulse sequences had conventional EKG gated phase contrast MR (Fast Cine PC; GE Healthcare, Milwaukee, WI, USA) with 5 mm section thickness 256×256 matrix and 10 cm/s encoding velocity that provides 14 phases of the cardiac cycle with CSF flow data. They had also a volumetric 3D sequence of the cervical spine with VIPR 6 that samples data along radial lines evenly spaced through a spherical volume. One patient was subsequently excluded because of artifacts in the lower cervical spine that degraded the mathematical model of the subarachnoid space. After the cases and volunteers had been selected a neuroradiologist reviewed the images to determine the tonsil position and detect any spinal malformation or spinal deformity.
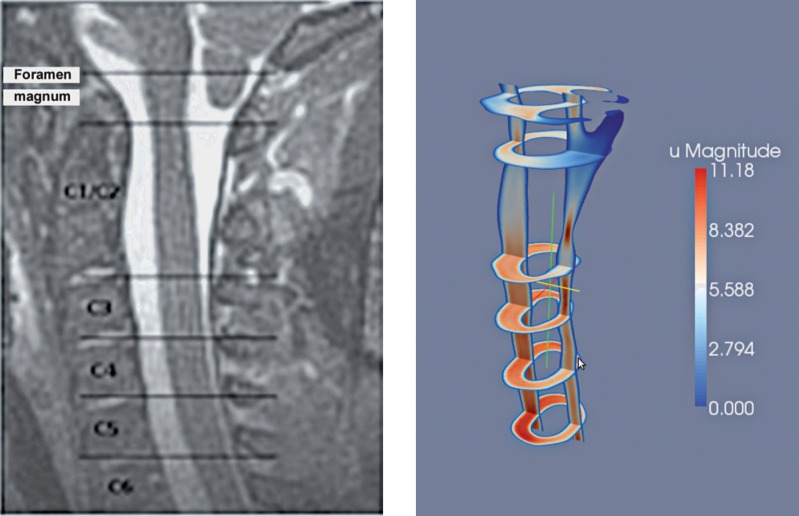
We segmented the 3D MR image data to display the CSF-filled space and using the Vascular Modeling Toolkit (VMTK, http://www.vmtk.org) we converted this space into a 3D model consisting of discrete points. At the inflow and outflow boundaries, i.e., top and bottom of the model, we applied a pulsating pressure with period and velocity to simulate CSF flow5. We simulated flow through the model by solving the Navier-Stokes equations at each point with software in the finite element library FEn-iCS version 1.0.0 7. The CSF flow velocities were reported previously8. In the simulations, the levels for C1 through C5 were identified by reference to the corresponding MR images (Figure 1). At these levels, the cross-sectional area of the subarachnoid space was computed in FEniCS. The length of this segment of the spinal canal was calculated from the sagittal view of the model and the volumetric flux was computed by integrating the velocity in the inflow region. Resistance was calculated as the ratio between the pressure drop through the whole domain and the volumetric flux at the inflow. Peak velocity at each level was plotted against cross-sectional area. A linear trendline was fit to the data by the least squares method. Differences between patients and volunteers were tested for significance by t test of the means assuming equal variance.
Figure 1.
Sagittal MR image (left) and Paraview image (right) of the corresponding model illustrate the velocities in the subarachnoid space for a sagittal and selected axial planes.
Results
One patient was omitted from the study because artifacts at the C5 level distorted the MR image of the subarachnoid space. In the six other patients and two volunteers, area measurements and velocities were thought to be free from artifacts. The patients included two males and four females, aged two to 40 years (Table 1). In the patients, tonsilar herniation ranged from 2 to 13 mm (average 8.1 mm). None of the patients had a syrinx. The adult volunteers had no tonsilar ectopia. No age was tabulated for them in the registry.
Table 1.
Demographics of the volunteers and patients analyzed.
| Tonsilar herniation (mm) | Gender | Age (years) | |
|---|---|---|---|
| Volunteer 7 | × | NA | NA |
| Volunteer 9 | × | NA | NA |
| Patient 43 | 12 | M | 2 |
| Patient 5 | 9 | M | 4 |
| Patient 26 | 13 | F | 5 |
| Patient 21 | 2 | F | 40 |
| Patient 58 | 5 | M | 10 |
| Patient 60 | 5 | F | 16 |
Peak velocities increased progressively from C1 to C4 in each patient and volunteer (Table 2, Figure 2). At C1, average peak velocities were 6.2 and 3.0 in patients and volunteers, respectively. In volunteers, the peak velocity increased at an average rate of 0.68 cm/sec per level. In patients, it increased at the rate of 0.56 cm/s per level.
Table 2.
Cross-sectional spinal cord areas and peak CSF velocities in the volunteers and patients analyzed.
| Level | C1 | C2 | C3 | C4 | C5 | ||||
|---|---|---|---|---|---|---|---|---|---|
| Volunteer 7 | |||||||||
| Area (cm2) | 2.2 | 1.4 | 1.1 | 1.1 | 1.1 | ||||
| Velocity (cm/s) | 3.4 | 4.2 | 4.9 | 5.6 | 5.2 | ||||
| Volunteer 9 | |||||||||
| Area (cm2) | 2.2 | 1.4 | 1.2 | 1.2 | 1.1 | ||||
| Velocity (cm/s) | 2.7 | 5.9 | 5.0 | 6.3 | 5.6 | ||||
| Patient 43 | |||||||||
| Area (cm2) | 1.4 | 1.1 | 1.0 | 0.9 | 0.9 | ||||
| Velocity (cm/s) | 7.6 | 8.7 | 9.7 | 10.3 | 11.0 | ||||
| Patient 5 | |||||||||
| Area (cm2) | 2.5 | 1.9 | 1.3 | 1.1 | 1.3 | ||||
| Velocity (cm/s) | 6.0 | 8.9 | 10.3 | 8.6 | 8.8 | ||||
| Patient 26 | |||||||||
| Area (cm2) | 2.4 | 1.6 | 1.3 | 1.3 | 1.3 | ||||
| Velocity (cm/s) | 8.2 | 8.8 | 9.4 | 10.2 | 11.3 | ||||
| Patient 21 | |||||||||
| Area (cm2) | 3.6 | 3.1 | 2.5 | 2.0 | 1.9 | ||||
| Velocity (cm/s) | 5.8 | 5.0 | 6.5 | 7.3 | 8.8 | ||||
| Patient 58 | |||||||||
| Area (cm2) | 2.6 | 1.3 | 1.1 | 1.1 | 1.1 | ||||
| Velocity (cm/s) | 4.3 | 6.8 | 6.9 | 6.5 | 7.3 | ||||
| Patient 60 | |||||||||
| Area (cm2) | 2.8 | 1.7 | 1.4 | 1.5 | 1.5 | ||||
| Velocity (cm/s) | 5.1 | 5.2 | 6.6 | 6.0 | 7.5 | ||||
Figure 2.
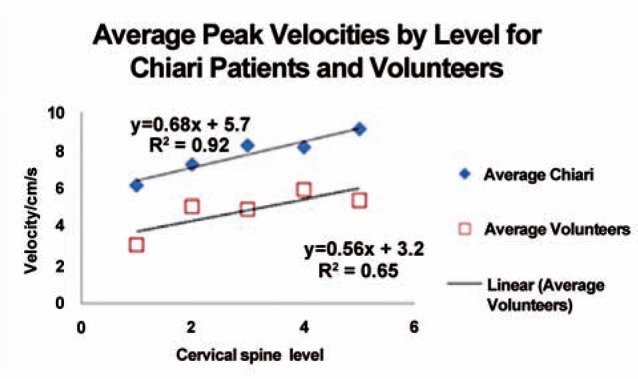
Plot of average peak systolic CSF velocities by cervical spinal level for Chiari patients and volunteers.
Spinal canal areas diminished from C1 to C5 in each patient and volunteer (Table 2, Figure 3). In volunteers, areas diminished at a rate of 0.25 cm2 per level and in patients at the rate of 0.29 cm2 per level. The average length was 8.5 cm in all subjects, and 10.6 cm and 8.5 cm in volunteers and patients, respectively. The average volumetric flux at peak systole was 6.0 ml/s. Patients had greater average flux with 6.6 ml/s than the volunteers with 4.1 ml/s.
Figure 3.
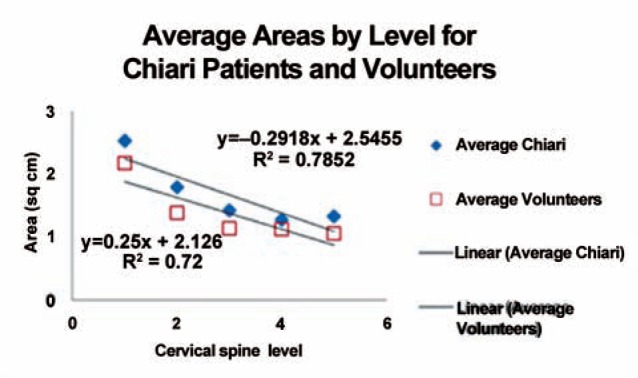
Plot of average cross-sectional areas of the subarachnoid space by cervical level for Chiari patients and volunteers.
Velocity for all levels in the six patients and two volunteers (Figure 4) showed an inverse correlation with area. The slope of the trend-line was –1.7 in the volunteers and –1.9 in the patients. Velocities were 60% greater in the patients than in the volunteers (Table 3), a difference significant at p = 0.02. The resistance averaged 4.3 pascal/ml/s for the eight subjects. It varied from 6.0 pascal/ml/s in the two volunteers to 3.8 pascal/ml/s in the patients, a difference significant at p = 0.03. Velocity varied inversely with resistance (Figure 5). The slope was –0.4. The correlation coefficient was 0.6.
Figure 4.
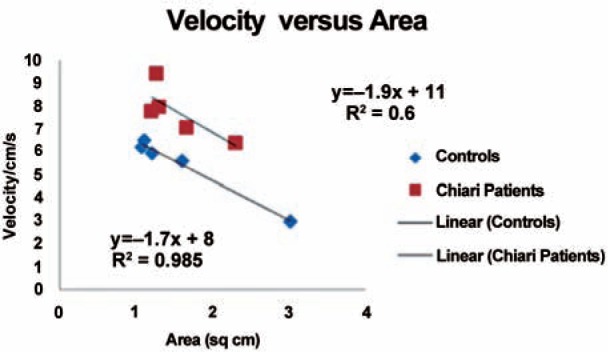
Plot of the change in velocity by area for the Chiari patients and volunteers.
Table 3.
Resistance calculated from maximal flux in patients and volunteers.
| Subject | Length | Flux | Resistance |
|---|---|---|---|
| Volunteer 7 | 11 | 3.9 | 6.2 |
| Volunteer 9 | 10.2 | 4.2 | 5.7 |
| Patient 43 | 5.5 | 5.8 | 4.1 |
| Patient 5 | 8.1 | 6.8 | 3.5 |
| Patient 26 | 6.2 | 8.1 | 3 |
| Patient 21 | 9 | 8.4 | 2.9 |
| Patient 58 | 8.8 | 4.5 | 5.3 |
| Patient 60 | 9.2 | 6.2 | 3.9 |
Figure 5.
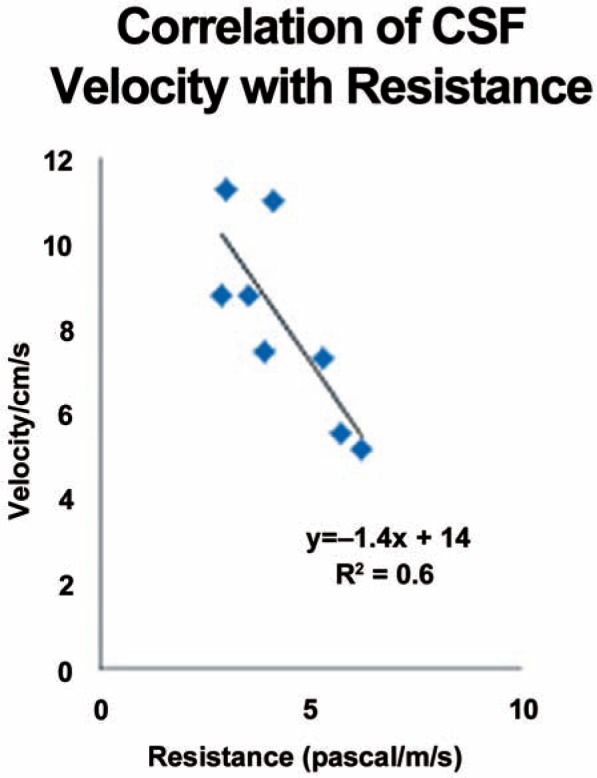
Plot of CSF peak velocities against flow resistance in the cervical spine for all subjects in the study.
Discussion
The cross-sectional area of the subarachnoid space correlated inversely with peak velocity in the upper cervical spinal canal. Resistance varied from 3.8 pascal/ml/s in subjects with to 6.0 pascal/ml/s in subjects without tonsilar herniation. CSF peak velocity varied inversely with flow resistance. Chiari patients had lower flow resistance than controls.
To our knowledge, no similar studies have been published. The velocities at C1 in this study for volunteers and patients, 3.0 and 6.2 cm/s respectively, agree well with previously reported velocities in volunteers and Chiari patients1-3. These peak velocities concur with velocities reported in previous simulation studies 9,10. Velocities in this study increased with cervical spinal level from C1 to C4 or C5 as in a prior study with phase contrast MR in Chiari I patients11.
This study has limitations. The number of subjects, and especially the number of controls, is small. Furthermore, the Chiari patients tended to have a shorter cervical spinal canal compared to the volunteers, related perhaps to the young ages of many patients. Generalizations of these results should therefore be made conservatively.
The Chiari malformation has complex effects on CSF flow. Tonsilar herniation obstructs the flow and causes increased resistance in the region around the foramen magnum. The abnormal tapering of the spinal canal in the Chiari I malformation may reduce the resistance below the foramen magnum. Resistance determines the CSF pressure gradients needed to drive the CSF pulsation during the cardiac cycle.
Lowered resistance may increase CSF pressure fluctuations in the mid cervical region in Chiari patients, where syrinx typically forms in Chiari I patients. Resistance measurements in a larger sample of Chiari patients and matched controls are warranted.
Conclusion
Flow resistance in the subarachnoid space, which can be computed from 3D anatomic images without the need for flow or pressure measurements, may be useful in future investigations of CSF flow parameters in Chiari patients.
References
- 1.Quigley MF Iskandar B Quigley ME et al. Cerebrospinal fluid flow in foramen magnum: temporal and spatial patterns at MR imaging in volunteers and in patients with Chiari I malformation. Radiology. 2004; 232 (1): 229–236. Epub 2004 May 20. [DOI] [PubMed] [Google Scholar]
- 2.Hofmann E Warmuth-Metz M Bendszus M et al. Phase-contrast MR imaging of the cervical CSF and spinal cord: volumetric motion analysis in patients with Chiari I malformation. Am J Neuroradiol. 2000; 21 (1): 151–158. [PMC free article] [PubMed] [Google Scholar]
- 3.Bunck AC Kröger JR Jüttner A et al. Magnetic resonance 4D flow characteristics of cerebrospinal fluid at the craniocervical junction and the cervical spinal canal. Eur Radiol. 2011; 21 (8): 1788–1796. Epub 2011 Mar 15. [DOI] [PubMed] [Google Scholar]
- 4.Hirano M Haughton V Muñoz del Rio A. Tapering of the cervical spinal canal in patients with Chiari I malformations. Am J Neuroradiol. 2012; 33: 1326–1330. [DOI] [PMC free article] [PubMed] [Google Scholar]
- 5.Hammersley J Haughton V Wang Y et al. Tapering of the Cervical Spinal Canal in Patients with Scoliosis with and without the Chiari I Malformation. Am J Neuroradiol. 2012; 33: 1752–1755. [DOI] [PMC free article] [PubMed] [Google Scholar]
- 6.Gu T Korosec FR Block WF et al. PC VIPR: a highspeed 3D phase-contrast method for flow quantification and high-resolution angiography. Am J Neuroradiol. 2005; 26: 743–749. [PMC free article] [PubMed] [Google Scholar]
- 7.Logg A Mardal K-A Wells GN. Automated Solution of Differential Equations by the Finite Element Method. Berlin: Springer; 2011. [Google Scholar]
- 8.Rutkowska G Haughton V Linge S et al. Patient-Specific 3D Simulation of Cyclic CSF Flow at the Craniocervical Region. Am J Neuroradiol. 2012; 33: 1756–1762. [DOI] [PMC free article] [PubMed] [Google Scholar]
- 9.Rutkowska G. Computational Fluid Dynamics in Patient-Specific Models of Normal and Chiari I Geometries. Master thesis. University of Oslo, Norway, 2011. URL: http://urn.nb.no/URN:NBN:no-29196. [Google Scholar]
- 10.Roldan A Wieben O Haughton V et al. Characterization of CSF hydrodynamics in the presence and absence of tonsillar ectopia by means of computational flow analysis. Am J Neuroradiol. 2009; 30: 941–946. Epub 2009 Mar 19. [DOI] [PMC free article] [PubMed] [Google Scholar]
- 11.Shah S Haughton V Muñoz del Río A. CSF Flow through the Upper Cervical Spinal Canal in Chiari I Malformation. Am J Neuroradiol. 2011; 32: 1149–1153. [DOI] [PMC free article] [PubMed] [Google Scholar]


