

Supplemental Digital Content is available in the text
Keywords: blood pressure determination, clinical deterioration, hypertension, measurement, vital signs
Abstract
Background:
To interpret blood pressure (BP) data appropriately, healthcare providers need to be knowledgeable of the factors that can potentially impact the accuracy of BP measurement and contribute to variability between measurements.
Methods:
A systematic review of studies quantifying BP measurement inaccuracy. Medline and CINAHL databases were searched for empirical articles and systematic reviews published up to June 2015. Empirical articles were included if they reported a study that was relevant to the measurement of adult patients’ resting BP at the upper arm in a clinical setting (e.g. ward or office); identified a specific source of inaccuracy; and quantified its effect. Reference lists and reviews were searched for additional articles.
Results:
A total of 328 empirical studies were included. They investigated 29 potential sources of inaccuracy, categorized as relating to the patient, device, procedure or observer. Significant directional effects were found for 27; however, for some, the effects were inconsistent in direction. Compared with true resting BP, significant effects of individual sources ranged from −23.6 to +33 mmHg SBP and −14 to +23 mmHg DBP.
Conclusion:
A single BP value outside the expected range should be interpreted with caution and not taken as a definitive indicator of clinical deterioration. Where a measurement is abnormally high or low, further measurements should be taken and averaged. Wherever possible, BP values should be recorded graphically within ranges. This may reduce the impact of sources of inaccuracy and reduce the scope for misinterpretations based on small, likely erroneous or misleading, changes.
INTRODUCTION
The measurement of blood pressure (BP) is a common procedure that is relied upon in a variety of healthcare settings. In hospital care, its uses include identifying clinical deterioration [1], informing vasoactive drug titration [2] and guiding goal-directed treatment [3]. In general practice, high BP values are used as a basis for the diagnosis of hypertension [4]. Inaccurate or misleading BP values, therefore, can be detrimental to the quality of healthcare received by patients.
Several guidelines have been published with the aim of improving the accuracy of BP measurements by standardizing the associated procedures [4–6]. These have primarily addressed measurements taken at the upper arm and have commonly included recommendations in relation to patient posture, cuff size, arm height, cuff deflation rate and the number of repeated measurements. Studies comparing BP measurements taken with strict adherence to guidelines vs. ‘usual technique’ have reported marked variation and differential treatment decisions between the two methods [7,8]. However, even after training on standardized procedures, BP measurement may be limited in its accuracy [9].
To interpret BP data appropriately, it would be beneficial for healthcare providers to be knowledgeable of the factors that can impact the accuracy of a BP measurement and contribute to variability between measurements. The current systematic review supplements existing guidelines by identifying empirically evaluated potential sources of inaccuracy and summarizing the evidence for each. In so doing, it also addresses the limitations of previous reviews of the BP measurement literature, which have included sources of inaccuracy that lack empirical evidence, or reported estimated effects based on small numbers of empirical studies [10–14]. The resulting list of empirically evaluated potential sources of inaccuracy could be incorporated into evidence-based training packages and used as a reference for clinicians when interpreting BP readings.
METHODS
A systematic literature review was performed to determine and categorize empirically evaluated potential sources of inaccuracy in the measurement of BP in adult patients, and determine the range of estimated effects of these sources of inaccuracy on measured BP values. The scope of this review was limited to studies relevant to upper arm BP measurement in clinical settings, such as wards and offices. Consequently, it did not directly address home BP monitoring, 24-h ambulatory BP monitoring or measurement at locations other than the upper arm.
Initial exploratory searches
To determine a list of potential sources of inaccuracy to investigate, the online databases CINAHL, The Cochrane Library, Medline and PsycINFO were searched using the terms: ‘vital sign measurement’, ‘vital sign AND (error OR accuracy)’, ‘blood pressure determination’, ‘blood pressure measurement’, ‘blood pressure error’, ‘blood pressure accuracy’ and ‘sphygmomanometer error’. Articles obtained from these searches aided the identification of specific sources of inaccuracy and the creation of individual search terms for each (Table 1). Two additional potential sources of inaccuracy (also included in Table 1 and the final searches) were added in response to reviewer comments (i.e. short interval between repeated measurements and acute meal ingestion).
TABLE 1.
MEDLINE and CINAHL EBSCOHost search terms for the preliminary list of potential sources of error (limited by Humans and English language)
| Potential source of inaccuracy | Search terms | Number of results |
| Acute ingestion of food | blood pressure AND (food OR meal OR ingest* OR eat) AND acute effect* NOT (alcohol OR caffein* OR nicotine) | 143 |
| Acute alcohol use | blood pressure AND alcohol AND acute NOT withdraw* | 274 |
| Acute caffeine use | blood pressure AND (caffeine OR coffee OR ‘energy drink*’) AND acute | 139 |
| Acute nicotine use | blood pressure AND (nicotine OR smok* OR cigarette*) AND acute effect* | 215 |
| Bladder distension | ‘blood pressure’ AND ‘bladder distension’ | 23 |
| Cold exposure | blood pressure AND cold expos* | 238 |
| Paretic arm | blood pressure AND (paretic OR paralysed arm OR paralyzed arm) | 9 |
| White-coat effect | blood pressure AND (white coat effect OR white-coat effect) | 294 |
| Indirect measurement | aneroid AND mercury AND blood pressure | 48 |
| General device inaccuracy | sphygmomanometer* AND agreement | 101 |
| Aneroid device inaccuracy | aneroid AND mercury AND blood pressure | 48 |
| Automated device inaccuracy | auto* AND manual AND blood pressure | 231 |
| Pseudohypertension | pseudohypertension OR pseudo-hypertension | 76 |
| Rest period duration | (blood pressure measurement OR measuring blood pressure) AND before AND (wait* or rest*) | 88 |
| Body position | blood pressure AND (body position*) | 224 |
| Leg position | blood pressure AND (leg cross* OR leg position*) | 84 |
| Unsupported back | blood pressure AND (back support* OR supported back OR unsupported back OR back unsupported) | 13 |
| Unsupported arm | blood pressure AND (arm support* OR supported arm OR unsupported arm OR arm unsupported) | 37 |
| Arm position | blood pressure AND arm position* | 117 |
| Cuff size | blood pressure AND (cuff* size* OR bladder* size*) | 221 |
| Cuff tightness | blood pressure AND (loose* OR tight*) AND cuff | 13 |
| Clothing effect | blood pressure AND (clothes OR clothing) | 167 |
| Stethoscope placement | blood pressure AND stethoscope AND (placement OR location) | 4 |
| Talking during measurement | blood pressure measur* AND (talk OR talks OR talking) | 28 |
| Stethoscope head | blood pressure AND diaphragm AND bell | 7 |
| Deflation rate | blood pressure AND deflat* rate | 24 |
| Interval between repeated measurements | (‘blood pressure measurement’ OR ‘blood pressure measurements’ OR ‘blood pressure readings’) AND interval AND time | 142 |
| Number of measurements | blood pressure AND number of measurements | 65 |
| Interarm difference | blood pressure AND (arm difference OR inter-arm difference OR interarm difference) | 134 |
| Auscultatory gap | auscultatory gap | 8 |
| General observer inaccuracy | blood pressure AND (observer error* OR observer factors) | 40 |
| Korotkoff sound interpretation | (korotkoff OR korotkov) AND (sound* OR phase*) | 255 |
| Terminal digit bias | blood pressure AND (terminal digit OR end digit OR final digit OR last digit OR terminal-digit OR end-digit OR final-digit OR last-digit) | 50 |
Final searches
Individual searches were undertaken for each identified source of inaccuracy, using the Medline and CINAHL databases (which had been found to be the most relevant databases in the initial exploratory searches) via EBSCOHost. The searches covered journal articles from the inception of each database through to June 2015 and were limited to English language publications relating to humans. The search terms used for each potential source of inaccuracy are presented in Table 1. Reference lists from acquired empirical articles and systematic reviews were also searched for articles that may have not been identified directly from the database searches.
Inclusion criteria
Publications that contained all of the following were eligible for inclusion in the final analysis:
-
1.
Results from an empirical study relevant to the measurement of adult patients’ resting BP at the upper arm in a clinical setting (e.g. ward or office);
-
2.
Identification of one or more specific potential source(s) of inaccuracy in the measurement of BP; and
-
3.
Quantification of the independent effects of one or more source(s) of inaccuracy on the measured value of SBP and/or DBP; or the prevalence of such an inaccuracy.
Search outcome
The Medline and CINAHL database searches on each individual potential source (Table 1) yielded a total of 3147 articles, excluding duplicates. The abstracts and/or titles of the pooled articles were then evaluated for relevance to the inclusion criteria, after which 783 full texts were obtained. Of these, a total of 328 publications were summarized in this review (Fig. 1) after articles that did not meet the inclusion criteria were excluded (e.g. because they included child participants, confounded multiple potential sources of inaccuracy or did not use a quantifiable measure).
FIGURE 1.
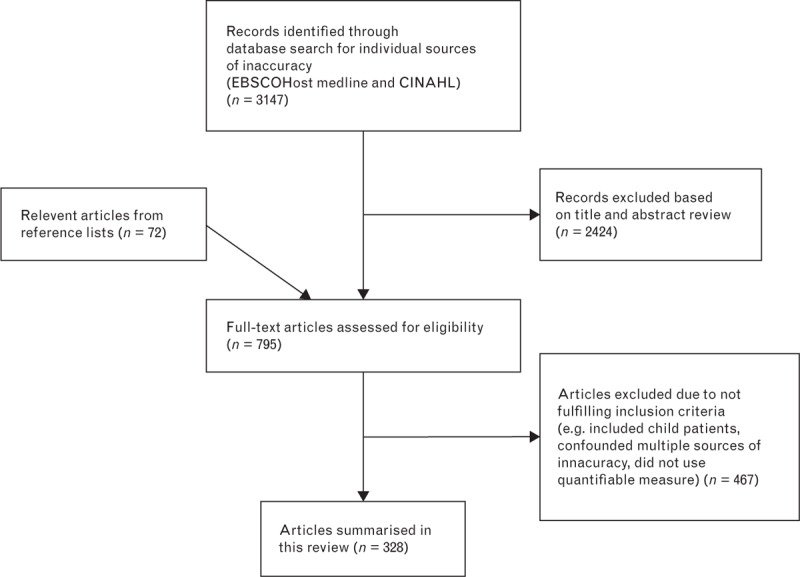
Flow chart showing study selection.
Quality appraisal
Due to the diverse nature of research questions and study methodologies reported, the Standard Quality Assessment Criteria for Evaluating Primary Research Papers from a Variety of Fields were considered appropriate for quality appraisal [15]. These criteria can be used to assess the quality of various types of empirical studies by rating aspects of the design, participants, analysis and results. Summation of the individual scores for each area was used to represent the overall quality of a study, expressed as a percentage of the maximum possible score applicable to the study. These quality indicators are not directly comparable due to the many differences between studies. However, they can be used as a guide when interpreting the quality of evidence from individual studies (Supplementary Tables 1–29).
Data extraction
After selection of articles from title and abstract review, the full-texts of potentially relevant articles were analysed. Information relating to country of origin, observers, participants, devices and procedures was extracted from articles meeting the inclusion criteria, along with the effects of the specific source of inaccuracy on patients’ SBP and/or DBP, or its prevalence. Extracted information varied depending on the source of inaccuracy, with some sources requiring more categories of data to be obtained than others. These procedures were conducted by one reviewer (N.K.) and checked by another (M.O.W.), with disagreements resolved through discussion.
Synthesis
Meta-analysis was not considered appropriate due to the diversity of research questions addressed by the articles (a total of 29 potential sources of inaccuracy were identified), and marked variation in methodologies, reporting detail and study populations. Instead, study results were aggregated in a table outlining the empirically evaluated potential sources of inaccuracy, and the ranges of their reported mean effects across studies (Table 2). Note that ranges expressed in mmHg (i.e. results for all potential sources of inaccuracy except device calibration error and terminal digit preference for zero) only include statistically significant effects. However, detailed descriptions of all studies that met the inclusion criteria (including those that lacked significance testing) are included in the data supplement, in which they are organized into tables according to the relevant potential source of inaccuracy (Supplementary Tables 1–29). For ease and consistency of communication, we adopted the following conventions in our narrative descriptions of the size of potential inaccuracies in BP measurement: small = less than 5 mmHg, moderate = 5–15 mmHg and large = greater than 15 mmHg.
TABLE 2.
Empirically-evaluated potential sources of inaccuracy in the measurement of adults’ resting blood pressure (note that ranges expressed in mmHg include only significant effects and hence exclude results from studies reported in Supplementary Tables that lacked significance testing)
| Range of reported significant mean effects (in mmHg) unless specified | |||
| Potential source of inaccuracy | SBP | DBP | Suppl. Table number |
| Patient-related | |||
| 1. Acute meal ingestion [16,17] | −6a | −5 to −1.9 | 1 |
| 2. Acute alcohol use [18–35] | −23.6 to +24 | −14 to +16 | 2 |
| 3. Acute caffeine use [40–74] | +3 to +14 | +2.1 to +13 | 3 |
| 4. Acute nicotine use or exposure [70,75–103] | +2.81 to +25 | +2 to +18 | 4 |
| 5. Bladder distension [104–106] | +4.2 to +33 | +2.8 to +18.5 | 5 |
| 6. Cold exposure [107–115] | +5 to +32 | +4 to +23 | 6 |
| 7. Paretic arm [116,117] | +2a | +5a | 7 |
| 8. White-coat effect [120–160] | −12.7 to +26.7 | −8.2 to +21 | 8 |
| Device-related | |||
| 9. Device model bias | |||
| Mercury models | |||
| vs. invasive criterion [167–170] | −10.6 to −4 | +1.9 to +4 | 9A |
| Aneroid models | |||
| vs. invasive criterion [162,171,172] | −9.7 to −4.0 | +5.1a | 9B |
| vs. noninvasive criterion [173–179] | −0.8a | −1.7a | 9C |
| Automated models | |||
| vs. invasive criterion [162,167,168,171,182–189] | −23 to +6 | −3 to +5.6 | 9D |
| vs. noninvasive criterion [167,176,190–227] | −3.7 to +16.53 | −8 to +9.71 | 9E |
| 10. Device calibration error | |||
| Mercury [229–238] | 0–61.8% of individual devices > ±3 mmHg calibration error | 10A | |
| Aneroid [229–237,239–247] | 1.4–69.7% of individual devices > ±3 mmHg calibration error | 10B | |
| Automated [229–231] | 4.5–26% of individual devices > ±3 mmHg calibration error | 10C | |
| Procedure-related | |||
| 11. Insufficient rest period [249,250] | +4.2 to +11.6 | +1.8 to +4.3 | 11 |
| 12. Body position | |||
| Standing [251,252] | −2.9 to +5 | +7a | 12 |
| Supine [251–259] | −10.7 to +9.5 | −13.4 to +6.4 | 12 |
| 13. Legs crossed at knees [260–266] | +2.5 to +14.89 | +1.4 to +10.81 | 13 |
| 14. Unsupported back [267] | No significant effects reported | +6.5a | 14 |
| 15. Unsupported arm [268–270] | +4.87a | +2.7 to +4.81 | 15 |
| 16. Arm lower than heart level [255,269,271–278] | +3.7 to +23 | +2.8 to +12 | 16 |
| 17. Incorrect choice of cuff size | |||
| Smaller cuff [279–283] | +2.08 to +11.2 | +1.61 to +6.6 | 17 |
| Larger cuff [279–283] | −3.7 to −1.45 | −4.7 to −0.96 | 17 |
| 18. Cuff placed over clothing [284–287] | No significant effects reported | No significant effects reported | 18 |
| 19. Stethoscope under cuff [288,289] | +1.0 to +3.1 | −10.6 to −3.5 | 19 |
| 20. Talking during measurement [290–295] | +4 to +19 | +5 to +14.3 | 20 |
| 21. Use of stethoscope bell (vs. diaphragm) [267,296–299] | −3.8 to +1.54 | −1.61a | 21 |
| 22. Excessive pressure on stethoscope head [300] | No significant effects reported | −15 to −9 | 22 |
| 23. Fast cuff deflation rate [301–303] | −9 to −2.6 | +2.1 to +6.3 | 23 |
| 24. Short interval between measurements [304–306] | No significant effects reportedb | No significant effects reported | 24 |
| 25. Reliance on a single measurement [147,258,259,275,307,308] | +3.3 to +10.4 | −2.4 to +0.6 | 25 |
| 26. Interarm variability [311–325] | |3.3| to |6.32| | |2.7| to |5.06| | 26 |
| Observer-related | |||
| 27. Observer hearing deficit [328] | −1.55 to −0.11 | +1.05 to +4.32 | 27 |
| 28. Korotkoff Phase IV (vs. V) for DBP [334,335] | N/A | +12.5a | 28 |
| 29. Terminal digit preference for zero [8,275,334,336–366] | 1–79% over-representation of terminal zero | 3–79% over-representation of terminal zero | 29 |
aOnly one study found a significant effect.
bNo study found a significant directional effect (although one found reduced variation in SBP).
RESULTS
A total of 328 full-text articles were summarized in this review. Collectively, these studies investigated a total of 29 distinct empirically evaluated potential sources of inaccuracy in the measurement of adult BP in clinical settings. These sources were organized into four categories, similar to those used in previous reviews: patient-related, device-related, procedure-related and observer-related [11,13,14]. Results for the potential sources of inaccuracy within each category are summarized in Table 2 and outlined below. Each potential source of inaccuracy has been numbered (from 1 to 29) to facilitate cross-referencing between text and tables.
Patient-related sources of inaccuracy
BP is a dynamic variable: its value naturally changes over time and within different regions of the body. This review identified eight distinct empirically evaluated patient-related sources of inaccuracy that may cause additional variation, contributing to an underestimation or overestimation of the patient's ‘true’ resting BP.
1. Acute meal ingestion
Two studies were included that reported the effect of acute meal ingestion on BP (Supplementary Table 1) [16,17]. One study reported the effects of a mixed meal at two specific intervals after ingestion, finding moderate significant decreases in both SBP and DBP at 180 min, but no significant effect at 60 min. The other study assessed the mean effect of a light breakfast meal over a 2-h period after ingestion (averaging over measurements taken every 15 min) finding no significant effect on SBP and a small decrease in DBP.
2. Acute alcohol use
Eighteen studies were included that reported the effect of acute alcohol ingestion on BP (Supplementary Table 2) [18–35]. Alcohol dosages ranged from 0.4 to 1 g/kg (relative to the participant's body weight), and one study reported an absolute dosage of 41 g [18]. Significant effects of acute alcohol ranged from large decreases to large increases in SBP, and moderate decreases to large increases in DBP (Table 2). Only a small number of studies found no significant effects. The studies employed inconsistent time intervals between alcohol consumption and measurement (ranging from 5 min to 4 h). However, with the exception of only two studies [21,28], all significant increases were measured within 60 min of consumption, and all significant decreases from 60 min to 4 h postconsumption. Of the exceptions, one study found significant decreases in both SBP and DBP 30 min after ingestion [21]. The other study was not directly comparable because it reported the maximum BP response up to 3-h postconsumption, rather than using a fixed time interval [28].
3. Acute caffeine use
Three systematic reviews and one narrative review were identified that assessed the short-term effect of caffeine consumption on BP [36–39]. A total of 35 empirical studies that were eligible for inclusion in this review were identified, some having been included previously in other reviews (Supplementary Table 3) [40–74]. Common caffeine dosages evaluated were 3.3 mg/kg (relative to the patient's weight) and 250 mg (absolute). Others ranged from relative dosages of 1.5–6.0 mg/kg and absolute dosages of 67–400 mg. All reported significant mean effects on SBP or DBP were increases, ranging in magnitude from small to moderate (Table 2). Some small caffeine dosages, such as 100 and 200 mg, were not consistently reported to have a significant effect on BP [59,61]. Studies also employed different time intervals between consumption and measurement (with those intervals that were fixed ranging from 30 to 270 min). Significant effects were reported for intervals as long as 180 min after consumption.
4. Acute nicotine use or exposure
A total of 30 articles measuring the short-term effect of cigarette smoking, nicotine ingestion or passive cigarette smoke exposure were evaluated (Supplementary Table 4) [70,75–103]. The reported significant effects ranged from small to large increases for both SBP and DBP (Table 2). The majority of studies reported dosages in mass of nicotine, ranging from 0.4 to 13 mg. Other dosages included one and four cigarettes over 1 h, both of unspecified nicotine content [80,94]. Most studies examined the effect of conventional cigarette smoking; however, the effects of electronic cigarettes, bidi cigarettes, cigars, Arabian pipes, nicotine tablets, nicotine patches, nicotine gum and snuff tobacco were also reported. Studies also used different time intervals between nicotine use and measurement (including during, immediately after and up to 60 min later). Significant effects of acute nicotine use were measured as far as 20–30 min after smoking, 30 min after snuff chewing and 40–60 min after ingesting a 4-mg nicotine tablet.
The four studies that investigated the effect of passive smoking employed exposure durations of 30–60 min [100–103]. Of these, only two studies reported significant effects. One found large increases to both SBP and DBP [100]; in the other study, however, the increases were only moderate and were confined to SBP in male participants [103].
5. Bladder distension
Three studies were included that reported the effect of a full bladder on BP (Supplementary Table 5) [104–106]. Effects ranged from small to large increases in both SBP and DBP (Table 2). In the study that found only small effects, participants drank as normal over a mean period of 7 h, with BP measured before and after voiding their full bladders [104]. The other studies found large increases in both SBP and DBP within 60 min after drinking 1200 ml of water [106], and after drinking water until the urge to void became irresistible [105].
6. Cold exposure
Nine studies that assessed the effect of patient exposure to cold were identified (Supplementary Table 6) [107–115]. Reported effects ranged from moderate to large increases in SBP and small to large increases in DBP (Table 2). These studies compared resting BP at varying temperatures. The majority compared air temperatures, whereas some used skin temperatures. All studies found that exposure to cold significantly increased SBP (and, where reported, DBP).
7. Paretic arm
Two studies were evaluated that compared BP measurements between the intact and paretic arms of stroke patients (Supplementary Table 7) [116,117]. One found that measurements from paretic arms yielded small but significant increases in both SBP and DBP relative to measurements from intact arms (Table 2) [117]. The other study found no significant effects for either SBP or DBP [116].
8. White-coat effect
The white-coat effect is the phenomenon in which a patient's BP changes when in the presence of a clinician. Generally, this change is assumed to involve an increase in both SBP and DBP from normal daytime values [4]. Two systematic reviews with meta-analyses relating to the white-coat effect were identified in the literature search [118,119]. However, these focused on the differences in white-coat effect between age groups and ethnic groups, respectively, and not on the mean white-coat effect in general.
A total of 41 empirical studies were analysed in the current study, including some that had not been included in the aforementioned systematic reviews. A large range of estimates for the white-coat effect was apparent (Supplementary Table 8) [120–160]. Reported significant effects of the presence of a clinician ranged from moderate decreases to large increases in both SBP and DBP (Table 2). The most common method used to quantify the white-coat effect was to compare daytime ambulatory or home self-measurements with those made by a clinician in a clinical setting. By subtracting patients’ normal daytime BPs from clinical measurements, the impact of the clinician's presence and the clinical setting could be quantified. A negative white-coat effect indicated that, on average, patients’ BP decreased in the presence of a clinician, whereas a positive value indicated that it increased. Of the studies that yielded significant results, all but four produced only positive mean white-coat effects. Of the four exceptions, one produced only negative mean effects [158], and three produced positive and negative effects for different sample groups [145,147,148]. Characteristics of the observers and patients (such as age, sex, ethnic group and the presence of hypertension) differed between studies and sample groups and may therefore have impacted the magnitude and direction of reported effects. The aforementioned systematic reviews addressed some of these differences, finding that older patients experienced greater positive white-coat effects than younger patients [118], and South Asian patients experienced smaller white-coat effects than patients of African or European descent, on average [119].
Further potential patient-related sources of inaccuracy
Other potential sources of inaccuracy were mentioned in the reviewed literature; however, they lacked valid empirical evidence for their effects in clinical settings. These included soft Korotkoff sounds (the audible cues heard from the stethoscope when performing manual sphygmomanometry) [13], and time of day [161].
Device-related sources of inaccuracy
There are two primary methods of BP measurement: invasive and noninvasive. Invasive, or intra-arterial, BP measurement through the use of a catheter is regarded as the gold standard of BP measurement [162,163]. However, due to its invasiveness, it is used less commonly than noninvasive alternatives. Most noninvasive BP measurements typically make use of an inflatable cuff to temporarily occlude blood flow in the upper arm. As the cuff is deflated, different methods can be employed to determine the SBP and DBP, depending on the type of device. These include the use of auditory or oscillometric cues.
9. Device model inaccuracy
A variety of sphygmomanometer devices can be used for noninvasive measurement of BP. Two primary types of clinical device were identified: manual and automated. Manual sphygmomanometers can be either mercury or aneroid. Due primarily to the toxicity of mercury, the use of mercury-free devices (both aneroid and automated) has increased in recent years [164].
Two methods of measuring the inaccuracy of different models were apparent in the literature: comparison with invasive measurement and comparison with noninvasive ‘standard manual measurement’. Reported inaccuracies from these two methods are discussed separately. The standard reporting of the inaccuracy of devices includes the mean bias (i.e. the average of the difference scores, which may be positive or negative) and 95% limits of agreement. For a particular study comparing a test device to a criterion standard (e.g. invasive measurement), these limits specify the lowest and highest difference scores that would fall within 2 SDs of the mean difference score for that particular sample, thus capturing approximately 95% of difference scores. The width of the limits of agreement indicates how much the difference score (or bias) varies from measurement-to-measurement. Wider limits of agreement indicate greater variation, whereas narrow limits indicate less variation. Therefore, when interpreting the accuracy of a device, both the mean bias and the width of the limits of agreement should be considered [165,166]. Supplementary Tables 9A–9E include the mean biases and 95% limits of agreement for all included studies of device model inaccuracy.
Mercury devices: Four studies were identified that examined the accuracy of mercury devices in comparison with the criterion standard of invasive measurement (Supplementary Table 9A) [167–170]. Three of these investigated standard mercury devices, whereas one investigated the accuracy of a random-zero device. Reported significant mean biases ranged from small to moderate underestimation of SBP, and small overestimation of DBP (Table 2), with moderately wide limits of agreement in each study (between ±13 and ±16.2 mmHg for SBP, and between ±6 and ±13 mmHg for DBP).
Aneroid devices: Three studies reported the bias of three different models of aneroid device compared with invasive measurement (Supplementary Table 9B) [162,171,172]. All studies reported underestimation of SBP (including two small-to-moderate significant effects) and overestimation of DBP (including one moderate significant effect) (Table 2). There was noticeable variation in the widths of the limits of agreement across studies, indicating the variability in accuracy between devices (between ±8.6 and ±27.1 mmHg for SBP, and between ±4.6 and ±14 mmHg for DBP).
Seven studies compared a total of seven different aneroid models to a noninvasive criterion standard manual measurement (Supplementary Table 9C) [173–179]. Significant reported biases were small underestimations of both SBP and DBP (Table 2). Again, there was noticeable variation in the widths of the limits of agreement (between ±4.4 and ±25 mmHg for SBP, and between ±5.2 and ±15.64 mmHg for DBP).
Automated devices: Two systematic reviews were identified that examined the accuracy of different models of automated devices [180,181]. Twelve empirical studies evaluated the accuracy of 17 different models of automated devices compared with invasive measurement (Supplementary Table 9D) [162,167,168,171,182–189]. Reported significant mean biases ranged from large underestimation to moderate overestimation of SBP and small underestimation to moderate overestimation of DBP (Table 2). There was very marked variation in the width of the 95% limits of agreement with the invasive criterion, reflecting the diversity of automated devices that were evaluated (between ±10 and ±52.9 mmHg for SBP, and between ±8 and ±29.2 for DBP).
A total of 40 studies compared 33 different automated models with a noninvasive criterion standard (Supplementary Table 9E) [167,176,190–227]. The majority of studies used standard mercury measurement as the criterion, although some used aneroid measurement. Significant mean biases ranged from small underestimation to large overestimation for SBP and moderate underestimation to moderate overestimation for DBP. Again, there was marked variation in the width of the 95% limits of agreement (between ±5.2 and ±35.9 mmHg for SBP, and between ±3.8 and ±26.68 mmHg for DBP).
Various reasons why the discrepancy between noninvasive and invasive measures might be more apparent in some patients than others were also discussed in the literature. For example, patients with shock have been identified to exhibit lower noninvasive SBP than invasive SBP [169]. In addition, erroneously high BP values from noninvasive techniques, known as pseudohypertension, may be related to arterial stiffness [228].
10. Device integrity and calibration
Incorrect calibration or poor device integrity can affect all types of sphygmomanometers. This can lead to measurement error in either direction that is constant for a particular device (at least in the short-term). One review [164] and nineteen empirical studies were identified. Ten of these empirical studies assessed the calibration accuracy of mercury sphygmomanometers (Supplementary Table 10A) [229–238], 18 assessed aneroid sphygmomanometers (Supplementary Table 10B) [229–237,239–247] and three assessed automated devices (Supplementary Table 10C) [229–231]. The common method of analysing device inaccuracy was to measure the deviation of sphygmomanometer readings from a known accurate criterion device. The majority of studies categorized an individual sphygmomanometer as inaccurate if it showed a discrepancy of greater than ±3 mmHg from a criterion device. However, thresholds of ±4 and ±5 mmHg were also employed in some studies [242,247].
The prevalence of inaccurate devices varied greatly between studies and device types, with more than half of the tested devices showing inadequate accuracy in some studies, but fewer than 5% in other studies (Table 2). It should be noted that different studies evaluated the accuracy of sphygmomanometers at different pressures, and this may limit general comparisons between studies and device types. Specific issues with sphygmomanometers that were reported to decrease accuracy included blocked vents and leaky bulb valves [238,239,248].
Procedure-related sources of inaccuracy
Standardized guidelines for clinical BP measurement have primarily targeted aspects of the procedure that may contribute to measurement inaccuracy. These include the position and posture of the patient and the appropriate size and placement of the cuff. The current review identified 16 empirically evaluated procedure-related sources of inaccuracy.
11. Insufficient rest period
Few studies directly assessed the effect of rest period duration on BP. Of these, two were deemed to be eligible for inclusion in this review (Supplementary Table 11) [249,250]. The studies differed in methodology, including the rest periods that they compared (i.e. 5 vs. 10 and 0 vs. 16 min) but both found that patients had significantly higher SBP and DBP if they did not rest for a sufficient period of time prior to measurement. It was shown that resting for 10 or 16 min could decrease SBP by a small-to-moderate amount and DBP by a small amount (Table 2). However, it is unclear from these results whether longer rest periods are necessary to completely reverse the effects of prior physical activity.
12. Body position
Nine studies comparing patient body positions were included in this review (Supplementary Table 12). Of these, only two studies investigated the effects of standing, and they yielded bidirectional results. One study reported moderate increases for both SBP and DBP (in hypertensive patients) [251], whereas the other reported a small decrease in SBP and no significant effect on DBP, compared with sitting (in healthy young adults) [252].
All studies in this category compared supine posture with sitting posture [251–259]. The supine position generally yielded small-to-moderate significant increases in SBP relative to the sitting position [252,253,255,258,259]. Although one study showed a statistically significant moderate decrease in SBP, the researchers did not control for order effects; consequently, participants had been resting for a longer period by the time that their BP was measured in the supine position [254]. A further two studies found no statistically significant effect [251,256]. Similarly, DBP was shown to be affected bi-directionally by supine posture: most studies reported significant decreases [251,253,254,256,258] but two reported significant increases [255,259]. These effects ranged from moderate decreases to moderate increases (Table 2).
13. Legs crossed at knees
The effect of leg position was assessed by comparing legs crossed at the knee with feet flat on the floor. All seven identified studies reported an increase in SBP when legs were crossed compared with sitting with feet flat (Supplementary Table 13) [260–266]. Significant effects ranged from small to moderate increases in both SBP and DBP.
14. Unsupported back
A single study was evaluated that addressed the effect of back support on BP measurement (Supplementary Table 14) [267]. It was reported that sitting on a table with no back support increased DBP (but not SBP) by a moderate amount, compared with sitting on a chair with back support (Table 2). However, the results should not be overinterpreted as the study did not control for potential confounds between the table and the chair, such as height (which may have affected whether or not participants’ feet reached the floor) and level of comfort.
15. Unsupported arm
Three studies addressed measurement of BP in an unsupported arm compared with a supported arm (Supplementary Table 15) [268–270]. Small but significant increases were reported for both SBP and DBP when measured in the unsupported arm (Table 2).
16. Arm lower than heart level
The height of the measured arm relative to the heart was also found to affect BP. Ten studies included in this review compared BP when the measured arm was at heart level vs. lower than heart level (Supplementary Table 16) [255,269,271–278]. Both SBP and DBP were found to increase (by a small to large amount) when the arm was lower than heart level (Table 2). The majority of studies compared measurements of the arm at heart level with the arm hanging by the patient's side. The magnitude of the increase may also have been affected by body position (which varied among standing, sitting and supine), or the absolute or relative distance of the arm from heart level (which was seldom reported).
17. Incorrect choice of cuff size
Five studies included in this review indicated that cuff width affected BP values (Supplementary Table 17) [279–283]. Generally, an erroneous reduction in cuff size significantly increased the measurements for SBP and DBP (to a small or moderate degree), whereas an increase in cuff size significantly decreased the measurements (to a small degree) (Table 2). Most studies compared specific cuff sizes with the recommended cuff size, which was dependent on the arm circumference of the patient (Supplementary Table 17 for details).
18. Cuff placed over clothing
Four studies were included that examined the effect of measuring BP with the cuff placed over clothing (Supplementary Table 18) [284–287]. However, all reported nonsignificant effects. Guidelines often specify that the sphygmomanometer cuff should be placed over a bare arm; however, the empirical evidence does not provide any clear support for this recommendation (Table 2).
19. Stethoscope under cuff
Two studies addressed the effect of placing the stethoscope under the cuff during auscultation (Supplementary Table 19) [288,289]. They reported small but significant increases in measured SBP and small-to-moderate decreases in measured DBP, when compared with placing the stethoscope in the recommended position outside the cuff (Table 2).
20. Talking during measurement
Six studies on the effect of the patient talking during BP measurement were evaluated, all of which found increases in both SBP and DBP (Supplementary Table 20) [290–295]. Significant effects ranged from small to large increases for SBP, and small-to-moderate increases for DBP, compared with not talking (Table 2). However, variation in methodologies between studies, including the verbal content, may have affected the magnitude of BP increases.
21. Use of stethoscope bell (vs. diaphragm)
Five studies were identified that investigated the effect of using the bell rather than the diaphragm of the stethoscope to measure Korotkoff sounds (Supplementary Table 21) [267,296–299]. Two studies reported significant effects of using the bell [297,299]. It reduced the SBP measurement by a small amount in trauma patients and increased it by a small amount in young women (Table 2). In these studies, the effect on DBP ranged from no difference to a small decrease (for young women). Other similar studies found no significant difference between bell and diaphragm.
22. Excessive pressure on stethoscope head
One study reported moderate decreases in the value of DBP when excessive force was applied to the head of the stethoscope during auscultation, with greater force yielding a greater decrease (Table 2; Supplementary Table 22) [300].
23. Fast cuff deflation rate
Three studies examined the effect of cuff deflation faster than the recommended 2–3 mmHg/s (Supplementary Table 23) [301–303]. Reported significant effects ranged from small to moderate decreases in SBP and small to moderate increases in DBP (Table 2). The magnitude of effects was found to depend on the speed of deflation and the patient's heart rate.
24. Short interval between measurements
Three studies were identified that investigated the effect of a shorter-than-usual interval between subsequent measures (Supplementary Table 24) [304–306]. Of these, only two reported the mean differences in SBP and DBP between different intervals (specifically 15 s vs. 1 min and 1 vs. 2 min), but they were not statistically significant. The third study did not report mean differences as it was focused specifically on variation (i.e. fluctuation) in BP. Results indicated that, when a standard mercury sphygmomanometer (but not an electronic device) was used, SBP (but not DBP) measures were significantly less variable when consecutive measurements were taken with no interval to separate them vs. a 1-min interval.
25. Reliance on a single measurement
Six studies were identified that investigated potential variability between consecutive measurements of BP (Supplementary Table 25) [147,258,259,275,307,308]. The intervals between compared measurements ranged from 1 to 45 min. Studies reporting statistically significant differences consistently found that, on average, initial measurements of SBP were higher by small-to-moderate amounts, compared with measurements taken 1–25 min later. However, of the two studies that reported a significant mean difference in SBP (both of which employed a 2-min interval and yielded a small effect), the initial measurement was higher in one study [147], and lower in the other [259] (Table 2). These findings were interpreted as indicating a need for multiple consecutive measurements to minimize inaccuracy.
26. Interarm variability
Two systematic reviews on the differences in BP between the left and right arms of individuals were identified [309,310]. Fifteen empirical studies, some already included in these reviews, were analysed (Supplementary Table 26) [311–325].
Because individuals can differ in terms of which arm (i.e. right or left) will yield higher BP readings, some studies reported absolute interarm differences (i.e. calculated for each participant by deducting the lower value from the higher value, irrespective of which arm each was measured at, before averaging). These studies reported small-to-moderate significant mean absolute interarm differences for both SBP and DBP (Table 2). For a patient whose BP is only measured in one arm, these values can be regarded as estimates of the average amount by which their apparent BP may have been higher or lower if it had been measured using the other arm.
Among studies that instead deducted the values for one specific arm from the values for the other arm before averaging, small-to-moderate significant mean interarm differences were also reported for SBP (+1.6 to +5.1 mmHg) and DBP (−1.4 to +3.73 mmHg) (standardized as right minus left). However, these latter figures represent estimates of the extent to which one specific arm tends to yield a higher apparent BP in the study population (e.g. positive values indicate that the right arm is higher), rather than the likely magnitude of interarm differences for patients within that population. This is because, in averaging over participants, values from those who have higher right-arm BP will, to some extent, ‘cancel out’ values from those who have higher left-arm BP (and vice-versa).
Further potential procedure-related sources of inaccuracy
Other unsubstantiated procedure-related sources of inaccuracy that were mentioned in the reviewed literature included the temperature of the stethoscope or the examiner's hands, environmental noise and initial inflation into an auscultatory gap [13]. This gap exists in some patients and is a range between SBP and DBP in which there are no audible Korotkoff sounds [326,327].
Observer-related sources of inaccuracy
Sources of inaccuracy related to the observer are primarily apparent during manual sphygmomanometry (either mercury or aneroid). Empirically evaluated sources of inaccuracy of this kind included observer hearing deficit, incorrect Korotkoff sound interpretation and terminal digit bias.
27. Observer hearing deficit
One study was identified that assessed the impact of hearing loss on the manual measurement of BP (Supplementary Table 27) [328]. When hearing loss of 5, 10, 15, 20 and 25 dB was simulated across all frequencies, small decreases in SBP and small increases in DBP values were reported (Table 2).
However, the flat decrease of 5–25 dB across all frequencies does not accurately represent common forms of hearing loss, such as presbyacusis (age-related). Presbyacusis primarily affects the detection of higher frequency sounds, particularly those with frequency bands greater than 1000 Hz, whereas Korotkoff sounds have frequencies of 20–300 Hz [329–331]. Therefore, conclusions from this study should not be generalized to actual hearing loss.
28. Korotkoff sound interpretation
The pressures at which Korotkoff sounds appear and disappear in manual sphygmomanometry correspond to the SBP and DBP, respectively. Differing interpretation of these sounds can have a bidirectional effect on measurement. There has been debate regarding which phase of Korotkoff sounds best corresponds to the DBP – phase IV (muffling of sounds) or phase V (disappearance of sounds) [332,333]; however, phase V has been recommended for most circumstances [4]. Two studies were evaluated that quantified the effect of different Korotkoff sound interpretations (Supplementary Table 28) [334,335]. Measuring DBP at phase IV (rather than phase V) was reported to significantly increase the DBP measurement by a moderate amount (Table 2).
29. Terminal digit preference for zero
Terminal digit bias refers to the preference to round BP readings to a specific end-digit, usually zero. An observer who biases zero as an end digit may, for example, record 120 mmHg when the sphygmomanometer shows a value between 117 and 122 mmHg. Thirty-four studies were identified that reported over-representation of terminal zeros in BP records, indicative of such a bias (Supplementary Table 29) [8,275,334,336–366]. Given that the expected frequency of terminal zero is 20% (because measurements are generally recorded to the nearest even number), approximately 79% of all SBP and DBP values analysed may have included erroneous terminal zeros in the study that reported the highest prevalence (i.e. 99%) (Table 2) [350].
Further potential observer-related sources of inaccuracy
Other observer-related sources of inaccuracy were mentioned in the reviewed literature but found to lack sufficient empirical evidence. These included value bias and visual impairment [4]. Value bias is related to, but distinct from, terminal digit bias. Although terminal digit bias is a preference for a specific final digit of the reading, value bias relates to the entire value of the reading. For example, in one study, there was a reported preference for recording 88 mmHg for DBP when a value of 90 mmHg would lead to treatment consideration [358]. In addition, one article examined ‘gauge reading errors’ relating to the reading of a mercury column in conjunction with Korotkoff sounds [367]. The researchers assessed the readings of groups of novice and experienced individuals in a single-trial simulation. They reported under-reading for SBP and over-reading for DBP, compared with the true value. In addition, there was notable variability between observers, as indicated by a moderately sized SD. However, due to the highly simplified representation of the mercury column as a rectangular bar presented on a computer screen, the single-trial design and a lack of statistical significance testing, the conclusions that can be drawn from this particular study are extremely limited.
DISCUSSION
The current systematic review has described 29 empirically evaluated potential sources of inaccuracy in the measurement of adults’ resting BP at the upper arm in clinical settings, such as wards and offices (Table 2). Each of these was categorized as relating to either: the patient, the device, the procedure or the observer. Significant directional effects on SBP and/or DBP were found for 27 of the 29 potential sources of inaccuracy, and the ranges of these effects were presented for each source. The significant effects of individual sources were highly variable and ranged from a mean underestimation of 24 mmHg to a mean overestimation of 33 mmHg for SBP, and a mean underestimation of 14 mmHg to a mean overestimation of 23 mmHg for DBP. Differences of this magnitude between ‘true’ resting BP and measured BP can have important implications in several clinical domains, including the physiological monitoring of inpatients, and the diagnosis and surveillance of hypertension.
Clinical impact
Patient monitoring
The majority of patient monitoring protocols, such as track-and-trigger systems, incorporate routine BP measurement, obtained through either manual or automated methods [1]. Typically, the patient's vital sign values are compared against predefined ranges to determine whether they are ‘normal’ or ‘abnormal’ and, in some cases, to categorize the extent of any deviation from the normal range. Monitoring protocols also vary in terms of the mechanisms by which clinical responses are triggered [368,369]. In some systems, a criterion breach in relation to just one individual vital sign – such as SBP – can be enough to trigger a clinical response, whereas other systems require multiple vital signs to reach predefined thresholds before a response is triggered. More complex monitoring protocols utilize both of these mechanisms in different circumstances.
The current systematic review has presented evidence indicating that up to 25 factors may affect the accuracy and interpretability of any particular SBP measurement (and up to 27 for DBP). The magnitude of these potential effects ranged from small to large in both the positive and negative directions, and some individual sources of inaccuracy had potentially bidirectional effects. Therefore, the net effect of multiple sources may be negative, positive or (in some cases) neutral. However, in practice, it will often be impossible to know how many sources of inaccuracy influenced a particular BP measurement recorded on an observation chart. The results of this systematic review therefore call into question the use of patient monitoring protocols in which a single criterion breach in relation to SBP alone triggers a clinical response. Such trigger protocols are more vulnerable to overestimation or underestimation of SBP compared with triggers that incorporate multiple vital signs; that is, they are likely to have higher sensitivity coupled with lower specificity. However, all patient monitoring protocols could be improved by more appropriate interpretation of BP values.
One potential suggestion to discourage unjustified reliance on precise BP values is to use observation charts in which observations are simply recorded as dots (or, in the case of BP, arrowheads) in a series of range rows, rather than recording the precise values numerically. Recent experimental results suggest an additional advantage of recording vital sign data (including BP) as dots/arrowheads in a graphical format. Specifically, novice chart-users who were tested using a range of observation chart designs identified abnormal vital signs faster and more accurately when recorded this way rather than as numbers, even when those numbers were presented in otherwise identical quasi-graphs [370]. That is, in addition to their limited interpretability, the presence of numerical vital signs on a chart can actually impair user-performance.
An important caveat to the findings of this systematic review is that hypotensive patients were seldom studied in the reviewed literature, with most participants being normotensive or hypertensive. The extent to which the identified sources of inaccuracy generalize to hypotensive deteriorating patients is not apparent, and replications utilizing varying populations would help to clarify this.
Goal-directed treatment and blood pressure maintenance
Recommendations for goal-directed therapy often specify target BP values [371,372]. However, given potential measurement inaccuracies and transient changes in patient-related and procedure-related factors, a difference between two subsequent BP readings (in some cases, even a seemingly substantial difference) may not indicate a meaningful change. This should be considered when attempting to maintain BP within a narrow range of values. If a single reading deviates slightly from the desired range, it is unlikely that immediate action, such as titration of vasoactive drugs, would be required; and it may even be counterproductive.
It is important to recognize that many of the identified sources of inaccuracy may not apply to invasive measurement, which may be employed in acute care settings. This is particularly true of sources relating to the device and the procedure. However, although the sources of inaccuracy may vary between contexts, the general principle that BP measurement can be inaccurate, and is seldom likely to be precise, applies to all known methods of measurement.
Hypertension diagnosis and treatment
Errors such as terminal digit bias can have significant impacts on clinical outcomes. For example, in one study population, simply changing the definition of hypertension from SBP of ‘140 mmHg or greater’ to ‘greater than 140 mmHg’ would have decreased the prevalence of diagnosed hypertension from 25.9 to 13.3%, as the cut-off value no longer contained a terminal zero [362]. This potential decrease was the result of minimizing the effect of a single source of inaccuracy, and there is also a need to consider the potential cumulative effects of multiple sources before making clinical diagnoses. Repeated measurement of BP at multiple clinic visits is strongly advised before treatment for hypertension is initiated or adjusted.
Conclusion and limitations
It was not the purpose of this review to critique current clinical guidelines for BP measurement, particularly given the international readership of the journal and the variation in guidelines across jurisdictions. Rather, our goal was to supplement existing guideline recommendations with additional evidence-based information (which may also be of use to those charged with reviewing the guidelines or commissioning further empirical research designed to inform them). In considering the evidence, it should be noted that standardized procedures can be used to target many of the identified sources of inaccuracy but lack the ability to negate issues such as the white-coat effect, device model bias, and most observer-related factors. However, the impact of some of these sources of inaccuracy may be decreased by employing multiple observers and through training programmes focused on minimizing observer biases.
Although many of the identified sources of inaccuracy may not individually affect a reading of BP enough to alter a clinical decision, the cumulative effect of multiple patient, procedure, device and/or observer factors could have a substantial impact – as could some of the more influential sources of inaccuracy in isolation. To make sound interpretations of BP measurements, clinicians should recognize the extent of variability that can exist between any two measurements. The values in Table 2 act as a reminder that any single BP measurement includes the potential for substantial inaccuracy and should not be treated as a meaningful clinical indicator on its own.
Furthermore, by considering which sources of inaccuracy may be introduced at each stage in the process of measuring BP, clinicians may be better placed to recognize and mitigate their effects. To this end, Table 3 presents all of the empirically evaluated potential sources of inaccuracy rearranged into six sequential categories and indicates the direction of all reported significant effects on SBP and DBP. On average, potential sources of inaccuracy to which the plus sign has been assigned will tend to increase measurements of SBP or DBP (as the case may be), and sources to which the minus sign has been assigned will tend to result in a decrease. These monodirectional sources of inaccuracy include most of the more transitory patient-related factors (i.e. acute meal ingestion, acute caffeine use, acute nicotine use or exposure, bladder distension and cold exposure), the influence of which can only be eliminated by repeating the measurement once the relevant factor is no longer current. For the other sources with monodirectional effects on SBP and/or DBP (such as legs crossed at knees and unsupported arm), repeated measurements cannot eliminate their influence, irrespective of the interval between measurements (with the obvious exceptions of insufficient rest period and reliance on a single measurement). Hence, it is important that procedures are in place to address these factors.
TABLE 3.
Empirically-evaluated potential sources of inaccuracy that may be introduced at each stage in the process of measuring an adult's resting blood pressure, and the reported direction of significant effects (note that numbers in parentheses correspond to the numbering of potential sources of inaccuracy in the ‘RESULTS’ section, Table 2 and the Supplementary Tables)
| Stage in the process of blood pressure measurement | Potential sources of inaccuracy introduced | Direction of significant effects | |
| SBP | DBP | ||
| Before measurement | Acute meal ingestion (1) | − | − |
| Acute alcohol use (2) | ± | ± | |
| Acute caffeine use (3) | + | + | |
| Acute nicotine use or exposure (4) | + | + | |
| Bladder distension (5) | + | + | |
| Cold exposure (6) | + | + | |
| Insufficient rest period (11) | + | + | |
| Selecting the device | Device model biasa (9) | ± | ± |
| Device calibration error (10) | ± | ± | |
| Positioning the patient | Standing body position (vs. sitting) (12) | ± | + |
| Supine body position (vs. sitting) (12) | ± | ± | |
| Legs crossed at knees (13) | + | + | |
| Unsupported back (14) | ns | + | |
| Unsupported arm (15) | + | + | |
| Arm lower than heart level (16) | + | + | |
| Attaching the device to the patient | Paretic arm (7) | + | + |
| Smaller cuff (vs. correct size) (17) | + | + | |
| Larger cuff (vs. correct size) (17) | − | − | |
| Cuff placed over clothing (18) | ns | ns | |
| Stethoscope under cuff (19) | + | − | |
| Taking the measurement | White-coat effect (8) | ± | ± |
| Talking during measurement (20) | + | + | |
| Use of stethoscope bell (vs. diaphragm) (21) | ± | − | |
| Excessive pressure on stethoscope head (22) | ns | − | |
| Fast cuff deflation rate (23) | − | + | |
| Observer hearing deficit (27) | − | + | |
| Korotkoff phase IV (vs. V) for DBP (28) | N/A | + | |
| Short interval between measurements (24) | ns | ns | |
| Interpreting the measurement | Reliance on a single measurement (25) | + | ± |
| Interarm variabilityb (26) | ± | ± | |
| Terminal digit preference for zero (29) | ± | ± | |
Symbols indicate whether significant increases (+), significant decreases (−) or both (±) were reported. Sources for which all reported directional effects were nonsignificant are marked ns.
aDirection depends on the device type and model (Table 2 and Supplementary Tables 9A–9E).
bDirection depends on which arm was selected for measurement (individuals differ in which arm will yield the higher values).
Plus-or-minus signs have been used to indicate bidirectional results. In the case of device model bias, this is because the direction of the effect depends on the specific device type and model being used. However, for any given device, it is also important to consider variation from measurement-to-measurement (as indicated by the width of the 95% limits of agreement), the influence of which can be reduced by taking multiple measurements. For the other potential sources of inaccuracy, there are three general possibilities. First, some are inherently bidirectional (e.g. device calibration error can add a constant error in either direction, and terminal digit preference for zero can result in rounding up or rounding down). Second, for some potential sources of inaccuracy, the direction of the effect may be moderated by another factor (e.g. the directional effect of interarm variability depends on which arm has been selected for measurement, the effect of acute alcohol use may depend on the time elapsed since ingestion, and the white-coat effect may vary according to factors such as age and race). Third, for the remaining factors with bidirectional effects in relation to SBP and/or DBP (i.e. standing body position, supine body position, use of stethoscope bell and reliance on a single measurement), there is limited and somewhat conflicting evidence, as outlined in the ‘RESULTS’ section.
Although this review fulfilled the goal of identifying and listing empirically evaluated sources of inaccuracy in the measurement of BP, the breadth of the topic limited the level of detail with which each source of inaccuracy could be investigated. Future reviews should therefore focus on specific individual sources of inaccuracy and their causes. Further, sources of inaccuracy that have been investigated by few high quality empirical studies (such as bladder distension, unsupported back and fast cuff deflation rate) require stronger empirical evidence and should be prioritized in future research on BP measurement. In addition, the focus on studies relevant to upper arm BP measurement in clinical settings meant that we did not evaluate studies that were specific to home and ambulatory BP measurement, or measurement at locations other than the upper arm. Nevertheless, many of the reported sources of inaccuracy would also be relevant to these contexts.
Recommendations
As demonstrated by these studies, the accuracy of BP measurement can be affected by many factors. A single BP value outside the expected range should therefore be interpreted with caution and should not be seen as a definitive indicator of clinical deterioration or lead to an alteration in clinical care without the support of other evidence. Where a BP measurement indicates an abnormally high or low level, further measurements should therefore be taken and the average used (instead of the original reading) before deciding on appropriate clinical interventions.
Wherever possible, BP values should be recorded graphically within ranges, rather than numerically; or else an agreed-upon standardized rounding method should be adopted. This may reduce the impact of some sources of inaccuracy. For example, given the substantial variability in the reported frequency of terminal digit preference, it could eliminate some of the variation between individual measurements recorded by different observers. Significantly, it would also reduce the scope for misinterpretation of small, likely erroneous or misleading, changes in BP values. In line with the recommended change to graphing or rounding, protocols using BP to guide clinical interventions need to be reviewed.
ACKNOWLEDGEMENTS
The University of Queensland received research consultancy fees from the Clinical Skills Development Service, Metro North Hospital and Health Service for some of N.K. and M.S.H.'s work.
Conflicts of interest
M.O.W. has two relevant patents issued (method and means of physiological monitoring and method and means of blood pressure monitoring), but none of the articles cited in this review relate directly to these patents. For the remaining authors, none were declared.
Supplementary Material
Footnotes
Abbreviations: BP, blood pressure; DBP, diastolic blood pressure; SBP, systolic blood pressure
REFERENCES
- 1.Jones D, Drennan K, Hart GK, Bellomo R, Web SAR. ANZICS-CORE MET Dose Investigators. Rapid Response Team composition, resourcing and calling criteria in Australia. Resuscitation 2012; 83:563–567. [DOI] [PubMed] [Google Scholar]
- 2.Hollenberg S, Ahrens T, Annane D, Astiz M, Chalfin D, Dasta J, et al. Practice parameters for hemodynamic support of sepsis in adult patients: 2004 update. Crit Care Med 2004; 32:1928–1948. [DOI] [PubMed] [Google Scholar]
- 3.Holley A, Lukin W, Paratz J, Hawkins T, Boots R, Lipman J. Review article: Part one: Goal-directed resuscitation – which goals? Haemodynamic targets. Emerg Med Australas 2012; 24:14–22. [DOI] [PubMed] [Google Scholar]
- 4.Pickering TG, Hall JE, Appel LJ, Falkner BE, Graves J, Hill MN, et al. Recommendations for blood pressure measurement in humans and experimental animals: Part 1: Blood pressure measurement in humans: a statement for professionals from the Subcommittee of Professional and Public Education of the American Heart Association Council on High Blood Pressure Research. Hypertension 2005; 45:142–161. [DOI] [PubMed] [Google Scholar]
- 5.Williams B, Poulter NR, Brown MJ, Davis M, McInnes GT, Potter JF, et al. Guidelines for management of hypertension: report of the fourth working party of the British Hypertension Society, 2004 – BHS IV. J Human Hypertens 2004; 18:139–185. [DOI] [PubMed] [Google Scholar]
- 6.National Heart Foundation of Australia. Guide to management of hypertension 2008. Melbourne, Victoria: National Heart Foundation of Australia; 2008. [Google Scholar]
- 7.Ray G, Nawarskas J, Anderson J. Blood pressure monitoring technique impacts hypertension treatment. J Gen Intern Med 2012; 27:623–629. [DOI] [PMC free article] [PubMed] [Google Scholar]
- 8.Campbell NRC, Conradson HE, Kang J, Brant R, Anderson T. Automated assessment of blood pressure using BpTRU compared with assessments by a trained technician and a clinic nurse. Blood Press Monit 2005; 10:257–262. [DOI] [PubMed] [Google Scholar]
- 9.Sebo P, Pechère-Bertschi A, Herrmann F, Haller D, Bovier P. Blood pressure measurements are unreliable to diagnose hypertension in primary care. J Hypertens 2014; 32:509–517. [DOI] [PubMed] [Google Scholar]
- 10.Handler J. Managing white-coat effect. J Clin Hypertens Greenwich Conn 2008; 10:649–654. [DOI] [PMC free article] [PubMed] [Google Scholar]
- 11.McAlister FA, Straus SE. Evidence based treatment of hypertension: measurement of blood pressure: an evidence based review. BMJ 2001; 322:908–911. [DOI] [PMC free article] [PubMed] [Google Scholar]
- 12.Baker RH, Ende J. Confounders of auscultatory blood pressure measurement. J Gen Intern Med 1995; 10:223–231. [DOI] [PubMed] [Google Scholar]
- 13.Reeves RA. Does this patient have hypertension? How to measure blood pressure. JAMA 1995; 273:1211–1218. [DOI] [PubMed] [Google Scholar]
- 14.Bailey RH, Bauer JH. A review of common errors in the indirect measurement of blood pressure: sphygmomanometry. Arch Intern Med 1993; 153:2741–2748. [PubMed] [Google Scholar]
- 15.Kmet LM, Lee RC, Cook LS. Standard quality assessment criteria for evaluating primary research papers from a variety of fields. Edmonton: Alberta Heritage Foundation for Medical Research; 2004. [Google Scholar]
- 16.Ahuja KD, Robertson IK, Ball MJ. Acute effects of food on postprandial blood pressure and measures of arterial stiffness in healthy humans. Am J Clin Nutr 2009; 90:298–303. doi:10.3945/ajcn.2009.27771. [DOI] [PubMed] [Google Scholar]
- 17.Taylor JL, Curry TB, Matzek LJ, Joyner MJ, Casey DP. Acute effects of a mixed meal on arterial stiffness and central hemodynamics in healthy adults. Am J Hypertens 2014; 27:331–337. [DOI] [PMC free article] [PubMed] [Google Scholar]
- 18.Barden A, Croft K, Beilin L, Phillips M, Ledowski T, Puddey I. Acute effects of red wine on cytochrome P450 eicosanoids and blood pressure in men. J Hypertens 2013; 31:2195–2202. [DOI] [PubMed] [Google Scholar]
- 19.Carter JR, Stream SF, Durocher JJ, Larson RA. Influence of acute alcohol ingestion on sympathetic neural responses to orthostatic stress in humans. Am J Physiol Endocrinol Metab 2011; 300:E771–E778. [DOI] [PMC free article] [PubMed] [Google Scholar]
- 20.Hering D, Kucharska W, Kara T, Somers V, Narkiewicz K. Potentiated sympathetic and hemodynamic responses to alcohol in hypertensive vs. normotensive individuals. J Hypertens 2011; 29:537–541. [DOI] [PubMed] [Google Scholar]
- 21.Mahmud A, Feely J. Divergent effect of acute and chronic alcohol on arterial stiffness. Am J Hypertens 2002; 15:240–243. [DOI] [PubMed] [Google Scholar]
- 22.Hashimoto M, Kim S, Eto M, Iijima K, Ako J, Yoshizumi M, et al. Effect of acute intake of red wine on flow-mediated vasodilatation of the brachial artery. Am J Cardiol 2001; 88:1457. [DOI] [PubMed] [Google Scholar]
- 23.Iwase S, Matsukawa T, Ishihara S, Tanaka A, Tanabe K, Danbara A, et al. Effect of oral ethanol intake on muscle sympathetic nerve activity and cardiovascular functions in humans. J Auton Nerv Syst 1995; 54:206–214. [DOI] [PubMed] [Google Scholar]
- 24.McDougle CJ, Krystal JH, Price LH, Heninger GR, Charney DS. Noradrenergic response to acute ethanol administration in healthy subjects: comparison with intravenous yohimbine. Psychopharmacology 1995; 118:127–135. [DOI] [PubMed] [Google Scholar]
- 25.Perkins KA, Sexton JE, DiMarco A, Grobe JE, Scierka A, Stiller RL. Subjective and cardiovascular responses to nicotine combined with alcohol in male and female smokers. Psychopharmacology 1995; 119:205–212. [DOI] [PubMed] [Google Scholar]
- 26.Kojima S, Kawano Y, Abe H, Sanai T, Yoshida K, Imanishi M, et al. Acute effects of alcohol ingestion on blood pressure and erythrocyte sodium concentration. J Hypertens 1993; 11:185–190. [DOI] [PubMed] [Google Scholar]
- 27.Kawano Y, Abe H, Kojima S, Ashida T, Yoshida K, Imanishi M, et al. Acute depressor effect of alcohol in patients with essential hypertension. Hypertension 1992; 20:219–226. [DOI] [PubMed] [Google Scholar]
- 28.Potter JF, Beevers DG. Factors determining the acute pressor response to alcohol. Clin Exp Hypertens 1991; 13:13–34. [DOI] [PubMed] [Google Scholar]
- 29.Grassi GM, Somers VK, Renk WS, Abboud FM, Mark AL. Effects of alcohol intake on blood pressure and sympathetic nerve activity in normotensive humans: a preliminary report. J Hypertens 1989; 7:S20–S21. [DOI] [PubMed] [Google Scholar]
- 30.Carretta R, Fabris B, Bardelli M, Muiesan S, Fischetti F, Cesanelli R, et al. Acute effects of intravenous infusions of alcohol on baroreceptor sensitivity in essential hypertension. Cardiovasc Res 1988; 22:226–230. [DOI] [PubMed] [Google Scholar]
- 31.Potter JF, Macdonald IA, Beevers DG. Alcohol raises blood pressure in hypertensive patients. J Hypertens 1986; 4:435–441. [DOI] [PubMed] [Google Scholar]
- 32.Reed TE, Hanna JM. Between- and within-race variation in acute cardiovascular responses to alcohol: evidence for genetic determination in normal males in three races. Behav Genet 1986; 16:585–598. [DOI] [PubMed] [Google Scholar]
- 33.Weise F, Krell D, Brinkhoff N. Acute alcohol ingestion reduces heart rate variability. Drug Alcohol Depend 1986; 17:89–91. [DOI] [PubMed] [Google Scholar]
- 34.Kupari M. Acute cardiovascular effects of ethanol A controlled noninvasive study. Br Heart J 1983; 49:174–182. [DOI] [PMC free article] [PubMed] [Google Scholar]
- 35.Delgado CE, Gortuin NJ, Ross RS. Acute effects of low doses of alcohol on left ventricular function by echocardiography. Circulation 1975; 51:535–540. [DOI] [PubMed] [Google Scholar]
- 36.Mesas AE, Leon-Muñoz LM, Rodriguez-Artalejo F, Lopez-Garcia E. The effect of coffee on blood pressure and cardiovascular disease in hypertensive individuals: a systematic review and meta-analysis. Am J Clin Nutr 2011; 94:1113–1126. [DOI] [PubMed] [Google Scholar]
- 37.Mort JR, Kruse HR. Timing of blood pressure measurement related to caffeine consumption. Ann Pharmacother 2008; 42:105–110. [DOI] [PubMed] [Google Scholar]
- 38.James JE. Critical review of dietary caffeine and blood pressure: a relationship that should be taken more seriously. Psychosom Med 2004; 66:63–71. [DOI] [PubMed] [Google Scholar]
- 39.Nurminen ML, Niittynen L, Korpela R, Vapaatalo H. Coffee, caffeine and blood pressure: a critical review. Eur J Clin Nutr 1999; 53:831–839. [DOI] [PubMed] [Google Scholar]
- 40.Grasser E, Yepuri G, Dulloo A, Montani J-P. Cardio- and cerebrovascular responses to the energy drink Red Bull in young adults: a randomized cross-over study. Eur J Nutr 2014; 53:1561–1571. [DOI] [PMC free article] [PubMed] [Google Scholar]
- 41.Buscemi S, Mattina A, Tranchina MR, Verga S. Acute effects of coffee on QT interval in healthy subjects. Nutr J 2011; 10:15–115. [DOI] [PMC free article] [PubMed] [Google Scholar]
- 42.McMullen MK, Whitehouse JM, Shine G, Towell A. Habitual coffee and tea drinkers experienced increases in blood pressure after consuming low to moderate doses of caffeine; these increases were larger upright than in the supine posture. Food Funct 2011; 2:197–203. [DOI] [PubMed] [Google Scholar]
- 43.Buscemi S, Verga S, Batsis JA, Donatelli M, Tranchina MR, Belmonte S, et al. Acute effects of coffee on endothelial function in healthy subjects. Eur J Clin Nutr 2010; 64:483–489. [DOI] [PubMed] [Google Scholar]
- 44.Arciero PJ, Ormsbee MJ. Relationship of blood pressure, behavioral mood state, and physical activity following caffeine ingestion in younger and older women. Appl Physiol Nutr Metab Physiol 2009; 34:754–762. [DOI] [PubMed] [Google Scholar]
- 45.Ozkan B, Yüksel N, Anik Y, Altintas O, Demirci A, Cağlar Y. The effect of caffeine on retrobulbar hemodynamics. Curr Eye Res 2008; 33:804–809. [DOI] [PubMed] [Google Scholar]
- 46.Hodgson JM, Burke V, Puddey IB. Acute effects of tea on fasting and postprandial vascular function and blood pressure in humans. J Hypertens 2005; 23:47–54. [DOI] [PubMed] [Google Scholar]
- 47.Karatzis E, Papaioannou TG, Aznaouridis K, Karatzi K, Stamatelopoulos K, Zampelas A, et al. Acute effects of caffeine on blood pressure and wave reflections in healthy subjects: should we consider monitoring central blood pressure? Int J Cardiol 2005; 98:425–430. [DOI] [PubMed] [Google Scholar]
- 48.Vlachopoulos C, Hirata K, Stefanadis C, Toutouzas P, O’Rourke M. OR-12: caffeine increases aortic stiffness in hypertensive patients. Am J Hypertens 2002; 15:5A–6A. [DOI] [PubMed] [Google Scholar]
- 49.Watson J, Deary I, Kerr D. Central and peripheral effects of sustained caffeine use: tolerance is incomplete. Br J Clin Pharmacol 2002; 54:400–406. [DOI] [PMC free article] [PubMed] [Google Scholar]
- 50.Mahmud A, Feely J. Acute effect of caffeine on arterial stiffness and aortic pressure waveform. Hypertension 2001; 38:227–231. [DOI] [PubMed] [Google Scholar]
- 51.Shepard JD, al’Absi M, Whitsett TL, Passey RB, Lovallo WR. Additive pressor effects of caffeine and stress in male medical students at risk for hypertension. Am J Hypertens 2000; 13:475–481. [DOI] [PubMed] [Google Scholar]
- 52.Hodgson J, Puddey I, Burke V, Beilin L, Jordan N. Effects on blood pressure of drinking green and black tea. J Hypertens 1999; 17:457–463. [DOI] [PubMed] [Google Scholar]
- 53.Bender AM, Donnerstein RL, Samson RA, Zhu D, Goldberg SJ. Hemodynamic effects of acute caffeine ingestion in young adults. Am J Cardiol 1997; 79:696–699. [DOI] [PubMed] [Google Scholar]
- 54.Lovallo WR, alʼAbsi M, McKey BS, Pincomb GA, Everson SA, Sung BH, et al. Caffeine and behavioral stress effects on blood pressure in borderline hypertensive Caucasian men. Health Psychol 1996; 15:11–17. [DOI] [PubMed] [Google Scholar]
- 55.Pincomb GA, Lovallo WR, McKey BS, Sung BH, Passey RB, Everson SA, et al. Acute blood pressure elevations with caffeine in men with borderline systemic hypertension. Am J Cardiol 1996; 77:270–274. [DOI] [PubMed] [Google Scholar]
- 56.Hasenfratz M, Bättig K. Acute dose-effect relationships of caffeine and mental performance, EEG, cardiovascular and subjective parameters. Psychopharmacology 1994; 114:281–287. [DOI] [PubMed] [Google Scholar]
- 57.Sung BH, Whitsett TL, Lovallo WR, al’Absi M, Pincomb GA, Wilson MF. Prolonged increase in blood pressure by a single oral dose of caffeine in mildly hypertensive men. Am J Hypertens 1994; 7:755–758. [DOI] [PubMed] [Google Scholar]
- 58.Haigh RA, Harper GD, Fotherby M, Hurd J, Macdonald IA, Potter JF. Duration of caffeine abstention influences the acute blood pressure responses to caffeine in elderly normotensives. Eur J Clin Pharmacol 1993; 44:549–553. [DOI] [PubMed] [Google Scholar]
- 59.Casiglia E, Bongiovì S, Paleari CD, Petucco S, Boni M, Colangeli G, et al. Haemodynamic effects of coffee and caffeine in normal volunteers: a placebo-controlled clinical study. J Intern Med 1991; 229:501–504. [DOI] [PubMed] [Google Scholar]
- 60.Pincomb GA, Wilson MF, Sung BH, Passey RB, Lovallo WR. Effects of caffeine on pressor regulation during rest and exercise in men at risk for hypertension. Am Heart J 1991; 122:1107–1115. [DOI] [PubMed] [Google Scholar]
- 61.Astrup A, Toubro S, Cannon S, Hein P, Breum L, Madsen J. Caffeine: a double-blind, placebo-controlled study of its thermogenic, metabolic, and cardiovascular effects in healthy volunteers. Am J Clin Nutr 1990; 51:759–767. [DOI] [PubMed] [Google Scholar]
- 62.Lane JD, Adcock RA, Williams RB, Kuhn CM. Caffeine effects on cardiovascular and neuroendocrine responses to acute psychosocial stress and their relationship to level of habitual caffeine consumption. Psychosom Med 1990; 52:320–336. [DOI] [PubMed] [Google Scholar]
- 63.Nussberger J, Mooser V, Maridor G, Juillerat L, Waeber B, Brunner HR. Caffeine-induced diuresis and atrial natriuretic peptides. J Cardiovasc Pharmacol 1990; 15:685–691. [DOI] [PubMed] [Google Scholar]
- 64.Lovallo WR, Pincomb GA, Sung BH, Passey RB, Sausen KP, Wilson MF. Caffeine may potentiate adrenocortical stress responses in hypertension-prone men. Hypertension 1989; 14:170–176. [DOI] [PubMed] [Google Scholar]
- 65.Pincomb GA, Lovallo WR, Passey RB, Wilson MF. Effect of behavior state on caffeine's ability to alter blood pressure. Am J Cardiol 1988; 61:798–802. [DOI] [PubMed] [Google Scholar]
- 66.Prakash R, Kaushik VS. Acute effect of decaffeinated coffee on heart rate, blood pressure, and exercise performance in healthy subjects. J Natl Med Assoc 1988; 80:71–74. [PMC free article] [PubMed] [Google Scholar]
- 67.Lane JD, Williams RB. Cardiovascular effects of caffeine and stress in regular coffee drinkers. Psychophysiology 1987; 24:157–164. [DOI] [PubMed] [Google Scholar]
- 68.Myers MG, Harris L, Leenen FH, Grant DM. Caffeine as a possible cause of ventricular arrhythmias during the healing phase of acute myocardial infarction. Am J Cardiol 1987; 59:1024–1028. [DOI] [PubMed] [Google Scholar]
- 69.Passmore AP, Kondowe GB, Johnston GD. Renal and cardiovascular effects of caffeine: a dose-response study. Clin Sci (Lond) 1987; 72:749. [DOI] [PubMed] [Google Scholar]
- 70.Ray RL, Nellis MJ, Brady JV, Foltin RW. Nicotine and caffeine effects on the task-elicited blood pressure response. Addict Behav 1986; 11:31–36. [DOI] [PubMed] [Google Scholar]
- 71.Lane JD, Williams RB. Caffeine affects cardiovascular responses to stress. Psychophysiology 1985; 22:648–655. [DOI] [PubMed] [Google Scholar]
- 72.Piters KM, Colombo A, Olson HG, Butman SM. Effect of coffee on exercise-induced angina pectoris due to coronary artery disease in habitual coffee drinkers. Am J Cardiol 1985; 55:277–280. [DOI] [PubMed] [Google Scholar]
- 73.Lane JD. Caffeine and cardiovascular responses to stress. Psychosom Med 1983; 45:447. [DOI] [PubMed] [Google Scholar]
- 74.Robertson D, Frolich JC, Carr RK, Watson JT, Hollifield JW, Shand DG, et al. Effects of caffeine on plasma renin activity, catecholamines and blood pressure. Surv Anesthesiol 1978; 22:548–549. [DOI] [PubMed] [Google Scholar]
- 75.Farsalinos KE, Tsiapras D, Kyrzopoulos S, Savvopoulou M, Voudris V. Acute effects of using an electronic nicotine-delivery device (electronic cigarette) on myocardial function: comparison with the effects of regular cigarettes. BMC Cardiovasc Disord 2014; 14:78–178. [DOI] [PMC free article] [PubMed] [Google Scholar]
- 76.Seet RCS, Loke WM, Khoo CM, Chew SE, Chong WL, Quek AML, et al. Acute effects of cigarette smoking on insulin resistance and arterial stiffness in young adults. Atherosclerosis 2012; 224:195–200. [DOI] [PubMed] [Google Scholar]
- 77.Shaikh RB, Abdul Haque NM, Abdul Hadi Khalil Al Mohsen H, Abdul Hadi Khalil Al Mohsen A, Haitham Khalaf Humadi M, Zaki Al Mubarak Z, et al. Acute effects of dokha smoking on the cardiovascular and respiratory systems among UAE male university students. Asian Pac J Cancer Prev 2012; 13:1819–1822. [DOI] [PubMed] [Google Scholar]
- 78.Kubozono T, Miyata M, Ueyama K, Hamasaki S, Kusano K, Kubozono O, et al. Acute and chronic effects of smoking on arterial stiffness. Circ J 2011; 75:698–702. [DOI] [PubMed] [Google Scholar]
- 79.Kasikcioglu E, Elitok A, Onur I, Cimen A, Ucar A, Oflaz H. Acute effects of smoking on coronary flow velocity reserve and ventricular diastolic functions. Int J Cardiol 2008; 129:e18–e20. [DOI] [PubMed] [Google Scholar]
- 80.Rhee M-Y, Na S-H, Kim Y-K, Lee M-M, Kim H-Y. Acute effects of cigarette smoking on arterial stiffness and blood pressure in male smokers with hypertension. Am J Hypertens 2007; 20:637–641. [DOI] [PubMed] [Google Scholar]
- 81.Zamir Z, Mahmud A, Feely J. Acute haemodynamic effects of cigarette smoking in healthy young subjects. Ir J Med Sci 2006; 175:20–23. [DOI] [PubMed] [Google Scholar]
- 82.Najem B, Houssière A, Pathak A, Janssen C, Lemogoum D, Xhaët O, et al. Acute cardiovascular and sympathetic effects of nicotine replacement therapy. Hypertension 2006; 47:1162–1167. [DOI] [PubMed] [Google Scholar]
- 83.Vanderkaay MM, Patterson SM. Nicotine and acute stress: effects of nicotine versus nicotine withdrawal on stress-induced hemoconcentration and cardiovascular reactivity. Biol Psychol 2006; 71:191–201. [DOI] [PubMed] [Google Scholar]
- 84.Wolk R, Shamsuzzaman ASM, Svatikova A, Huyber CM, Huck C, Narkiewicz K, et al. Hemodynamic and autonomic effects of smokeless tobacco in healthy young men. J Am Coll Cardiol 2005; 45:910–914. [DOI] [PubMed] [Google Scholar]
- 85.Vlachopoulos C, Alexopoulos N, Panagiotakos D, O’Rourke MF, Stefanadis C. Cigar smoking has an acute detrimental effect on arterial stiffness. Am J Hypertens 2004; 17:299–303. [DOI] [PubMed] [Google Scholar]
- 86.Ijzerman RG, Serne EH, van Weissenbruch MM, de Jongh RT, Stehouwer CDA. Cigarette smoking is associated with an acute impairment of microvascular function in humans. Clin Sci (Lond) 2003; 104:247–252. [DOI] [PubMed] [Google Scholar]
- 87.Mahmud A, Feely J. Effect of smoking on arterial stiffness and pulse pressure amplification. Hypertension 2003; 41:183–187. [DOI] [PubMed] [Google Scholar]
- 88.Malson JL, Pickworth WB. Bidis – hand-rolled, Indian cigarettes: effects on physiological, biochemical and subjective measures. Pharmacol Biochem Behav 2002; 72:443–447. [DOI] [PubMed] [Google Scholar]
- 89.Halimi JM, Mimran A. Systemic and renal effect of nicotine in nonsmokers: influence of vitamin C. J Hypertens 2000; 18:1665–1669. [DOI] [PubMed] [Google Scholar]
- 90.Freestone S, Yeo WW, Ramsay LE. Effect of coffee and cigarette smoking on the blood pressure of patients with accelerated (malignant) hypertension. J Hum Hypertens 1995; 9:89. [PubMed] [Google Scholar]
- 91.Efstratopoulos AD, Voyaki SM. Effect of antioxidants on acute blood pressure response to smoking in normotensives and hypertensives. J Hypertens 1993; 11:S112–S113. [PubMed] [Google Scholar]
- 92.Kool MJ, Hoeks AP, Struijker Boudier HA, Reneman RS, Van Bortel LM. Short- and long-term effects of smoking on arterial wall properties in habitual smokers. J Am Coll Cardiol 1993; 22:1881–1886. [DOI] [PubMed] [Google Scholar]
- 93.Brunel P, Girerd X, Laurent S, Pannier B, Safar M. Acute changes in forearm haemodynamics produced by cigarette smoking in healthy normotensive nonsmokers are not influenced by propranolol or pindolol. Eur J Clin Pharmacol 1992; 42:143–146. [DOI] [PubMed] [Google Scholar]
- 94.Groppelli A, Giorgi D, Omboni S, Parati G, Mancia G. Persistent blood pressure increase induced by heavy smoking. J Hypertens 1992; 10:495–499. [DOI] [PubMed] [Google Scholar]
- 95.Kyriakides ZS, Kremastinos DT, Rentoukas E, Mavrogheni S, Kremastinos DI, Toutouzas P. Acute effects of cigarette smoking on left ventricular diastolic function. Eur Heart J 1992; 13:743–748. [DOI] [PubMed] [Google Scholar]
- 96.Benowitz NL, Kuyt F, Jacob P., 3rd Influence of nicotine on cardiovascular and hormonal effects of cigarette smoking. Clin Pharmacol Ther 1984; 36:74. [DOI] [PubMed] [Google Scholar]
- 97.Pijpers L, Wladimiroff JW, McGhie JS, Bom N. Acute effect of maternal smoking on the maternal and fetal cardiovascular system. Early Hum Dev 1984; 10:95–105. [DOI] [PubMed] [Google Scholar]
- 98.Rabinowitz BD, Thorp K, Huber GL, Abelmann WH. Acute hemodynamic effects of cigarette smoking in man assessed by systolic time intervals and echocardiography. Circulation 1979; 60:752–760. [DOI] [PubMed] [Google Scholar]
- 99.Diamond L, Lipscomb W, Johnson R. Acute pulmonary effects of smoking a reference cigarette. Toxicol Appl Pharmacol 1971; 18:638–648. [DOI] [PubMed] [Google Scholar]
- 100.Yarlioglues M, Kaya M, Ardic I, Calapkorur B, Dogdu O, Akpek M, et al. Acute effects of passive smoking on blood pressure and heart rate in healthy females. Blood Press Monit 2010; 15:251–256. [DOI] [PubMed] [Google Scholar]
- 101.Argacha J-F, Adamopoulos D, Gujic M, Fontaine D, Amyai N, Berkenboom G, et al. Acute effects of passive smoking on peripheral vascular function. Hypertension 2008; 51:1506–1511. [DOI] [PubMed] [Google Scholar]
- 102.Flouris AD, Metsios GS, Jamurtas AZ, Koutedakis Y. Sexual dimorphism in the acute effects of secondhand smoke on thyroid hormone secretion, inflammatory markers and vascular function. Am J Physiol Endocrinol Metab 2008; 294:E456–E462. [DOI] [PubMed] [Google Scholar]
- 103.Mahmud A, Feely J. Effects of passive smoking on blood pressure and aortic pressure waveform in healthy young adults – influence of gender. Br J Clin Pharmacol 2004; 57:37–43. [DOI] [PMC free article] [PubMed] [Google Scholar]
- 104.Choi EJ, Jeong DW, Lee JG, Lee S, Kim YJ, Yi YH, et al. The impact of bladder distension on blood pressure in middle aged women. Korean J Fam Med 2011; 32:306–310. [DOI] [PMC free article] [PubMed] [Google Scholar]
- 105.Fagius J, Karhuvaara S. Sympathetic activity and blood pressure increases with bladder distension in humans. Hypertension 1989; 14:511–517. [DOI] [PubMed] [Google Scholar]
- 106.Scultéty S, Varga B, Szabó D. Effect of bladder distension on blood pressure. Int Urol Nephrol 1971; 3:11–19. [DOI] [PubMed] [Google Scholar]
- 107.Greaney JL, Stanhewicz AE, Kenney WL, Alexander LM. Muscle sympathetic nerve activity during cold stress and isometric exercise in healthy older adults. J Appl Physiol 2014; 117:648–657. [DOI] [PMC free article] [PubMed] [Google Scholar]
- 108.Hintsala H, Kandelberg A, Herzig K-H, Rintamäki H, Mäntysaari M, Rantala A, et al. Central aortic blood pressure of hypertensive men during short-term cold exposure. Am J Hypertens 2014; 27:656–664. [DOI] [PubMed] [Google Scholar]
- 109.Koutnik AP, Figueroa A, Wong A, Ramirez KJ, Ormsbee MJ, Sanchez-Gonzalez MA. Impact of acute whole-body cold exposure with concurrent isometric handgrip exercise on aortic pressure waveform characteristics. Eur J Appl Physiol 2014; 114:1779–1787. [DOI] [PubMed] [Google Scholar]
- 110.Zhang X, Zhang S, Wang C, Wang B, Guo P. Effects of moderate strength cold air exposure on blood pressure and biochemical indicators among cardiovascular and cerebrovascular patients. Int J Environ Res Public Health 2014; 11:2472–2487. [DOI] [PMC free article] [PubMed] [Google Scholar]
- 111.Korhonen I. Blood pressure and heart rate responses in men exposed to arm and leg cold pressor tests and whole-body cold exposure. Int J Circumpolar Health 2006; 65:178–184. [DOI] [PubMed] [Google Scholar]
- 112.Komulainen S, Rintamäki H, Virokannas H, Keinänen-Kiukaanniemi S. Blood pressure responses to whole-body cold exposure: effect of metoprolol. J Hum Hypertens 2004; 18:905–906. [DOI] [PubMed] [Google Scholar]
- 113.Komulainen S, Tähtinen T, Rintamäki H, Virokannas H, Keinänen-Kiukaanniemi S. Blood pressure responses to whole-body cold exposure: effect of carvedilol. Eur J Clin Pharmacol 2000; 56:637–642. [DOI] [PubMed] [Google Scholar]
- 114.Kawahara J, Sano H, Fukuzaki H, Saito K, Hirouchi H. Acute effects of exposure to cold on blood pressure, platelet function and sympathetic nervous activity in humans. Am J Hypertens 1989; 2:724–726. [DOI] [PubMed] [Google Scholar]
- 115.Scriven AJ, Brown MJ, Murphy MB, Dollery CT. Changes in blood pressure and plasma catecholamines caused by tyramine and cold exposure. J Cardiovasc Pharmacol 1984; 6:954–960. [DOI] [PubMed] [Google Scholar]
- 116.Dewar R, Sykes D, Mulkerrin E, Nicklason F, Thomas D, Seymour R. The effect of hemiplegia on blood pressure measurement in the elderly. Postgrad Med J 1992; 68:888–891. [DOI] [PMC free article] [PubMed] [Google Scholar]
- 117.Yagi S, Ichikawa S, Sakamaki T, Takayama Y, Murata K. Blood pressure in the paretic arms of patients with stroke. N Engl J Med 1986; 315:836–1836. [DOI] [PubMed] [Google Scholar]
- 118.Ishikawa J, Ishikawa Y, Edmondson D, Pickering TG, Schwartz JE. Age and the difference between awake ambulatory blood pressure and office blood pressure: a meta-analysis. Blood Press Monit 2011; 16:159–167. [DOI] [PMC free article] [PubMed] [Google Scholar]
- 119.Agyemang C, Bhopal R, Bruijnzeels M, Redekop WK. Does the white-coat effect in people of African and South Asian descent differ from that in White people of European origin? A systematic review and meta-analysis. Blood Press Monit 2005; 10:243–248. [DOI] [PubMed] [Google Scholar]
- 120.Schmieder RE, Schmidt ST, Riemer T, Dechend R, Hagedorn I, Senges J, et al. Disproportional decrease in office blood pressure compared with 24-h ambulatory blood pressure with antihypertensive treatment: dependency on pretreatment blood pressure levels. Hypertension 2014; 64:1067–1072. [DOI] [PubMed] [Google Scholar]
- 121.Agarwal R, Weir MR. Treated hypertension and the white coat phenomenon: office readings are inadequate measures of efficacy. J Am Soc Hypertens JASH 2013; 7:236–243. [DOI] [PubMed] [Google Scholar]
- 122.Saladini F, Benetti E, Malipiero G, Casiglia E, Palatini P. Does home blood pressure allow for a better assessment of the white-coat effect than ambulatory blood pressure? J Hypertens 2012; 30:2118–2124. [DOI] [PubMed] [Google Scholar]
- 123.Yoon HJ, Ahn Y, Kim KH, Park JC, Park JB, Park CG, et al. Can pulse pressure predict the white-coat effect in treated hypertensive patients? Clin Exp Hypertens 2012; 34:555–560. [DOI] [PubMed] [Google Scholar]
- 124.O'Shaughnessy MM, Newman CA, Kinsella SM, Reddan DN, Lappin DW. In-office assessment of blood pressure in chronic kidney disease: usual measurement versus automated BpTRU measurement. Blood Press Monit 2011; 16:124–128. [DOI] [PubMed] [Google Scholar]
- 125.Sabater-Hernández D, de la Sierra A, Sánchez-Villegas P, Baena MI, Amariles P, Faus MJ. Magnitude of the white-coat effect in the community pharmacy setting: the MEPAFAR study. Am J Hypertens 2011; 24:887–892. [DOI] [PubMed] [Google Scholar]
- 126.Scherpbier-de Haan N, van der Wel M, Schoenmakers G, Boudewijns S, Peer P, van Weel C, et al. Thirty-minute compared to standardised office blood pressure measurement in general practice. Br J Gen Pract 2011; 61:e590–e597. [DOI] [PMC free article] [PubMed] [Google Scholar]
- 127.Sendra-Lillo J, Sabater-Hernández D, Sendra-Ortolá A, Martínez-Martínez F. Comparison of the white-coat effect in community pharmacy versus the physician's office: the Palmera study. Blood Press Monit 2011; 16:62–66. [DOI] [PubMed] [Google Scholar]
- 128.Pierdomenico SD, Pannarale G, Rabbia F, Lapenna D, Licitra R, Zito M, et al. Prognostic relevance of masked hypertension in subjects with prehypertension. Am J Hypertens 2008; 21:879–883. [DOI] [PubMed] [Google Scholar]
- 129.Blanco F, Gil P, Arco C del, Sáez T, Aguilar R, Lara I, et al. Association of clinic and ambulatory blood pressure with vascular damage in the elderly: the EPICARDIAN study. Blood Press Monit 2006; 11:329–335. [DOI] [PubMed] [Google Scholar]
- 130.Gerin W, Ogedegbe G, Schwartz JE, Chaplin WF, Goyal T, Clemow L, et al. Assessment of the white-coat effect. J Hypertens 2006; 24:67–74. [DOI] [PubMed] [Google Scholar]
- 131.Niiranen TJ, Jula AM, Kantola IM, Reunanen A. Comparison of agreement between clinic and home-measured blood pressure in the Finnish population: the Finn-HOME Study. J Hypertens 2006; 24:1549–1555. [DOI] [PubMed] [Google Scholar]
- 132.Botomino A, Martina B, Ruf D, Bruppacher R, Hersberger KE. White coat effect and white coat hypertension in community pharmacy practice. Blood Press Monit 2005; 10:13–18. [DOI] [PubMed] [Google Scholar]
- 133.Goldstein IB, Ancoli-Israel S, Shapiro D. Relationship between daytime sleepiness and blood pressure in healthy older adults. Am J Hypertens 2004; 17:787–792. [DOI] [PubMed] [Google Scholar]
- 134.Stergiou GS, Efstathiou SP, Argyraki CK, Roussias LG, Mountokalakis TD. White coat effect in treated versus untreated hypertensive individuals: a case-control study using ambulatory and home blood pressure monitoring. Am J Hypertens 2004; 17:124–128. [DOI] [PubMed] [Google Scholar]
- 135.Tachibana R, Tabara Y, Kondo I, Miki T, Kohara K. Home blood pressure is a better predictor of carotid atherosclerosis than office blood pressure in community-dwelling subjects. Hypertens Res 2004; 27:633–639. [DOI] [PubMed] [Google Scholar]
- 136.Tsai P-S. Determinants of the white-coat effect in normotensives and never-treated mild hypertensives. Clin Exp Hypertens 2003; 25:443–454. [DOI] [PubMed] [Google Scholar]
- 137.Jumabay M, Ozawa Y, Kawamura H, Saito S, Izumi Y, Mitsubayashi H, et al. Ambulatory blood pressure monitoring in uygur centenarians. Circ J 2002; 66:75–79. [DOI] [PubMed] [Google Scholar]
- 138.Matsuoka S, Kawamura K, Honda M, Awazu M. White coat effect and white coat hypertension in pediatric patients. Pediatr Nephrol Berl Ger 2002; 17:950–953. [DOI] [PubMed] [Google Scholar]
- 139.Munakata M, Saito Y, Nunokawa T, Ito N, Fukudo S, Yoshinaga K. Clinical significance of blood pressure response triggered by a doctor's visit in patients with essential hypertension. Hypertens Res 2002; 25:343–349. [DOI] [PubMed] [Google Scholar]
- 140.Silveira A, Mesquita A, Maldonado J, Silva JA, Polónia J. White coat effect in treated and untreated patients with high office blood pressure. Relationship with pulse wave velocity and left ventricular mass index. Port J Cardiol 2002; 21:517–530. [PubMed] [Google Scholar]
- 141.Steffen PR, Hinderliter AL, Blumenthal JA, Sherwood A. Religious coping, ethnicity, and ambulatory blood pressure. Psychosom Med 2001; 63:523–530. [DOI] [PubMed] [Google Scholar]
- 142.Björklund K, Lind L, Lithell H. Twenty-four hour ambulatory blood pressure in a population of elderly men. J Intern Med 2000; 248:501–510. [DOI] [PubMed] [Google Scholar]
- 143.Guzzetti S, Mayet J, Shahi M, Mezzetti S, Foale RA, Sever PS, et al. Absence of sympathetic overactivity in Afro-Caribbean hypertensive subjects studied by heart rate variability. J Hum Hypertens 2000; 14:337–342. [DOI] [PubMed] [Google Scholar]
- 144.Khattar R, Swales J, Senior R, Lahiri A. Racial variation in cardiovascular morbidity and mortality in essential hypertension. Heart 2000; 83:267–271. [DOI] [PMC free article] [PubMed] [Google Scholar]
- 145.Kuznetsova T, Malyutina S, Pello E, Thijs L, Nikitin Y, Staessen JA. Ambulatory blood pressure of adults in Novosibirsk, Russia: interim report on a population study. Blood Press Monit 2000; 5:291–296. [DOI] [PubMed] [Google Scholar]
- 146.Schettini C, Bianchi M, Nieto F, Sandoya E, Senra H. Group THW. Ambulatory blood pressure: normality and comparison with other measurements. Hypertension 1999; 34:818–825. [DOI] [PubMed] [Google Scholar]
- 147.Stergiou GS, Thomopoulou GC, Skeva II, Mountokalakis TD. Home blood pressure normalcy: The Didima study. Am J Hypertens 2000; 13:678–685. [DOI] [PubMed] [Google Scholar]
- 148.Lambrechtsen J, Rasmussen F, Hansen HS, Jacobsen HS. Ambulatory blood pressure in 570 Danes aged 19–21 years: the Odense Schoolchild Study. J Human Hypertens 1998; 12:755–760. [DOI] [PubMed] [Google Scholar]
- 149.Mayet J, Chapman N, Li CK-C, Shahi M, Poulter NR, Sever PS, et al. Ethnic differences in the hypertensive heart and 24-hour blood pressure profile. Hypertension 1998; 31:1190–1194. [DOI] [PubMed] [Google Scholar]
- 150.Chase HP, Garg SK, Icaza G, Carmain JA, Walravens CF, Marshall G. 24-h Ambulatory blood pressure monitoring in healthy young adult Anglo, Hispanic, and African-American subjects. Am J Hypertens 1997; 10:18–23. [DOI] [PubMed] [Google Scholar]
- 151.Sega R, Cesana G, Milesi C, Grassi G, Zanchetti A, Mancia G. Ambulatory and home blood pressure normality in the elderly: data from the Pamela population. Hypertension 1997; 30:1–6. [DOI] [PubMed] [Google Scholar]
- 152.Acharya DU, Heber ME, Doré CJ, Raftery EB. Ambulatory intraarterial blood pressure in essential hypertension effects of age, sex, race, and body mass – the Northwick Park Hospital Database Study. Am J Hypertens 1996; 9:943–952. [DOI] [PubMed] [Google Scholar]
- 153.Nyström F, Malmström O, Karlberg BE, Öhman KP. Twenty-four hour ambulatory blood pressure in the population. J Intern Med 1996; 240:279–284. [DOI] [PubMed] [Google Scholar]
- 154.Shapiro D, Goldstein IB, Jamner LD. Effects of cynical hostility, anger out, anxiety, and defensiveness on ambulatory blood pressure in black and white college students. Psychosom Med 1996; 58:354–364. [DOI] [PubMed] [Google Scholar]
- 155.Mancia G, Sega R, Bravi C, Vito GD, Valagussa F, Cesana G, et al. Ambulatory blood pressure normality: results from the PAMELA study. J Hypertens 1995; 13:1377–1390. [PubMed] [Google Scholar]
- 156.Verdecchia P, Schillaci G, Borgioni C, Ciucci A, Zampi I, Gattobigio R, et al. White coat hypertension and white coat effect. Similarities and differences. Am J Hypertens 1995; 8:790–798. [DOI] [PubMed] [Google Scholar]
- 157.Gretler DD, Fumo MT, Nelson KS, Murphy MB. Ethnic differences in circadian hemodynamic profile. Am J Hypertens 1994; 7:7–14. [DOI] [PubMed] [Google Scholar]
- 158.Pearce KA, Grimm RH, Jr, Rao S, Svendsen K, Liebson PR, Neaton JD, et al. Population-derived comparisons of ambulatory and office blood pressures: implications for the determination of usual blood pressure and the concept of white coat hypertension. Arch Intern Med 1992; 152:750–756. [PubMed] [Google Scholar]
- 159.Enstrom I, Thulin T, Lindholm L. How good are standardized blood pressure recordings for diagnosing hypertension? A comparison between office and ambulatory blood pressure. J Hypertens 1991; 9:561–566. [DOI] [PubMed] [Google Scholar]
- 160.Mancia G. Methods for assessing blood pressure values in humans. Hypertension 1983; 5:III5–III13. [DOI] [PubMed] [Google Scholar]
- 161.Mader SL. Effects of meals and time of day on postural blood pressure responses in young and elderly subjects. Arch Intern Med 1989; 149:2757–2760. [PubMed] [Google Scholar]
- 162.Araghi A, Bander JJ, Guzman JA. Arterial blood pressure monitoring in overweight critically ill patients: invasive or noninvasive? Crit Care 2006; 10:R64–R164. [DOI] [PMC free article] [PubMed] [Google Scholar]
- 163.Perloff D, Grim C, Flack J, Frohlich ED, Hill M, McDonald M, et al. Human blood pressure determination by sphygmomanometry. Circulation 1993; 88:2460–2470. [DOI] [PubMed] [Google Scholar]
- 164.Buchanan S, Orris P, Karliner J. Alternatives to the mercury sphygmomanometer. J Public Health Policy 2011; 32:107–120. [DOI] [PubMed] [Google Scholar]
- 165.Bland JM, Altman DG. Statistical methods for assessing agreement between two methods of clinical measurement. Int J Nurs Stud 2010; 47:931–936. [PubMed] [Google Scholar]
- 166.Latman NS, Lanier R. Expressions of accuracy in the evaluation of biomedical instrumentation. Biomed Instrum Technol 1998; 32:282. [PubMed] [Google Scholar]
- 167.Ochiai H, Miyazaki N, Miyata T, Mitake A, Tochikubo O, Ishii M. Assessment of the accuracy of indirect blood pressure measurements. Jpn Heart J 1997; 38:393–407. [DOI] [PubMed] [Google Scholar]
- 168.White WB, Lund-Johansen P, Omvik P. Assessment of four ambulatory blood pressure monitors and measurements by clinicians versus intraarterial blood pressure at rest and during exercise. Am J Cardiol 1990; 65:60–66. [DOI] [PubMed] [Google Scholar]
- 169.Cohn JN. Blood pressure measurement in shock. Mechanism of inaccuracy in ausculatory and palpatory methods. JAMA 1967; 199:118–122. [DOI] [PubMed] [Google Scholar]
- 170.Bos WJ, van Goudoever J, Wesseling KH, Rongen GA, Hoedemaker G, Lenders JW, et al. Pseudohypertension and the measurement of blood pressure. Hypertension 1992; 20:26–31. [DOI] [PubMed] [Google Scholar]
- 171.Ribezzo S, Spina E, Di Bartolomeo S, Sanson G. Noninvasive techniques for blood pressure measurement are not a reliable alternative to direct measurement: a randomized crossover trial in ICU. Sci World J 2014; 2014:1–8. [DOI] [PMC free article] [PubMed] [Google Scholar]
- 172.Turjanmaa V. Determination of blood pressure level and changes in physiological situations: comparison of the standard cuff method with direct intra-arterial recording. Clin Physiol 1989; 9:373–387. [DOI] [PubMed] [Google Scholar]
- 173.Saxena Y, Saxena V, Gupta R. Clinical validation of aneroid sphygmomanometer. Indian J Physiol Pharmacol 2012; 56:255–261. [PubMed] [Google Scholar]
- 174.Ferreira KA, Santos AC, Arthur TC, Santos DA, Pereira D, Freitas EO, et al. Validation of Missouri aneroid sphygmomanometer to measure blood pressure in patients with cancer. Arq Bras Cardiol 2010; 95:244–250. [DOI] [PubMed] [Google Scholar]
- 175.Ma Y, Temprosa M, Fowler S, Prineas RJ, Montez MG, Brown-Friday J, et al. Evaluating the accuracy of an aneroid sphygmomanometer in a clinical trial setting. Am J Hypertens 2009; 22:263–266. [DOI] [PMC free article] [PubMed] [Google Scholar]
- 176.Nelson D, Kennedy B, Regnerus C, Schweinle A. Accuracy of automated blood pressure monitors. J Dent Hyg 2008; 82:35–135. [PubMed] [Google Scholar]
- 177.Dorigatti F, Bonso E, Zanier A, Palatini P. Validation of Heine Gamma G7 (G5) and XXL-LF aneroid devices for blood pressure measurement. Blood Press Monit 2007; 12:29–33. [DOI] [PubMed] [Google Scholar]
- 178.Reinders A, Jones CR, Cuckson AC, Shennan AH. The Maxi Stabil 3: validation of an aneroid device according to a modified British Hypertension Society protocol. Blood Press Monit 2003; 8:83–89. [DOI] [PubMed] [Google Scholar]
- 179.Braam RL, de Maat C, Thien T. Accuracy of the Welch Allyn Vital Signs Monitor 52000 automatic blood pressure measuring device according to a modified British Hypertension Society protocol. Blood Press Monit 2002; 7:185–189. [DOI] [PubMed] [Google Scholar]
- 180.Skirton H, Chamberlain W, Lawson C, Ryan H, Young E. A systematic review of variability and reliability of manual and automated blood pressure readings. J Clin Nurs 2011; 20:602–614. [DOI] [PubMed] [Google Scholar]
- 181.Wan Y, Heneghan C, Stevens R, McManus RJ, Ward A, Perera R, et al. Determining which automatic digital blood pressure device performs adequately: a systematic review. J Hum Hypertens 2010; 24:431–438. [DOI] [PMC free article] [PubMed] [Google Scholar]
- 182.McMahon N, Hogg LA, Corfield AR, Exton AD. Comparison of noninvasive and invasive blood pressure in aeromedical care. Anaesthesia 2012; 67:1343–1347. [DOI] [PubMed] [Google Scholar]
- 183.Mireles SA, Jaffe RA, Drover DR, Brock-Utne JG. A poor correlation exists between oscillometric and radial arterial blood pressure as measured by the Philips MP90 monitor. J Clin Monit Comput 2009; 23:169–174. [DOI] [PubMed] [Google Scholar]
- 184.Muecke S, Bersten A, Plummer J. The mean machine; accurate noninvasive blood pressure measurement in the critically ill patient. J Clin Monit Comput 2009; 23:283–297. [DOI] [PubMed] [Google Scholar]
- 185.Ohte N, Saeki T, Miyabe H, Sakata S, Mukai S, Hayano J, et al. Relationship between blood pressure obtained from the upper arm with a cuff-type sphygmomanometer and central blood pressure measured with a catheter-tipped micromanometer. Heart Vessels 2007; 22:410–415. [DOI] [PubMed] [Google Scholar]
- 186.Manios E, Vemmos K, Tsivgoulis G, Barlas G, Koroboki E, Eleni K, et al. Comparison of noninvasive oscillometric and intra-arterial blood pressure measurements in hyperacute stroke. Blood Press Monit 2007; 12:149–156. [DOI] [PubMed] [Google Scholar]
- 187.Weber F, Lindemann M, Erbel R, Philipp T. Indirect and direct simultaneous, comparative blood pressure measurements with the Bosotron 2 device. Kidney Blood Press Res 1999; 22:166–171. [DOI] [PubMed] [Google Scholar]
- 188.Lehmann KG, Gelman JA, Weber MA, Lafrades A. Comparative accuracy of three automated techniques in the noninvasive estimation of central blood pressure in men. Am J Cardiol 1998; 81:1004–1012. [DOI] [PubMed] [Google Scholar]
- 189.Russell AE, Tonkin AL, Wing LM, Hassam RM, McRitchie RJ, Aylward PE, et al. Accuracy of the Takeda TM-2420 ambulatory blood pressure monitor. Clin Exp Pharmacol Physiol 1989; 16:253–256. [DOI] [PubMed] [Google Scholar]
- 190.Lim Y-H, Choi SY, Oh KW, Kim Y, Cho ES, Choi BY, et al. Comparison between an automated device and a manual mercury sphygmomanometer in an epidemiological survey of hypertension prevalence. Am J Hypertens 2014; 27:537–545. [DOI] [PubMed] [Google Scholar]
- 191.Collins M, Cummings A, Skaggs C, Weller R, Cronin SN. Differences in manual and automatic blood pressures in telemetry patients with atrial fibrillation. Dimens Crit Care Nurs 2013; 32:262–265. [DOI] [PubMed] [Google Scholar]
- 192.Ishikawa J, Nasothimiou EG, Karpettas N, McDoniel S, Feltheimer SD, Stergiou GS, et al. Automatic office blood pressure measured without doctors or nurses present. Blood Press Monit 2012; 17:96–102. [DOI] [PMC free article] [PubMed] [Google Scholar]
- 193.Eguchi K, Kuruvilla S, Ishikawa J, Ogedegbe G, Gerin W, Schwartz JE, et al. Correlations between different measures of clinic, home, and ambulatory blood pressure in hypertensive patients. Blood Press Monit 2011; 16:142–148. [DOI] [PubMed] [Google Scholar]
- 194.Lamarre-Cliché M, Cheong NNG, Larochelle P. Comparative assessment of four blood pressure measurement methods in hypertensives. Can J Cardiol 2011; 27:455–460. [DOI] [PubMed] [Google Scholar]
- 195.Vera-Cala LM, Orostegui M, Valencia-Angel LI, López N, Bautista LE. Accuracy of the Omron HEM-705 CP for blood pressure measurement in large epidemiologic studies. Arq Bras Cardiol 2011; 96:393–398. [DOI] [PubMed] [Google Scholar]
- 196.Ostchega Y, Nwankwo T, Sorlie PD, Wolz M, Zipf G. Assessing the validity of the Omron HEM-907XL oscillometric blood pressure measurement device in a National Survey environment. J Clin Hypertens 2010; 12:22–28. [DOI] [PMC free article] [PubMed] [Google Scholar]
- 197.Heinemann M, Sellick K, Rickard C, Reynolds P, McGrail M. Automated versus manual blood pressure measurement: a randomized crossover trial. Int J Nurs Pract 2008; 14:296–302. [DOI] [PubMed] [Google Scholar]
- 198.Bern L, Brandt M, Mbelu N, Asonye U, Fisher T, Shaver Y, et al. Differences in blood pressure values obtained with automated and manual methods in medical inpatients. Medsurg Nurs 2007; 16:356–361. [PubMed] [Google Scholar]
- 199.Coleman A, Freeman P, Steel S, Shennan A. Validation of the Omron 705IT (HEM-759-E) oscillometric blood pressure monitoring device according to the British Hypertension Society protocol. Blood Press Monit 2006; 11:27–32. [DOI] [PubMed] [Google Scholar]
- 200.Semret M, Zidehsarai M, Agarwal R. Accuracy of oscillometric blood pressure monitoring with concurrent auscultatory blood pressure in hemodialysis patients. Blood Press Monit 2005; 10:249–255. [DOI] [PubMed] [Google Scholar]
- 201.Alpert BS. Validation of the Pharma-Smart PS-2000 public use blood pressure monitor. Blood Press Monit 2004; 9:19–23. [DOI] [PubMed] [Google Scholar]
- 202.Cienki JJ, DeLuca LA, Daniel N. The validity of emergency department triage blood pressure measurements. Acad Emerg Med 2004; 11:237–243. [DOI] [PubMed] [Google Scholar]
- 203.Graves JW, Nash C, Burger K, Bailey K, Sheps SG. Clinical decision-making in hypertension using an automated (BpTRU) measurement device. J Hum Hypertens 2003; 17:823–827. [DOI] [PubMed] [Google Scholar]
- 204.Shahriari M, Rotenberg DK, Nielsen JK, Wiinberg N, Nielsen PE. Measurement of arm blood pressure using different oscillometry manometers compared to auscultatory readings. Blood Press 2003; 12:155–159. [DOI] [PubMed] [Google Scholar]
- 205.White WB, Herbst T, Thavarajah S, Giacco S. Clinical evaluation of the Trimline blood pressure cuffs with the Accutorr Plus Monitor. Blood Press Monit 2003; 8:137–140. [DOI] [PubMed] [Google Scholar]
- 206.Beaubien ER, Card CM, Card SE, Biem HJ, Wilson TW. Accuracy of the Dinamap 1846 XT automated blood pressure monitor. J Hum Hypertens 2002; 16:647–652. [DOI] [PubMed] [Google Scholar]
- 207.Coe T, Houghton K. Comparison of the automated Dinamap blood pressure monitor with the mercury sphygmomanometer for detecting hypertension in the day case preassessment clinic. Ambul Surg 2002; 10:9–15. [Google Scholar]
- 208.Cuckson AC, Reinders A, Shabeeh H, Shennan AH. British Hypertension Society. Validation of the Microlife BP 3BTO-A oscillometric blood pressure monitoring device according to a modified British Hypertension Society protocol. Blood Press Monit 2002; 7:319–324. [DOI] [PubMed] [Google Scholar]
- 209.El Assaad MA, Topouchian JA, Darné BM, Asmar RG. Validation of the Omron HEM-907 device for blood pressure measurement. Blood Press Monit 2002; 7:237–241. [DOI] [PubMed] [Google Scholar]
- 210.Golara M, Jones C, Randhawa M, Shennan AH. Inflationary oscillometric blood pressure monitoring: validation of the OMRON-MIT. Blood Press Monit 2002; 7:325–328. [DOI] [PubMed] [Google Scholar]
- 211.Mattu GS, Perry TL, Jr, Wright JM. Comparison of the oscillometric blood pressure monitor (BPM-100(Beta)) with the auscultatory mercury sphygmomanometer. Blood Press Monit 2001; 6:153–159. [DOI] [PubMed] [Google Scholar]
- 212.White WB, Anwar YA. Evaluation of the overall efficacy of the Omron office digital blood pressure HEM-907 monitor in adults. Blood Press Monit 2001; 6:107–110. [DOI] [PubMed] [Google Scholar]
- 213.Wright JM, Mattu GS, Perry TL, Jr, Gelferc ME, Strange KD, Zorn A, et al. Validation of a new algorithm for the BPM-100 electronic oscillometric office blood pressure monitor. Blood Press Monit 2001; 6:161–165. [DOI] [PubMed] [Google Scholar]
- 214.Cavalcanti S, Marchesi G, Ghidini C. Validation of automated oscillometric sphygmomanometer (HDBPM) for arterial pressure measurement during haemodialysis. Med Biol Eng Comput 2000; 38:98–101. [DOI] [PubMed] [Google Scholar]
- 215.Kuo CS, Hwu CM, Kwok CF, Hsiao LC, Weih MJ, Lee SH, et al. Using semi-automated oscillometric blood pressure measurement in diabetic patients and their offspring. J Diabet Complications 2000; 14:288–293. [DOI] [PubMed] [Google Scholar]
- 216.Anwar YA, Giacco S, McCabe EJ, Tendler BE, White WB. Evaluation of the efficacy of the Omron HEM-737 IntelliSense device for use on adults according to the recommendations of the Association for the Advancement of Medical Instrumentation. Blood Press Monit 1998; 3:261–265. [PubMed] [Google Scholar]
- 217.Kwek K, Chan YG, Tan KH, Yeo GS. Validation of an oscillometric electronic sphygmomanometer in an obstetric population. Am J Hypertens 1998; 11:978–982. [DOI] [PubMed] [Google Scholar]
- 218.Shuler CL, Allison N, Holcomb S, Harlan M, McNeill J, Robinett G, et al. Accuracy of an automated blood pressure device in stable inpatients: optimum vs routine use. Arch Intern Med 1998; 158:714–721. [DOI] [PubMed] [Google Scholar]
- 219.Cartwright C, Unwin N, Stephenson P. Agreement between the Takeda UA-731 automatic blood pressure measuring device and the manual mercury sphygmomanometer: an assessment under field conditions in Newcastle upon Tyne, UK. J Epidemiol Community Health 1996; 50:218–222. [DOI] [PMC free article] [PubMed] [Google Scholar]
- 220.Goonasekera CD, Dillon MJ. Random zero sphygmomanometer versus automatic oscillometric blood pressure monitor; is either the instrument of choice? J Hum Hypertens 1995; 9:885–889. [PubMed] [Google Scholar]
- 221.Imai Y, Hashimoto J, Minami N, Munakata M, Watanabe N, Sakuma H, et al. Accuracy and performance of the Terumo ES-H51, a new portable blood pressure monitor. Am J Hypertens 1994; 7:255–260. [DOI] [PubMed] [Google Scholar]
- 222.Jamieson MJ, Webster J, Witte K, Huggins MM, MacDonald TM, de Beaux A, et al. An evaluation of the A&D UA-751 semi-automated cuff-oscillometric sphygmomanometer. J Hypertens 1990; 8:377–381. [DOI] [PubMed] [Google Scholar]
- 223.Dawson AJ, Middlemiss C, Vanner TF. Miniature electronic blood pressure monitor compared with a blind-reading mercury sphygmomanometer in pregnancy. Eur J Obstet Gynecol Reprod Biol 1989; 33:147–153. [DOI] [PubMed] [Google Scholar]
- 224.Johnston DW, Shah D. An evaluation of the Takeda UA751 automatic sphygmomanometer. Behav Res Ther 1989; 27:203–204. [DOI] [PubMed] [Google Scholar]
- 225.Jenner DA, Beilin LJ, Vandongen R, DeKlerk NH. A comparison of blood pressure measurements obtained with the Dinamap 845XT, the standard mercury sphygmomanometer and the London School of Hygiene device. Clin Exp Hypertens 1988; 10:575–588. [DOI] [PubMed] [Google Scholar]
- 226.Malatino LS, Brown WC. Comparison of a new portable electronic sphygmomanometer (Copal UA251) with the Hawksley random zero machine. Clin Exp Hypertens 1988; 10:589–596. [DOI] [PubMed] [Google Scholar]
- 227.Bassein L, Borghi C, Costa FV, Strocchi E, Mussi A, Ambrosioni E. Comparison of three devices for measuring blood pressure. Stat Med 1985; 4:361–368. [DOI] [PubMed] [Google Scholar]
- 228.Foran TG, Sheahan NF, Cunningham C, Feely J. Pseudo-hypertension and arterial stiffness: a review. Physiol Meas 2004; 25:R21–33. [DOI] [PubMed] [Google Scholar]
- 229.A’Court C, Stevens R, Sanders S, Ward A, McManus R, Heneghan C. Type and accuracy of sphygmomanometers in primary care: a cross-sectional observational study. Br J Gen Pract 2011; 61:e598–e603. [DOI] [PMC free article] [PubMed] [Google Scholar]
- 230.de Greeff A, Lorde I, Wilton A, Seed P, Coleman AJ, Shennan AH. Calibration accuracy of hospital-based noninvasive blood pressure measuring devices. J Hum Hypertens 2010; 24:58–63. [DOI] [PubMed] [Google Scholar]
- 231.Coleman AJ, Steel SD, Ashworth M, Vowler SL, Shennan A. Accuracy of the pressure scale of sphygmomanometers in clinical use within primary care. Blood Press Monit 2005; 10:181–188. [DOI] [PubMed] [Google Scholar]
- 232.Shah N, Sibbritt D, Heaney S, Sharples J. Sphygmomanometers: an audit in general practice. Aust Fam Physician 2004; 33:952–954. [PubMed] [Google Scholar]
- 233.Waugh JJS, Gupta M, Rushbrook J, Halligan A, Shennan AH. Hidden errors of aneroid sphygmomanometers. Blood Press Monit 2002; 7:309–312. [DOI] [PubMed] [Google Scholar]
- 234.Ashworth M, Gordon K, Baker G, Deshmukh A. Sphygmomanometer calibration: a survey of one inner-city primary care group. J Hum Hypertens 2001; 15:259–262. [DOI] [PubMed] [Google Scholar]
- 235.Knight T, Leech F, Jones A, Walker L, Wickramasinghe R, Angris S, et al. Sphygmomanometers in use in general practice: an overlooked aspect of quality in patient care. J Hum Hypertens 2001; 15:681–684. [DOI] [PubMed] [Google Scholar]
- 236.Jones JS, Ramsey W, Hetrick T. Accuracy of prehospital sphygmomanometers. J Emerg Med 1987; 5:23–27. [DOI] [PubMed] [Google Scholar]
- 237.Burke MJ, Towers HM, O’Malley K, Fitzgerald DJ, O’Brien ET. Sphygmomanometers in hospital and family practice: problems and recommendations. Br Med J (Clin Res Ed) 1982; 285:469–471. [DOI] [PMC free article] [PubMed] [Google Scholar]
- 238.Shaw A, Deehan C, Lenihan JMA. Sphygmomanometers: errors due to blocked vents. BMJ 1979; 1:789–790. [DOI] [PMC free article] [PubMed] [Google Scholar]
- 239.Amoore JN, Guehenec M, Scordecchia R, Scott DHT. Auditing the technology used to measure blood pressure. J Med Eng Technol 2010; 34:209–216. [DOI] [PubMed] [Google Scholar]
- 240.Cozanitis DA, Jones CJ. The extent of inaccurate aneroid sphygmomanometers in a hospital setting. Wien Med Wochenschr 2010; 160:356–361. [DOI] [PubMed] [Google Scholar]
- 241.Moore TA, Sorokin AV, Hirst C, Thornton-Thompson S, Thompson PD. The accuracy of aneroid sphygmomanometers in the ambulatory setting. Prev Cardiol 2008; 11:90–94. [DOI] [PubMed] [Google Scholar]
- 242.Canzanello VJ, Jensen PL, Schwartz GL. Are aneroid sphygmomanometers accurate in hospital and clinic settings? Arch Intern Med 2001; 161:729–731. [DOI] [PubMed] [Google Scholar]
- 243.Yarows SA, Qian K. Accuracy of aneroid sphygmomanometers in clinical usage: University of Michigan experience. Blood Press Monit 2001; 6:101–106. [DOI] [PubMed] [Google Scholar]
- 244.Başak O, Karazeybek Ş. Accuracy of sphygmomanometers. Turk J Med Sci 1999; 29:487–491. [Google Scholar]
- 245.Mion D, Pierin AM. How accurate are sphygmomanometers? J Hum Hypertens 1998; 12:245–248. [DOI] [PubMed] [Google Scholar]
- 246.Knaus VL, Bailey RH, Bauer JH. Aneroid sphygmomanometers: an assessment of accuracy at a university hospital and clinics. Arch Intern Med 1991; 151:1409–1412. [DOI] [PubMed] [Google Scholar]
- 247.Bowman CE. Blood pressure errors with aneroid sphygmomanometers. Lancet 1981; 1:1005. [DOI] [PubMed] [Google Scholar]
- 248.Conceiçao S, Ward MK, Kerr DNS. Defects in sphygmomanometers: an important source of error in blood pressure recording. BMJ 1976; 1:886–888. [DOI] [PMC free article] [PubMed] [Google Scholar]
- 249.Nikolic SB, Abhayaratna WP, Leano R, Stowasser M, Sharman JE. Waiting a few extra minutes before measuring blood pressure has potentially important clinical and research ramifications. J Hum Hypertens 2014; 28:56–61. [DOI] [PubMed] [Google Scholar]
- 250.Sala C, Santin E, Rescaldani M, Magrini F. How long shall the patient rest before clinic blood pressure measurement? Am J Hypertens 2006; 19:713–717. [DOI] [PubMed] [Google Scholar]
- 251.Zachariah PK, Sheps SG, Moore AG. Office blood pressures in supine, sitting, and standing positions: correlation with ambulatory blood pressures. Int J Cardiol 1990; 28:353–360. [DOI] [PubMed] [Google Scholar]
- 252.Eşer I, Khorshid L, Yapucu Günes U, Demir Y. The effect of different body positions on blood pressure. J Clin Nurs 2007; 16:137–140. [DOI] [PubMed] [Google Scholar]
- 253.Cicolini G, Pizzi C, Palma E, Bucci M, Schioppa F, Mezzetti A, et al. Differences in blood pressure by body position (supine, Fowler's, and sitting) in hypertensive subjects. Am J Hypertens 2011; 24:1073–1079. [DOI] [PubMed] [Google Scholar]
- 254.Cicolini G, Gagliardi G, Ballone E. Effect of Fowler's body position on blood pressure measurement. J Clin Nurs 2010; 19:3581–3583. [DOI] [PubMed] [Google Scholar]
- 255.Netea RT, Lenders JWM, Smits P, Thien T. Both body and arm position significantly influence blood pressure measurement. J Hum Hypertens 2003; 17:459–462. [DOI] [PubMed] [Google Scholar]
- 256.Netea RT, Smits P, Lenders JW, Thien T. Does it matter whether blood pressure measurements are taken with subjects sitting or supine? J Hypertens 1998; 16:263–268. [DOI] [PubMed] [Google Scholar]
- 257.Terént A, Breig-Asberg E. Epidemiological perspective of body position and arm level in blood pressure measurement. Blood Press 1994; 3:156–163. [DOI] [PubMed] [Google Scholar]
- 258.Jamieson MJ, Webster J, Philips S, Jeffers TA, Scott AK, Robb OJ, et al. The measurement of blood pressure: sitting or supine, once or twice? J Hypertens 1990; 8:635–640. [DOI] [PubMed] [Google Scholar]
- 259.Carel RS, Silverberg DS, Shoenfeld Y, Eldar M, Snir C, Mor G. Changes in blood pressure in the lying and sitting positions in normotensive, borderline and hypertensive subjects. Am J Med Sci 1983; 285:2–11. [DOI] [PubMed] [Google Scholar]
- 260.Pinar R, Ataalkin S, Watson R. The effect of crossing legs on blood pressure in hypertensive patients. J Clin Nurs 2010; 19:1284–1288. [DOI] [PubMed] [Google Scholar]
- 261.Adiyaman A, Tosun N, Elving LD, Deinum J, Lenders JWM, Thien T. The effect of crossing legs on blood pressure. Blood Press Monit 2007; 12:189–193. [DOI] [PubMed] [Google Scholar]
- 262.Pinar R, Sabuncu N, Oksay A. Effects of crossed leg on blood pressure. Blood Press 2004; 13:252–254. [DOI] [PubMed] [Google Scholar]
- 263.Avvampato CS. Effect of one leg crossed over the other at the knee on blood pressure in hypertensive patients. Nephrol Nurs J 2001; 28:325–328. [PubMed] [Google Scholar]
- 264.Keele-Smith R, Price-Daniel C. Effects of crossing legs on blood pressure measurement. Clin Nurs Res 2001; 10:202–213. [DOI] [PubMed] [Google Scholar]
- 265.Foster-Fitzpatrick L, Ortiz A, Sibilano H, Marcantonio R, Braun LT. The effects of crossed leg on blood pressure measurement. Nurs Res 1999; 48:105–108. [DOI] [PubMed] [Google Scholar]
- 266.Peters GL, Binder SK, Campbell NR. The effect of crossing legs on blood pressure: a randomized single-blind cross-over study. Blood Press Monit 1999; 4:97–101. [PubMed] [Google Scholar]
- 267.Cushman WC, Cooper KM, Horne RA, Meydrech EF. Effect of back support and stethoscope head on seated blood pressure determinations. Am J Hypertens 1990; 3:240–241. [DOI] [PubMed] [Google Scholar]
- 268.Familoni OB, Olunuga TO. Comparison of the effects of arm position and support on blood pressure in hypertensive and normotensive subjects. Cardiovasc J South Afr 2005; 16:85–88. [PubMed] [Google Scholar]
- 269.Beck FM, Weaver JM, Blozis GG, Unverferth DV. Effect of arm position and arm support on indirect blood pressure measurements made in a dental chair. J Am Dent Assoc 1983; 106:645–647. [DOI] [PubMed] [Google Scholar]
- 270.Silverberg DS, Shemesh E, Iaina A. The unsupported arm: a cause of falsely raised blood pressure readings. BMJ 1977; 2:1331–11331. [DOI] [PMC free article] [PubMed] [Google Scholar]
- 271.Adiyaman A, Verhoeff R, Lenders JWM, Deinum J, Thien T. The position of the arm during blood pressure measurement in sitting position. Blood Press Monit 2006; 11:309–313. [DOI] [PubMed] [Google Scholar]
- 272.Hemingway TJ, Guss DA, Abdelnur D. Arm position and blood pressure measurement. Ann Intern Med 2004; 140:74–75. [DOI] [PubMed] [Google Scholar]
- 273.Mourad A, Carney S, Gillies A, Jones B, Nanra R, Trevillian P. Arm position and blood pressure: a risk factor for hypertension? J Hum Hypertens 2003; 17:389–395. [DOI] [PubMed] [Google Scholar]
- 274.Netea RT, Lenders JW, Smits P, Thien T. Arm position is important for blood pressure measurement. J Hum Hypertens 1999; 13:105–109. [DOI] [PubMed] [Google Scholar]
- 275.Parr GD, Poole PH. Effects of sphygmomanometer type and position of the arm on blood pressure measurement. J Hum Hypertens 1988; 2:153–156. [PubMed] [Google Scholar]
- 276.Mariotti G, Alli C, Avanzini F, Canciani C, Di Tullio M, Manzini M, et al. Arm position as a source of error in blood pressure measurement. Clin Cardiol 1987; 10:591–593. [DOI] [PubMed] [Google Scholar]
- 277.Waal-Manning HJ, Paulin JM. Effects of arm position and support on blood-pressure readings. J Clin Hypertens 1987; 3:624–630. [PubMed] [Google Scholar]
- 278.Webster J, Newnham D, Petrie JC, Lovell HG. Influence of arm position on measurement of blood pressure. Br Med J Clin Res Ed 1984; 288:1574–1575. [DOI] [PMC free article] [PubMed] [Google Scholar]
- 279.Fonseca-Reyes S, Fajardo-Flores I, Montes-Casillas M, Forsyth-Macquarrie A. Differences and effects of medium and large adult cuffs on blood pressure readings in individuals with muscular arms. Blood Press Monit 2009; 14:166–171. [DOI] [PubMed] [Google Scholar]
- 280.Fonseca-Reyes S, de Alba-García JG, Parra-Carrillo JZ, Paczka-Zapata JA. Effect of standard cuff on blood pressure readings in patients with obese arms. How frequent are arms of a ‘large circumference’? Blood Press Monit 2003; 8:101–106. [DOI] [PubMed] [Google Scholar]
- 281.Bakx C, Oerlemans G, van den Hoogen H, van Weel C, Thien T. The influence of cuff size on blood pressure measurement. J Hum Hypertens 1997; 11:439–445. [DOI] [PubMed] [Google Scholar]
- 282.Iyriboz Y, Hearon CM, Edwards K. Agreement between large and small cuffs in sphygmomanometry: a quantitative assessment. J Clin Monit 1994; 10:127–133. [DOI] [PubMed] [Google Scholar]
- 283.Sprafka JM, Strickland D, Gómez-Marín O, Prineas RJ. The effect of cuff size on blood pressure measurement in adults. Epidemiol 1991; 2:214–217. [DOI] [PubMed] [Google Scholar]
- 284.Pinar R, Ataalkin S, Watson R. The effect of clothes on sphygmomanometric blood pressure measurement in hypertensive patients. J Clin Nurs 2010; 19:1861–1864. [DOI] [PubMed] [Google Scholar]
- 285.Liebl M, Holzgreve H, Schulz M, Crispin A, Bogner J. The effect of clothes on sphygmomanometric and oscillometric blood pressure measurement. Blood Press 2004; 13:279–282. [DOI] [PubMed] [Google Scholar]
- 286.Kahan E, Yaphe J, Knaani-Levinz H, Weingarten MA. Comparison of blood pressure measurements on the bare arm, below a rolled-up sleeve, or over a sleeve. Fam Pract 2003; 20:730–732. [DOI] [PubMed] [Google Scholar]
- 287.Holleman DR, Jr, Westman EC, McCrory DC, Simel DL. The effect of sleeved arms on oscillometric blood pressure measurement. J Gen Intern Med 1993; 8:325–326. [DOI] [PubMed] [Google Scholar]
- 288.Weber F, Anlauf M, Hirche H, Roggenbuck U, Philipp T. Differences in blood pressure values by simultaneous auscultation of Korotkoff sounds inside the cuff and in the antecubital fossa. J Hum Hypertens 1999; 13:695–700. [DOI] [PubMed] [Google Scholar]
- 289.Ljungvall P, Thulin T. Hand-free stethoscope – method and instrument for more reliable blood pressure measurements. J Intern Med 1991; 230:213–217. [DOI] [PubMed] [Google Scholar]
- 290.Zheng D, Giovannini R, Murray A. Effect of respiration, talking and small body movements on blood pressure measurement. J Hum Hypertens 2012; 26:458–462. [DOI] [PubMed] [Google Scholar]
- 291.Le Pailleur C, Montgermont P, Feder JM, Metzger JP, Vacheron A. Talking effect and ‘white coat’ effect in hypertensive patients: physical effort or emotional content? Behav Med 2001; 26:149–157. [DOI] [PubMed] [Google Scholar]
- 292.Le Pailleur C, Vacheron A, Landais P, Mounier-Véhier C, Feder JM, Montgermont P, et al. Talking effect and white coat phenomenon in hypertensive patients. Behav Med 1996; 22:114–122. [DOI] [PubMed] [Google Scholar]
- 293.Liehr P. Uncovering a hidden language: the effects of listening and talking on blood pressure and heart rate. Arch Psychiatr Nurs 1992; 6:306–311. [DOI] [PubMed] [Google Scholar]
- 294.Hellmann R, Grimm SA. The influence of talking on diastolic blood pressure readings. Res Nurs Health 1984; 7:253–256. [DOI] [PubMed] [Google Scholar]
- 295.Malinow KL, Lynch JJ, Thomas SA, Friedmann E, Long JM. Automated blood pressure recording: the phenomenon of blood pressure elevations during speech. Angiology 1982; 33:474–479. [DOI] [PubMed] [Google Scholar]
- 296.Kantola I, Vesalainen R, Kangassalo K, Kariluoto A. Bell or diaphragm in the measurement of blood pressure? J Hypertens 2005; 23:499–503. [DOI] [PubMed] [Google Scholar]
- 297.Norman E, Gadaleta D, Griffin CC. An evaluation of three blood pressure methods in a stabilized acute trauma population. Nurs Res 1991; 40:86–89. [PubMed] [Google Scholar]
- 298.Byra-Cook CJ, Dracup KA, Lazik AJ. Direct and indirect blood pressure in critical care patients. Nurs Res 1990; 39:285–288. [PubMed] [Google Scholar]
- 299.Mauro AM. Effects of bell versus diaphragm on indirect blood pressure measurement. Heart Lung J Crit Care 1988; 17:489–494. [PubMed] [Google Scholar]
- 300.Londe S, Klitzner TS. Auscultatory blood pressure measurement – effect of pressure on the head of the stethoscope. West J Med 1984; 141:193–195. [PMC free article] [PubMed] [Google Scholar]
- 301.Zheng D, Amoore JN, Mieke S, Murray A. How important is the recommended slow cuff pressure deflation rate for blood pressure measurement? Ann Biomed Eng 2011; 39:2584–2591. [DOI] [PubMed] [Google Scholar]
- 302.Reinders LW, Mos CN, Thornton C, Ogle R, Makris A, Child A, et al. Time poor: rushing decreases the accuracy and reliability of blood pressure measurement technique in pregnancy. Hypertens Pregnancy 2006; 25:81–91. [DOI] [PubMed] [Google Scholar]
- 303.Yong PG, Geddes LA. The effect of cuff pressure deflation rate on accuracy in indirect measurement of blood pressure with the auscultatory method. J Clin Monit 1987; 3:155–159. [DOI] [PubMed] [Google Scholar]
- 304.Myers MG, Valdivieso M, Kiss A. Optimum frequency of office blood pressure measurement using an automated sphygmomanometer. Blood Press Monit 2008; 13:333–338. [DOI] [PubMed] [Google Scholar]
- 305.Yarows SA, Patel K, Brook R. Rapid oscillometric blood pressure measurement compared to conventional oscillometric measurement. Blood Press Monit 2001; 6:145–147. [DOI] [PubMed] [Google Scholar]
- 306.Koehler NR, Figueiredo CEP, Ribeiro ACM. Serial blood pressure measurements. Braz J Med Biol Res 2002; 35:555–559. [DOI] [PubMed] [Google Scholar]
- 307.van Loo JM, Peer PG, Thien TA. Twenty-five minutes between blood pressure readings: the influence on prevalence rates of isolated systolic hypertension. J Hypertens 1986; 4:631–635. [DOI] [PubMed] [Google Scholar]
- 308.Burstyn P, O’Donovan B, Charlton I. Blood pressure variability: the effects of repeated measurement. Postgrad Med J 1981; 57:488–491. [DOI] [PMC free article] [PubMed] [Google Scholar]
- 309.Verberk WJ, Kessels AGH, Thien T. Blood pressure measurement method and inter-arm differences: a meta-analysis. Am J Hypertens 2011; 24:1201–1208. [DOI] [PubMed] [Google Scholar]
- 310.Clark CE, Campbell JL, Evans PH, Millward A. Prevalence and clinical implications of the inter-arm blood pressure difference: a systematic review. J Hum Hypertens 2006; 20:923–931. [DOI] [PubMed] [Google Scholar]
- 311.Agarwal R, Bunaye Z, Bekele D. Prognostic significance of between-arm blood pressure differences. Hypertension 2008; 51:657–662. [DOI] [PubMed] [Google Scholar]
- 312.Lazar J, Holman S, Minkoff HL, Dehovitz JA, Sharma A. Interarm blood pressure differences in the women's interagency HIV study. AIDS Res Hum Retroviruses 2008; 24:695–700. [DOI] [PubMed] [Google Scholar]
- 313.Poon LCY, Kametas N, Strobl I, Pachoumi C, Nicolaides KH. Inter-arm blood pressure differences in pregnant women. BJOG Int J Obstet Gynaecol 2008; 115:1122–1130. [DOI] [PubMed] [Google Scholar]
- 314.Stergiou GS, Lin C-W, Lin C-M, Chang S-L, Protogerou AD, Tzamouranis D, et al. Automated device that complies with current guidelines for office blood pressure measurement: design and pilot application study of the Microlife WatchBP Office device. Blood Press Monit 2008; 13:231–235. [DOI] [PubMed] [Google Scholar]
- 315.Clark CE, Campbell JL, Powell RJ, Thompson JF. The inter-arm blood pressure difference and peripheral vascular disease: cross-sectional study. Fam Pract 2007; 24:420–426. [DOI] [PubMed] [Google Scholar]
- 316.Clark CE, Campbell JL, Powell RJ. The interarm blood pressure difference as predictor of cardiovascular events in patients with hypertension in primary care: cohort study. J Hum Hypertens 2007; 21:633–638. [DOI] [PubMed] [Google Scholar]
- 317.Eguchi K, Yacoub M, Jhalani J, Gerin W, Schwartz JE, Pickering TG. Consistency of blood pressure differences between the left and right arms. Arch Intern Med 2007; 167:388–393. [DOI] [PubMed] [Google Scholar]
- 318.Arnett DK, Tang W, Province MA, Oberman A, Ellison RC, Morgan D, et al. Interarm differences in seated systolic and diastolic blood pressure: the Hypertension Genetic Epidemiology Network study. J Hypertens 2005; 23:1141–1147. [DOI] [PubMed] [Google Scholar]
- 319.Karagiannis A, Tziomalos K, Krikis N, Sfikas G, Dona K, Zamboulis C. The unilateral measurement of blood pressure may mask the diagnosis or delay the effective treatment of hypertension. Angiology 2005; 56:565–569. [DOI] [PubMed] [Google Scholar]
- 320.Kimura A, Hashimoto J, Watabe D, Takahashi H, Ohkubo T, Kikuya M, et al. Patient characteristics and factors associated with inter-arm difference of blood pressure measurements in a general population in Ohasama, Japan. J Hypertens 2004; 22:2277–2283. [DOI] [PubMed] [Google Scholar]
- 321.Chang JJ, Rabinowitz D, Shea S. Sources of variability in blood pressure measurement using the Dinamap PRO 100 automated oscillometric device. Am J Epidemiol 2003; 158:1218–1226. [DOI] [PubMed] [Google Scholar]
- 322.Lane D, Beevers M, Barnes N, Bourne J, John A, Malins S, et al. Inter-arm differences in blood pressure: when are they clinically significant? J Hypertens 2002; 20:1089–1095. [DOI] [PubMed] [Google Scholar]
- 323.Pesola GR, Pesola HR, Lin M, Nelson MJ, Westfal RE. The normal difference in bilateral indirect blood pressure recordings in hypertensive individuals. Acad Emerg Med 2002; 9:342–345. [DOI] [PubMed] [Google Scholar]
- 324.Cassidy P, Jones K. A study of inter-arm blood pressure differences in primary care. J Hum Hypertens 2001; 15:519–522. [DOI] [PubMed] [Google Scholar]
- 325.Fotherby MD, Panayiotou B, Potter JF. Age-related differences in simultaneous interarm blood pressure measurements. Postgrad Med J 1993; 69:194–196. [DOI] [PMC free article] [PubMed] [Google Scholar]
- 326.Cavallini MC, Roman MJ, Blank SG, Pini R, Pickering TG, Devereux RB. Association of the auscultatory gap with vascular disease in hypertensive patients. Ann Intern Med 1996; 124:877–883. [DOI] [PubMed] [Google Scholar]
- 327.Askey JM. The auscultatory gap in sphygmomanometry. Ann Intern Med 1974; 80:94–97. [DOI] [PubMed] [Google Scholar]
- 328.Song S, Lee J, Chee Y, Jang DP, Kim IY. Does the accuracy of blood pressure measurement correlate with hearing loss of the observer? Blood Press Monit 2014; 19:14–18. [DOI] [PubMed] [Google Scholar]
- 329.Allen J, Gehrke T, O'Sullivan JJ, King ST, Murray A. Characterization of the Korotkoff sounds using joint time-frequency analysis. Physiol Meas 2004; 25:107–117. [DOI] [PubMed] [Google Scholar]
- 330.Stenklev NC, Laukli E. Presbyacusis-hearing thresholds and the ISO 7029. Int J Audiol 2004; 43:295–306. [DOI] [PubMed] [Google Scholar]
- 331.International Organization of Standardization. Acoustics – statistical distribution of hearing thresholds as a function of age. ISO 7029. 2000; Geneva: ISO, Available from: https://bsol.bsigroup.com/en/Bsol-Item-Detail-Page/?pid=000000000030025821. [cited 5 Nov 2015; Internet]. [Google Scholar]
- 332.Walker SP, Higgins JR, Brennecke SP. The diastolic debate: is it time to discard Korotkoff phase IV in favour of phase V for blood pressure measurements in pregnancy? Med J 1998; 169:203–205. [DOI] [PubMed] [Google Scholar]
- 333.Londe S. Fifth versus fourth Korotkoff phase. Pediatrics 1985; 76:460–461. [PubMed] [Google Scholar]
- 334.Villar J, Repke J, Markush L, Calvert W, Rhoads G. The measuring of blood pressure during pregnancy. Am J Obstet Gynecol 1989; 161:1019–1024. [DOI] [PubMed] [Google Scholar]
- 335.Folsom AR, Prineas RJ, Jacobs DR, Luepker RV, Gillum RF. Measured differences between fourth and fifth phase diastolic blood pressures in 4885 adults: implications for blood pressure surveys. Int J Epidemiol 1984; 13:436–441. [DOI] [PubMed] [Google Scholar]
- 336.Wang Y, Wang Y, Qain Y, Zhang J, Tang X, Sun J, et al. Longitudinal change in end-digit preference in blood pressure recordings of patients with hypertension in primary care clinics: Minhang study. Blood Press Monit 2015; 20:74–78. [DOI] [PubMed] [Google Scholar]
- 337.Odili AN, Ameh VO, Ogedengbe JO, Staessen JA. Quality of blood pressure phenotype in the Nigerian Population Research on Environment Gene and Health. Blood Press Monit 2014; 19:220–225. [DOI] [PubMed] [Google Scholar]
- 338.Ayodele OE, Sanya EO, Okunola OO, Akintunde AA. End digit preference in blood pressure measurement in a hypertension specialty clinic in southwest Nigeria. Cardiovasc J Afr 2012; 23:85–89. [DOI] [PMC free article] [PubMed] [Google Scholar]
- 339.Cienki JJ, DeLuca LA. Agreement between emergency medical services and expert blood pressure measurements. J Emerg Med 2012; 43:64–68. [DOI] [PubMed] [Google Scholar]
- 340.Jie G, Jian W, Qiaowen H, Shanzhu Z. Investigation of end-digit preference in blood pressure records of hospitalized Chinese patients and analysis of risk factors. Postgrad Med 2012; 124:53–57. [DOI] [PubMed] [Google Scholar]
- 341.Lebeau J-P, Pouchain D, Huas D, Wilmart F, Dibao-Dina C, Boutitie F. ESCAPE-ancillary blood pressure measurement study: end-digit preference in blood pressure measurement within a cluster-randomized trial. Blood Press Monit 2011; 16:74–79. [DOI] [PubMed] [Google Scholar]
- 342.Mengden T, Asmar R, Kandra A, Di Giovanni R, Brudi P, Parati G. Use of automated blood pressure measurements in clinical trials and registration studies: data from the VALTOP Study. Blood Press Monit 2010; 15:188–194. [DOI] [PubMed] [Google Scholar]
- 343.Burnier M, Gasser UE. End-digit preference in general practice: a comparison of the conventional auscultatory and electronic oscillometric methods. Blood Press 2008; 17:104–109. [DOI] [PubMed] [Google Scholar]
- 344.Harrison WN, Lancashire RJ, Marshall TP. Variation in recorded blood pressure terminal digit bias in general practice. J Hum Hypertens 2008; 22:163–167. [DOI] [PubMed] [Google Scholar]
- 345.Lyratzopoulos G, Heller RF, Hanily M, Lewis PS. Risk factor measurement quality in primary care routine data was variable but nondifferential between individuals. J Clin Epidemiol 2008; 61:261–267. [DOI] [PubMed] [Google Scholar]
- 346.Niyonsenga T, Vanasse A, Courteau J, Cloutier L. Impact of terminal digit preference by family physicians and sphygmomanometer calibration errors on blood pressure value: implication for hypertension screening. J Clin Hypertens 2008; 10:341–347. [DOI] [PMC free article] [PubMed] [Google Scholar]
- 347.Broad J, Wells S, Marshall R, Jackson R. Zero end-digit preference in recorded blood pressure and its impact on classification of patients for pharmacologic management in primary care – PREDICT-CVD-6. Br J Gen Pract 2007; 57:897–903. [DOI] [PMC free article] [PubMed] [Google Scholar]
- 348.Dickson BK, Hajjar I. Blood Pressure Measurement Education and Evaluation Program improves measurement accuracy in community-based nurses: a pilot study. J Am Acad Nurse Pract 2007; 19:93–102. [DOI] [PubMed] [Google Scholar]
- 349.Kim ESH, Samuels TA, Yeh H-C, Abuid M, Marinopoulos SS, McCauley JM, et al. End-digit preference and the quality of blood pressure monitoring in diabetic adults. Diabetes Care 2007; 30:1959–1963. [DOI] [PubMed] [Google Scholar]
- 350.Roubsanthisuk W, Wongsurin U, Saravich S, Buranakitjaroen P. Blood pressure determination by traditionally trained personnel is less reliable and tends to underestimate the severity of moderate to severe hypertension. Blood Press Monit 2007; 12:61–68. [DOI] [PubMed] [Google Scholar]
- 351.Graves JW, Bailey KR, Grossardt BR, Gullerud RE, Meverden RA, Grill DE, et al. The impact of observer and patient factors on the occurrence of digit preference for zero in blood pressure measurement in a hypertension specialty clinic: evidence for the need of continued observation. Am J Hypertens 2006; 19:567–572. [DOI] [PubMed] [Google Scholar]
- 352.Nietert PJ, Wessell AM, Feifer C, Ornstein SM. Effect of terminal digit preference on blood pressure measurement and treatment in primary care. Am J Hypertens 2006; 19:147–152. [DOI] [PubMed] [Google Scholar]
- 353.de Lusignan S, Belsey J, Hague N, Dzregah B. End-digit preference in blood pressure recordings of patients with ischaemic heart disease in primary care. J Hum Hypertens 2004; 18:261–265. [DOI] [PubMed] [Google Scholar]
- 354.McManus RJ, Mant J, Hull MRP, Hobbs FDR. Does changing from mercury to electronic blood pressure measurement influence recorded blood pressure? An observational study. Br J Gen Pract 2003; 53:953–956. [PMC free article] [PubMed] [Google Scholar]
- 355.Ostchega Y, Prineas RJ, Paulose-Ram R, Grim CM, Willard G, Collins D. National Health and Nutrition Examination Survey 1999–2000: effect of observer training and protocol standardization on reducing blood pressure measurement error. J Clin Epidemiol 2003; 56:768–774. [DOI] [PubMed] [Google Scholar]
- 356.Thavarajah S, White WB, Mansoor GA. Terminal digit bias in a specialty hypertension faculty practice. J Hum Hypertens 2003; 17:819–822. [DOI] [PubMed] [Google Scholar]
- 357.Ali S, Rouse A. Practice audits: reliability of sphygmomanometers and blood pressure recording bias. J Hum Hypertens 2002; 16:359–361. [DOI] [PubMed] [Google Scholar]
- 358.Wingfield D, Freeman GK, Bulpitt CJ. General Practice Hypertension Study Group (GPHSG). Selective recording in blood pressure readings may increase subsequent mortality. QJM 2002; 95:571–577. [DOI] [PubMed] [Google Scholar]
- 359.Wingfield D, Cooke J, Thijs L, Staessen JA, Fletcher AE, Fagard R, et al. Terminal digit preference and single-number preference in the Syst-Eur trial: influence of quality control. Blood Press Monit 2002; 7:169–177. [DOI] [PubMed] [Google Scholar]
- 360.Ataman SL, Cooper R, Rotimi C, McGee D, Osotimehin B, Kadiri S, et al. Standardization of blood pressure measurement in an international comparative study. J Clin Epidemiol 1996; 49:869–877. [DOI] [PubMed] [Google Scholar]
- 361.Torrance C, Serginson E. An observational study of student nurses’ measurement of arterial blood pressure by sphygmomanometry and auscultation. Nurse Educ Today 1996; 16:282–286. [DOI] [PubMed] [Google Scholar]
- 362.Wen SW, Kramer MS, Hoey J, Hanley JA, Usher RH. Terminal digit preference, random error, and bias in routine clinical measurement of blood pressure. J Clin Epidemiol 1993; 46:1187–1193. [DOI] [PubMed] [Google Scholar]
- 363.Stoneking HT, Hla KM, Samsa GP, Feussner JR. Blood pressure measurements in the nursing home: are they accurate? Gerontologist 1992; 32:536–540. [DOI] [PubMed] [Google Scholar]
- 364.Hessel PA. Terminal digit preference in blood pressure measurements: effects on epidemiological associations. Int J Epidemiol 1986; 15:122–125. [DOI] [PubMed] [Google Scholar]
- 365.Hla KM, Vokaty KA, Feussner JR. Observer error in systolic blood pressure measurement in the elderly. A case for automatic recorders? Arch Intern Med 1986; 146:2373–2376. [PubMed] [Google Scholar]
- 366.Patterson HR. Sources of error in recording the blood pressure of patients with hypertension in general practice. BMJ Clin Res Ed 1984; 289:1661–1664. [DOI] [PMC free article] [PubMed] [Google Scholar]
- 367.Neufeld PD, Johnson DL. Observer error in blood pressure measurement. Can Med Assoc J 1986; 135:633–637. [PMC free article] [PubMed] [Google Scholar]
- 368.Gao H, McDonnell A, Harrison D, Moore T, Adam S, Daly K, et al. Systematic review and evaluation of physiological track and trigger warning systems for identifying at-risk patients on the ward. Intensive Care Med 2007; 33:667–679. [DOI] [PubMed] [Google Scholar]
- 369.Smith GB, Prytherch DR, Schmidt PE, Featherstone PI. Review and performance evaluation of aggregate weighted ‘track and trigger’ systems. Resuscitation 2008; 77:170–179. [DOI] [PubMed] [Google Scholar]
- 370.Christofidis MJ, Hill A, Horswill MS, Watson MO. Observation chart design features affect the detection of patient deterioration: a systematic experimental evaluation. J Adv Nurs 2016; 72:158–172. [DOI] [PubMed] [Google Scholar]
- 371.Dellinger RP, Levy MM, Rhodes A, Annane D, Gerlach H, Opal SM, et al. Surviving sepsis campaign: international guidelines for management of severe sepsis and septic shock: 2012. Crit Care Med 2013; 41:580. [DOI] [PubMed] [Google Scholar]
- 372.Sevransky JE, Nour S, Susla GM, Needham DM, Hollenberg S, Pronovost P. Hemodynamic goals in randomized clinical trials in patients with sepsis: a systematic review of the literature. Crit Care 2007; 11:R67. [DOI] [PMC free article] [PubMed] [Google Scholar]
Associated Data
This section collects any data citations, data availability statements, or supplementary materials included in this article.