. 2017 Jan 30;6:e19720. doi: 10.7554/eLife.19720

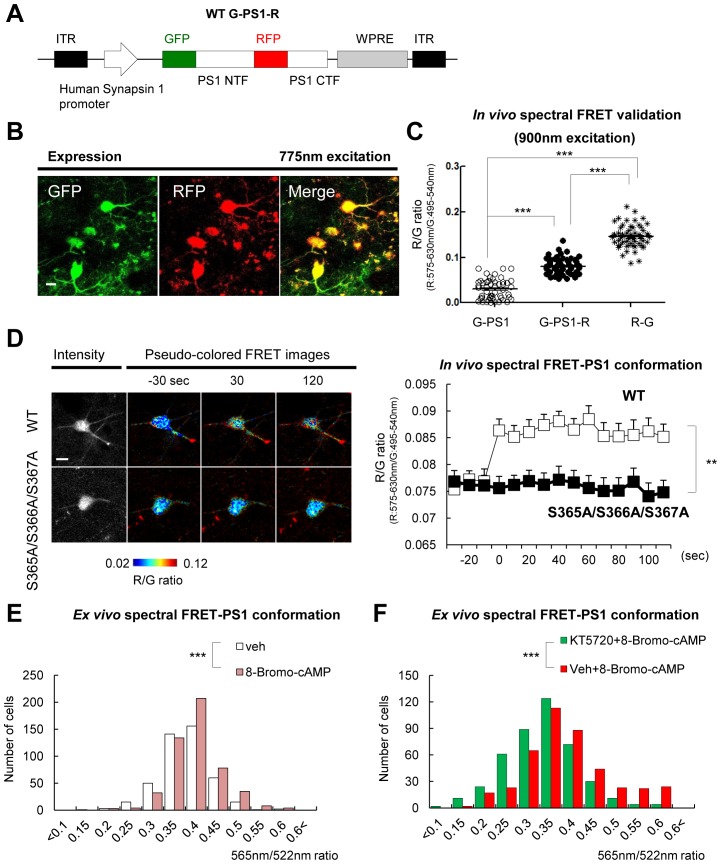
Figure 4. Ca2+ triggers the PS1/γ-secretase pathogenic conformation via PS1 phosphorylation in vivo.

(A) Schematic representation of the pAAV8-hSyn1-WT G-PS1-R construct. (B) Two-photon image of the WT G-PS1-R expression in the somatosensory cortex of WT mouse. Laser at 775 nm wavelength was used for the excitation. A scale bar indicates 10 µm. (C) Mice were injected with AAV8-hSyn1-G-PS1 (as a negative control of FRET), AAV8-hSyn1-WT G-PS1-R or AAV8-hSyn1-R-G (as a positive control of FRET). GFP was excited at 900 nm wavelength, and the R/G ratio was recorded (n = 50–60 cells, n = 3–6 mice). Mean ± SEM, ***p<0.001, one-way factorial ANOVA. (D) Spectral FRET analysis of the PS1 conformation in vivo. Mice were injected with AAV8-hSyn1-WT G-PS1-R (n = 3) or AAV8-hSyn1-S365A/S366A/S367A G-PS1-R (n = 4), and 300 mM KCl was applied topically. The R/G ratio in vivo was monitored after two-photon excitation at 900 nm (total n = 20–28 cells per condition) for the duration of 2 min. Representative images of the pseudo-colored neurons are shown (additional time traces/images are shown in Figure 4—figure supplement 3). Mean ± SEM, **p<0.01, two-way repeated-measures ANOVA. (E) Ex-vivo spectral FRET analysis of the endogenous PS1 conformation in mouse brain sections. Mice were injected with 100 mM 8-Bromo-cAMP (right hemisphere) or vehicle (left hemisphere) into the somatosensory cortex. The 565 nm/522 nm ratio was calculated in individual neurons as readout of the FRET efficiency that reflects the relative proximity of the PS1 NT (A488) to PS1 CT (Cy3). The histogram shows cell numbers plotted against the 565 nm/522 nm ratios. n = 3 mice, total of 444 (vehicle) and 505 (8 Bromo-cAMP) neurons. ***p<0.001, Student’s t-test. (F) Ex-vivo spectral FRET analysis of the endogenous PS1 conformation in mouse brain sections. Mice were pre-injected with 100 µM KT5720 (right hemisphere) or vehicle (left hemisphere) into the somatosensory cortex. 75 min post-injection, 100 mM 8-Bromo-cAMP (both hemispheres) was delivered to the same area for 5 min. The histogram shows cell numbers plotted against the 565 nm/522 nm ratios. n = 3 mice, total 423 (vehicle) and 436 (KT5720) neurons analysed. ***p<0.001, Student’s t-test.

DOI: http://dx.doi.org/10.7554/eLife.19720.011

Figure 4.

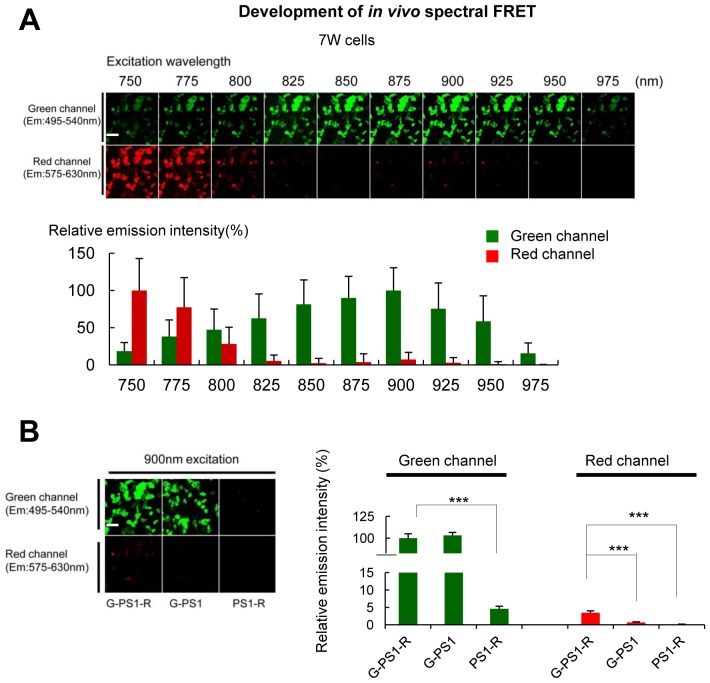
Figure 4—figure supplement 1. Establishment of the two-photon spectral FRET settings for monitoring PS1 conformation.

Figure 4—figure supplement 1.

(A) 7 W cells expressing G-PS1-R were excited by different wavelength laser from 750 nm to 975 nm in 25 nm steps. The top panel shows representative images of the emission intensities in green and red channel (n = 41). A scale bar indicates 20 µm. The graph shows quantitative analysis of the relative emission intensities, with the intensity at 900 nm (green channel) and 750 nm (red) as 100%. Mean ± SEM. (B) 7 W cells expressing G-PS1-R, G-PS1 or PS1-R were excited by 900 nm laser. Left panel shows the representative images of relative emission intensities in green or red channel. A scale bar indicates 20 µm. The intensity of G-PS1-R in green channel was set as 100% (n = 36 each). Mean ± SEM, ***p<0.001, one-way factorial ANOVA.
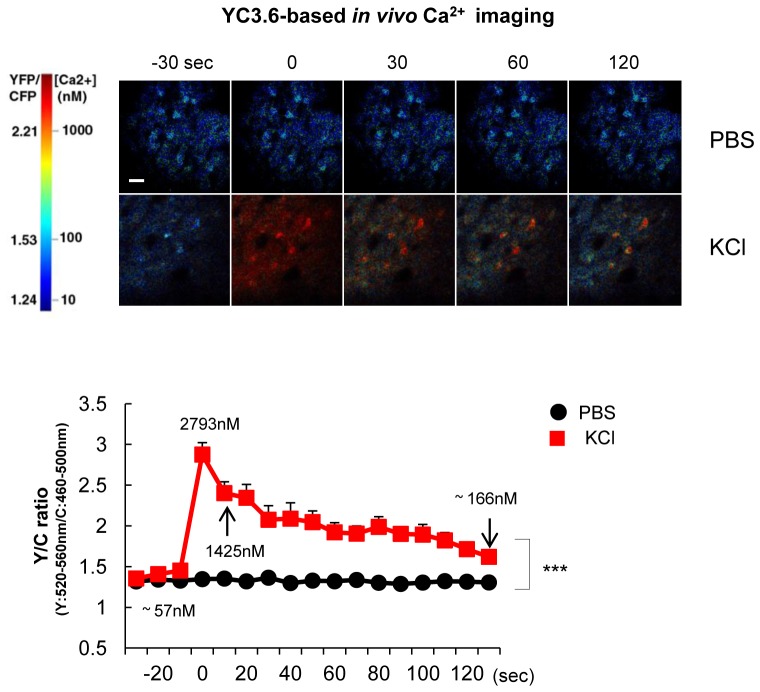
Figure 4—figure supplement 2. YC3.6-based Ca2+ imaging in vivo after KCl application.

Figure 4—figure supplement 2.

300 mM KCl or vehicle (PBS) was topically applied under the cranial window to mice expressing YC3.6. The YFP/CFP ratio was measured in neurons of the somatosensory cortex in vivo (n = 18–22 cells, three different mice for each group). Representative pseudo-colored images were shown in the top panels. Mean ± SEM, ***p<0.001, two-way repeated-measures ANOVA.
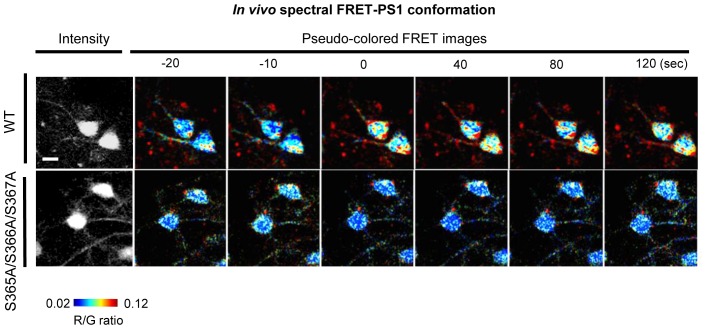
Figure 4—figure supplement 3. Spectral FRRT assay of PS1 conformation in vivo.

Figure 4—figure supplement 3.

Additional time traces and pseudo-coloured images of the neurons in vivo showing changes in PS1 conformation. A scale bar indicates 10 µm.
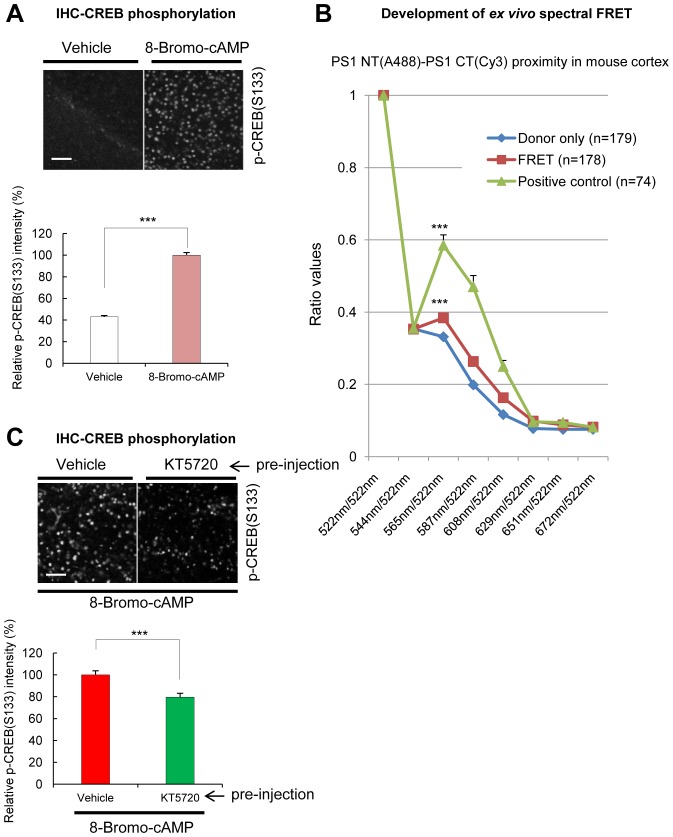
Figure 4—figure supplement 4. Spectral FRET assay for monitoring endogenous PS1 conformation in mouse brain sections.

Figure 4—figure supplement 4.

(A) Immunohistochemical detection of the phosphorylated CREB in mouse brain injected with 100 mM 8-Bromo-cAMP (right hemisphere) or vehicle (left hemisphere). The brain sections were immunostained with a p-CREB S133 antibody. Strong fluorescence in cAMP injected hemisphere shows PKA activation. A scale bar indicates 50 µm. Mean ± SEM, ***p<0.001, Student’s t-test. (B) Antibody-based spectral FRET validation. The brain sections were immunostained with PS1 NT-A488 (donor only, negative control for FRET), PS1 NT-A488-Cy3 (A488-Goat-anti-mouse IgG was detected with Cy3-Donkey-anti-goat IgG, positive control), or PS1 NT-A488/PS1 CT-Cy3 (FRET, PS1 NT-PS1 CT proximity) antibodies. The Y axis shows the ratio of fluorescence intensities within the 522 nm to 672 nm spectral range normalized by the emission intensity at 522 nm. The positive control (in green) shows large ‘hump’ at 565/522 nm, and the FRET signal in PS1 NT-PS1 CT stained cells (in red) shows smaller but significant increase in the 565 nm/522 nm ratio compared to the donor only (n = 75–179 cells). Mean ± SEM, ***p<0.001 vs. Donor only, one-way factorial ANOVA. (C) Immunohistochemical detection of the phosphorylated CREB S133 in mouse brain injected with 100 µM KT5720 (right hemisphere) or vehicle (left hemisphere), followed by the injection of 100 mM 8-Bromo-cAMP (both hemispheres). A scale bar indicates 50 µm. Mean ± SEM, ***p<0.001, Student’s t-test.