. 2017 Jan 30;6:e19720. doi: 10.7554/eLife.19720

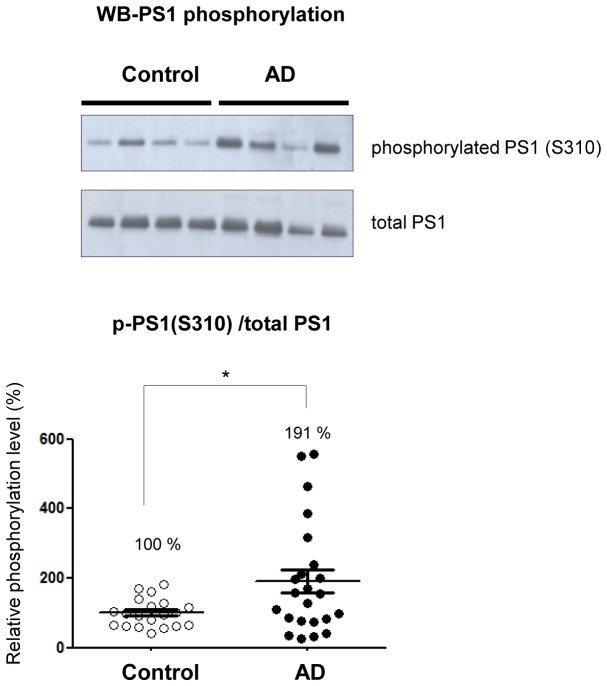
Figure 5. Phosphorylated PS1 level is increased in AD brains.

Western blot analysis of PS1 phosphorylated at S310 in 20 control brains and 23 AD brains. The level of PS1 S310 phosphorylation (phospho-PS1/total PS1) in AD brains is normalized to that in the control brains. Mean ± SEM, *p<0.05, Student’s t-test.

DOI: http://dx.doi.org/10.7554/eLife.19720.017

Figure 5.

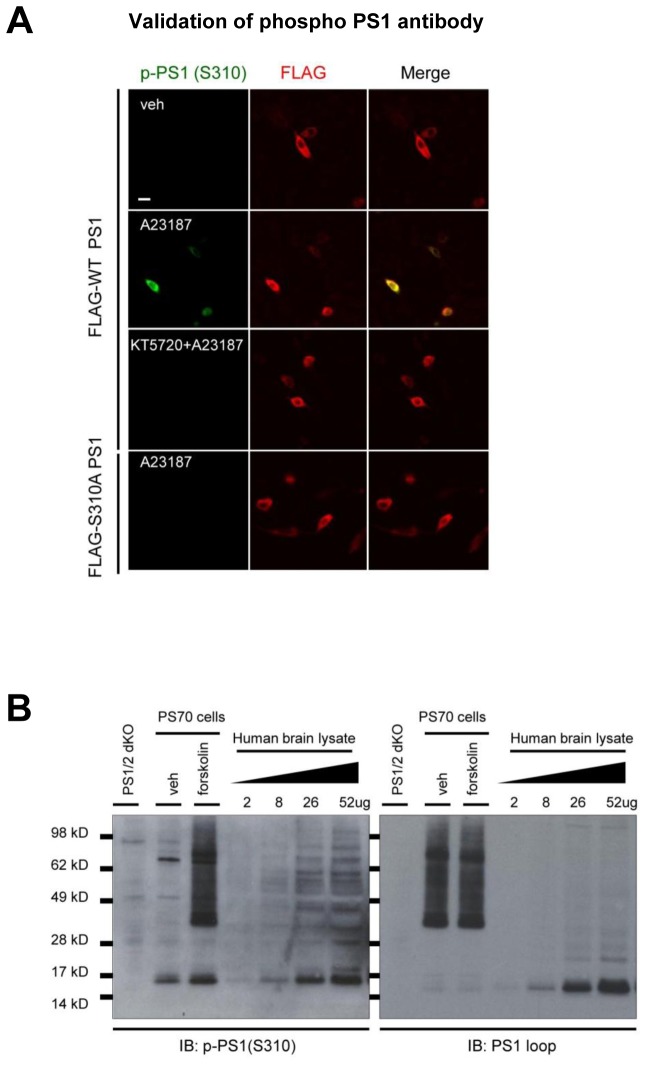
Figure 5—figure supplement 1. Validation of the PKA-mediated PS1 phosphorylation at S310.

Figure 5—figure supplement 1.

(A) Confocal microscope images of the 7 W cells immunostained with anti-phosphorylated PS1 at S310 (green) or anti-FLAG antibodies (red). 7 W cells transfected with FLAG-WT PS1 or FLAG-S310A PS1 were pre-treated with 1 µM KT5720 or vehicle control for 16 hr, followed by the treatment of 5 µM A23187 or vehicle control for 15 min. A scale bar indicates 20 µm. (B) The level of phosphorylated PS1 at S310 was compared between forskolin and vehicle-treated PS70 cells by Western blotting. PS1/2 dKO MEF cells were used as a negative control. The level of phosphorylated PS1 at S310 was measured in the AD brain sample loaded at different total protein concentration.
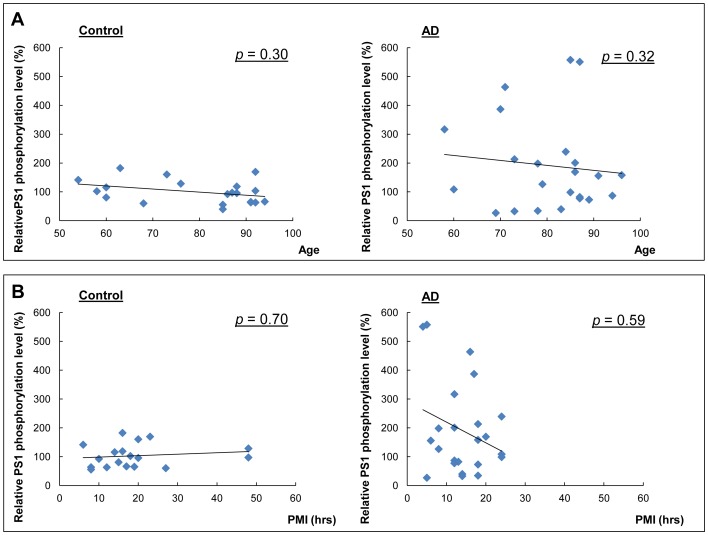
Figure 5—figure supplement 2. Correlation between the relative phosphorylation level of PS1 and age, or PMI.

Figure 5—figure supplement 2.

Correlation analysis of phosphorylation of PS1 at S310 with age in control and AD brains (A), or with post mortem interval (PMI) (B). Spearman's nonparametric correlation analysis.