Abstract
It is well known that a PET detector capable of measuring both photon time-of-flight (TOF) and depth-of-interaction (DOI) improves the image quality and accuracy. Phoswich designs have been realized in PET detectors to measure DOI for more than a decade. However, PET detectors based on phoswich designs put great demand on the readout circuits, which have to differentiate the pulse shape produced by different crystal layers. A simple pulse shape discrimination approach is required to realize the phoswich designs in a clinical PET scanner, which consists of thousands of scintillation crystal elements. In this work, we studied time-over-threshold (ToT) as a pulse shape parameter for DOI. The energy, timing and DOI performance were evaluated for a phoswich detector design comprising 3 mm × 3 mm × 10 mm LYSO:Ce crystal optically coupled to 3 mm × 3 mm × 10 mm calcium co-doped LSO:Ce,Ca(0.4%) crystal read out by a silicon photomultiplier (SiPM). A DOI accuracy of 97.2% has been achieved for photopeak events using the proposed time-over-threshold (ToT) processing. The energy resolution without correction for SiPM non-linearity was 9.7 ± 0.2% and 11.3 ± 0.2% FWHM at 511 keV for LYSO and LSO crystal layers, respectively. The coincidence time resolution for photopeak events ranges from 164.6 ps to 183.1 ps FWHM, depending on the layer combinations. The coincidence time resolution for inter-crystal scatter events ranges from 214.6 ps to 418.3 ps FWHM, depending on the energy windows applied. These results show great promises of using ToT for pulse shape discrimination in a TOF phoswich detector since a ToT measurement can be easily implemented in readout electronics.
1. Introduction
It has been shown that measuring both time-of-flight (TOF) and depth-of-interaction (DOI) in a clinical PET scanner improve the image quality and accuracy (Surti et al. 2013, Thoen et al. 2013). Phoswich designs have been used for more than a decade in PET detectors to measure DOI (Carrier et al. 1988, Casey et al. 1997, Saoudi et al. 1999). In a typical phoswich detector, two or more scintillator crystals with different physical properties such as decay time or light yield are stacked. DOI is achieved by discriminating the pulse shape produced by different crystal layers in the readout electronics.
Conventional phoswich detectors usually use PMT (photomultiplier tube) or PS-PMT (position-sensitive PMT) as photodetectors (Schmand et al. 1998, Yamamoto & Ishibashi 1998, Seidel et al. 1999, Schmand et al. 1999). The crystal pixel pitch is typically made much smaller than the active area of PMTs to achieve high spatial resolution. Therefore, some form of light sharing (between multiple PMTs) or charge sharing (in PS-PMTs) are needed for crystal identification with Anger logic. This light or charge sharing process degrades the detector signal-to-noise ratio (SNR). Moreover, in these previous DOI detector designs, inter-crystal scattered events are often discarded by energy windowing or incorrectly positioned by Anger logic.
Recent development of silicon photomultipliers (SiPM) enables extraordinary timing performance that is capable of TOF measurement (Cates & Levin 2016, Nemallapudi et al. 2015). It has been shown in a recent study using stacked crystal design that SiPMs outperformed PMTs in coincidence time resolution (Schmall et al. 2015). SiPMs are also compact in size compared to PMTs, which allows one-to-one coupling between the crystal elements and SiPM pixels. This one-to-one coupling preserves the SNR as well as the energy and position information required to recover inter-crystal scattered events, which will further improve image quality and accuracy since a majority of incoming 511 keV photon events undergo inter-crystal scatter. However, a clinical PET scanner typically requires thousands of crystal elements and SiPM pixels to achieve adequate spatial resolution, sensitivity and field-of-view. Reading out these photodetectors individually is challenging, especially for a phoswich design as the pulse shape information has to be captured in the readout electronics.
Several pulse shape discrimination approaches have been proposed and studied in previous work. A conceptually straightforward approach is to sample the entire waveform and extract the pulse shape in post-analyses (Fontaine et al. 2006, Roncali et al. 2012, Schmall et al. 2015). This is challenging in practice since very high sampling rate is required to sample the fast rising signal (rise time < 10 ns) produced by the bright scintillation crystals coupled to modern SiPMs. This often leads to prohibitively high power consumption and cost when one tries to implement this approach for thoudsands of channels in a clinical PET scanner. One practical implementation to achieve this waveform-sampling electronics is to use switched-capacitor-array ASICs (application-specific integrated circuit) such as the Domino Ring Sampler (DRS4) (Ashmanskas et al. 2014). However, careful design of the readout electronics is required to avoid loss of events due to the deadtime of the chip. Other pulse shape discrimination approaches that do not require waveform-sampling include comparing the zero-cross time of constant-fraction-discriminator (CFD) (Yamamoto & Ishibashi 1998, Dahlbom et al. 1997, Saoudi et al. 1999) and comparing the charge ratio with double charge integration (Seidel et al. 1999, Seiichi et al. 2010, Berg et al. 2016). Although a PMT-based clinical PET scanner has been developed based on the CFD approach mentioned above (Wienhard et al. 2002), it is in general challenging to scale up to thousands of channels required for a SiPM-based system with these approaches due to their relatively complicated electronics.
Time-over-threshold (ToT) as an alternative readout approach is attractive since it can be easily implemented with a few electronic components and gives essentially digital output signals (Grant & Levin 2014). Due to its simplicity, ToT has been implemented in several ASICs for TOF-PET applications (Rolo et al. 2013, Sacco et al. 2013, Fleury et al. 2014, Stankova et al. 2015). Therefore, it is in principle more practical to scale up to a clinical PET scanner.
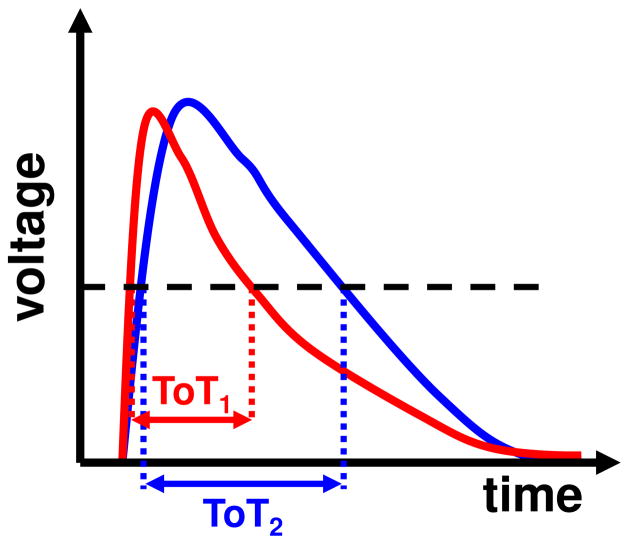
In this paper, we present the results of using ToT for pulse shape discrimination in a SiPM-based TOF-PET phoswich detector. The idea is illustrated in figure 1, in which the pulse shape difference is captured by the different ToT values obtained with a single discriminator. The energy and timing performance achieved by this detector design are also presented and discussed.
Figure 1.
Illustration of time-over-threshold (ToT) for pulse shape discrimination.
2. Materials and Methods
2.1. Phoswich detector
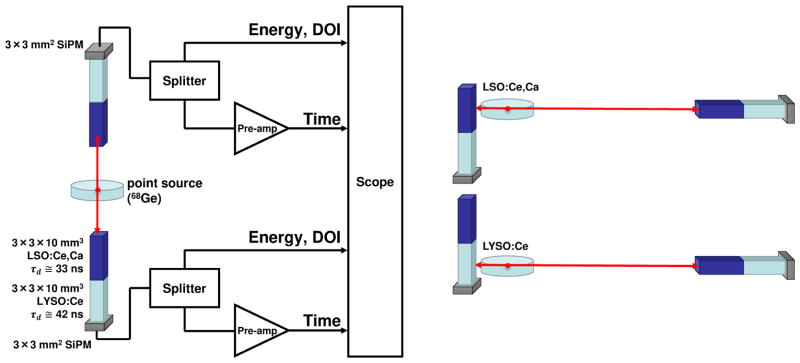
The phoswich detector unit used in this study comprises a 3 mm × 3 mm × 10 mm LYSO:Ce crystal optically coupled to a 3 mm × 3 mm × 10 mm calcium co-doped LSO:Ce,Ca(0.4%) crystal (figure 2). The surfaces of both crystals were mechanically polished. The decay time of the LYSO crystal is 42 ns and the decay time of the LSO crystal is 33 ns (Spurrier et al. 2008). The lateral surfaces of the bonded crystal were wrapped with an enhanced specular reflector (ESR, 3M) with air gaps in between and further wrapped in several layers of Teflon tape. The bottom (3 mm × 3 mm) surface of the LYSO crystal was coupled to a 3 mm × 3 mm SiPM (Hamamatsu S13360-3050) with BC-630 silicone optical grease (Saint-Gobain Crystals) and the top surface of the LSO crystal was wrapped in Teflon tape in all measurements and configurations.
Figure 2.
Experimental setup for acquiring coincidence events with two phoswich detectors in end-on (left) or side-on (right) irradiation.
2.2. Detector readout and signal acquisition
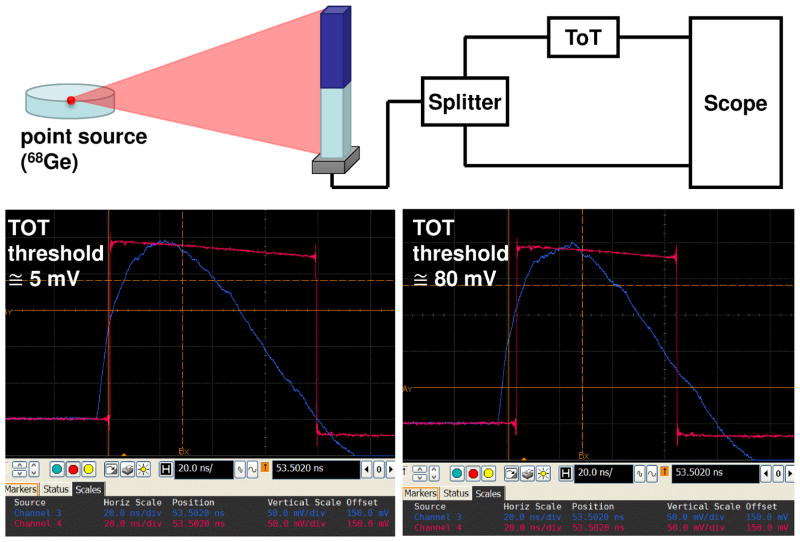
The bias and readout circuit for the SiPM has been described in detail in our previous work (Yeom et al. 2013, Cates et al. 2015). Throughout this study, the SiPMs were biased at 4.8 V above their nominated breakdown voltage provided by the vendor. All experiments were performed at room temperature. Coincidence events were collected in both end-on and side-on irradiation. In the end-on irradiation (figure 2, left), 511 keV photons from the 1 mm-diameter positron emitting point source (68Ge) entered the top surfaces of the LSO crystals in both phoswich detectors. In the side-on irradiation (figure 2, right), the detectors were collimated to only acquire events with 511 keV photons hitting the central portion of either LYSO or LSO crystal layer at one time. In the side-on configuration, the estimated width of the electronically collimated fan-beam from the 1-mm point source was 2.2 mm based on the geometry of the experimental setup. In both end-on and side-on experiments, the signals from the SiPM were split (Mini-Circuits ZX10R-14-S+) into two channels. The signals in one channel were directly acquired and digitized by an oscilloscope (Agilent DSO90254A) at 20 GSa s−1 to acquire energy and DOI information. The signals in the other channel were amplified (Mini-Circuits ZX60-4016E-S+) before digitization to acquire timing information. To further test the feasibility of using ToT for pulse shape discrimination in a scaled up system that has thousands of ToT channels, we used a ToT circuit previously developed (Grant & Levin 2014) to read out the SiPM signals (figure 3, top). The ToT circuit consists of a comparator with an adjustable threshold voltage (figure 3, bottom). In this experiment, 20,000 singles were collected by flooding the phoswich detector with the same 68Ge point source from the side. We also performed a side-on experiment using the same ToT readout circuit as a gold standard to compare regarding accuracy of layer separation possible with the side-flooded geometry.
Figure 3.
(Top) Schematics of the detector readout with a ToT circuit. The ToT circuit includes a comparator with an adjustable threshold voltage. (Bottom) Oscilloscope screenshots of the acquired waveform from the output of the SiPM readout and the ToT board with two different threshold settings: 5 mV (left) and 80 mV (right).
2.3. Data analysis
The digitized waveforms acquired by the scope were analyzed in Matlab throughout this study.
2.3.1. Energy spectra and resolution
Energy was measured by amplitude, not ToT as in other ToT papers (Grant & Levin 2014, Stankova et al. 2015). The additional amplitude information provides a means to estimate the DOI for inter-crystal scatter events, which will be described in a later section. In addition, both pulse amplitude and ToT measurements can be easily implemented in scalable readout electronics. The energy (pulse amplitude) spectra acquired in this study were not corrected for SiPM non-linearity. The histograms of pulse amplitude of the coincidence events acquired by one phoswich detector in both end-on and side-on irradiation were plotted. For the coincidence events acquired in end-on irradiation, photopeak events from both crystals were selected by applying a lower threshold (0.22 V) to the pulse amplitude histogram (figure 4, left). This threshold was determined by a Gaussian fit to the photopeak events from irradiating the LSO layer in the side-on experiment (figure 4, center). The selected photopeak events were then used to plot the DOI spectra as mentioned in the next section. To acquire the energy spectrum, each event was assigned to either LYSO or LSO layer based on its ToT value. The layer-deconvloved photopeaks were plotted and fit with Gaussian functions. The energy resolution without correction for SiPM non-linearity at 511-keV photopeaks for each layer were reported as the FWHMs (full-width-at-half-maximum) of the fit curves.
Figure 4.

Energy spectra of one phoswich detector in end-on (left) and side-on (center) irradiation. The dash line in the figures indicates the energy threshold (0.22 V) for selecting events in the photopeaks. (Right) Layer-deconvolved energy spectrum for photopeak events acquired in end-on irradiation. Each event was assigned to either LYSO or LSO layer based on its ToT value (figure 5, left).
2.3.2. DOI spectra
We compared the DOI accuracy achieved by three approaches: (1) ToT, (2) pulse-integral and (3) zero-cross time of CFD. In ToT analyses, the threshold voltage was swept to find the optimal threshold voltage that maximized the layer separation in the ToT spectrum. In pulse-integral analyses, the area under the digitized pulse was calculated to plot the pulse-integral spectra. Zero-cross time analysis was done by simulating the analog CFDs readouts described in (Casey et al. 1997). The signal on the start side was shaped by 10 ns of integration and 20 ns of differentiation. The time stamp of the start signal was then derived from a CFD with 2 ns delay. The signal on the stop side was shaped by 100 ns of integration and 200 ns of differentiation. The delay of the CFD on the stop side was varied to find the optimal delay that maximized the layer separation in the zero-cross spectrum. We fit two Gaussian functions to each DOI spectrum derived by the three approaches, respectively. The DOI accuracy was evaluated by the following equation.
| (1) |
Total area under the DOI spectrum ToT spectrum was used later on throughout this study for DOI and layer-deconvolved energy and timing analyses since it gave the best DOI accuracy among the three approaches studied here.
2.3.3. Coincidence time resolution
Timing analysis was performed using digital time-pickoff algorithms described in (Yeom et al. 2013). Coincidence time spectra acquired by two phoswich detectors were plotted for the photopeak events with and without DOI to study the effect of DOI on the timing performance. Coincidence time resolution was reported as the FWHM of the Gaussian curve fit to the coincidence time spectrum.
2.3.4. DOI and timing performance of inter-crystal scatter events
Since ToT depends on both the energy and the shape of the pulse, we plotted ToT against pulse amplitude (“phoswich diagram” hereafter) for events acquired in both end-on and side-on irradiation to further study the DOI performance of inter-crystal scatter events. To study the timing performance of the inter-crystal scatter events, coincidence time spectra were also plotted for events with partial energy deposition within three energy windows for both detectors, respectively: (1) 0.15 V ≤ pulse amplitude < 0.2 V, (2) 0.1 V ≤ pulse amplitude < 0.15 V and (3) 0.05 V ≤ pulse amplitude < 0.1 V.
3. Results
3.1. Energy spectra and resolution
Figure 4 shows the energy spectra acquired in end-on (left) and side-on (center) irradiation. The dash line in the figure indicates the threshold (0.22 V) for selecting the photopeak events for plotting the DOI spectra shown in the next section. It can be seen that the photopeaks from the LYSO and the LSO layers largely overlap with each other, hence little DOI information can be obtained from pulse amplitude alone. The right panel in figure 4 shows the layer-deconvolved energy spectrum of photopeak events acquired in end-on irradiation. Each event was assigned to either LYSO or LSO crystal based on its ToT value (figure 5, left). Most 511 keV photons interacted with the top (LSO) layer, which constitutes the larger photopeak seen in the energy spectrum. The pulse amplitude derived energy resolution without correction for SiPM non-linearity measured in side-on and end-on (after layer- deconvolution) are comparable, which are 9.7 ± 0.2% and 11.3 ± 0.2% FWHM at 511 keV for LYSO and LSO crystal layers, respectively.
Figure 5.
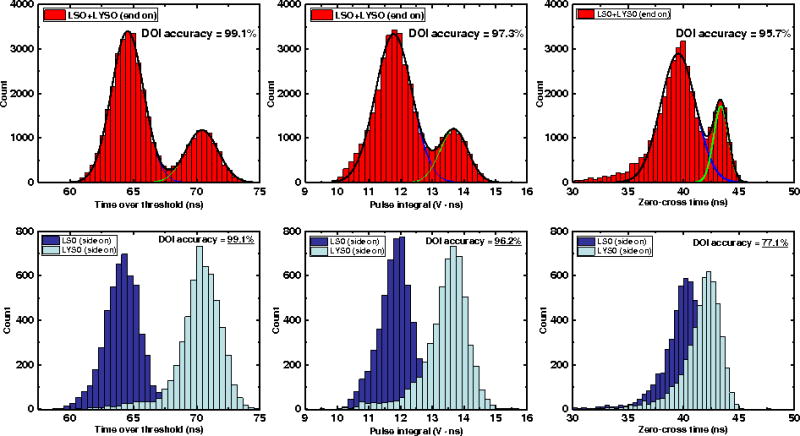
DOI spectra derived from different approaches: ToT (left), pulse-integral (center) and zero-cross time of CFD (right). The spectra in the top row were acquired in end-on irradiation and the bottom row in side-on. The DOI accuracy of each approach was calculated by equation 1.
3.2. DOI spectra and accuracy
The top row of figure 5 shows the DOI spectra and accuracy derived from the three DOI approaches described in section 2.3.2 for events acquired in end-on irradiation. While two distinct peaks can be seen in all DOI spectra, ToT offers the best DOI accuracy (99.1% separation of the peaks). The layer separation for each approach was further confirmed by the DOI spectra acquired in the side-on experiments (bottom row in figure 5).
3.3. Coincidence time spectra and resolution
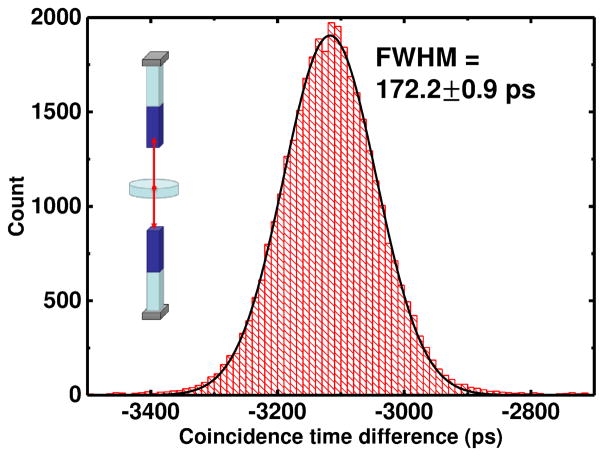
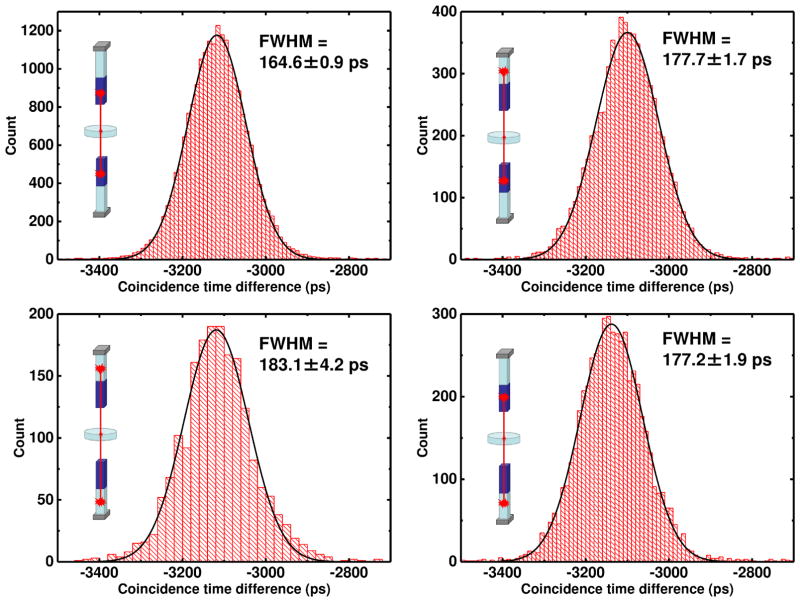
Figure 6 shows the coincidence time spectrum for all photopeak events acquired by two phoswich detectors in end-on irradiation. The coincidence time resolution is 172.2 ± 0.9 ps FWHM.
Figure 6.
Summed coincidence time spectrum for all photopeak events (pulse amplitude ≥ 0.22 V) acquired by two phoswich detectors in end-on irradiation.
Figure 7 shows the layer-deconvolved coincidence time spectra, showing the dependence of timing performance on DOI. The best timing resolution of 164.6 ± 0.9 ps FWHM is achieved when 511 keV photons interact with the LSO crystal layer in both detectors (which constitutes the majority of the events). The timing resolution is slightly worse when 511 keV photons interact with LYSO crystal layer in one (~177 ps FWHM) or both detectors (183.1 ± 4.2 ps FWHM). It should also be noted that the means of the coincidence time spectra are the same between the “LYSO against LYSO” and the “LSO against LSO” cases (left panel in figure 7). However, there is a shift of ~40 ps in the coincidence time spectra between the two “LYSO against LSO” cases (right panel in figure 7), demonstrating the importance of obtaining DOI information in correctly placing the positron annihilation position along the detected line of response.
Figure 7.
Layer-deconvolved coincidence time spectra of photopeak events. LSO against LSO (top left), LYSO against LYSO (bottom left), LYSO against LSO (top right), LSO against LYSO (bottom right). Each event was assigned to either LYSO or LSO layer based on its ToT value (figure 5, left).
3.4. DOI and timing performance of inter-crystal scatter events
Figure 8 shows the phoswich diagrams acquired in end-on (left) and side-on (right) irradiation. The dash line in the figure indicates the threshold (0.22 V) for selecting the photopeak events. The two clusters seen on the right side of the dash line correspond to the photopeaks of LYSO and LSO crystal layers, which can be separated by their ToT values alone. It is also shown in the side-on phoswich diagram that, in conjunction with pulse-amplitude, ToT provides some DOI information for the crystal-scattered events with amplitude larger than ~0.12 V.
Figure 8.
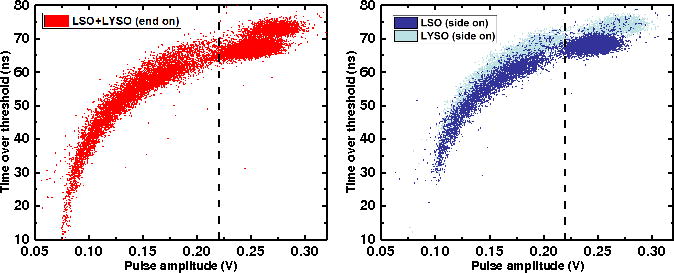
Phoswich diagrams (ToT against pulse amplitude) for a phoswich detector acquired in end-on (left) and side-on (right) irradiation.
Figure 9 shows the coincidence time spectra from the end-on experiment (figure 4, left) of events within three different energy windows: 0.15 V ≤ pulse amplitude < 0.2 V (left), 0.1 V ≤ pulse amplitude < 0.15 V (center) and 0.05 V ≤ pulse amplitude < 0.1 V (right). The corresponding coincidence time resolution are 214.6 ± 2.5 ps, 271.8 ± 4.1 ps and 418.3 ± 10.3 ps FWHM, respectively for those partial energy depositions associated with inter-crystal scatter events.
Figure 9.
Coincidence time spectra of scattered events in different energy windows.
3.5. DOI accuracy from ToT Board
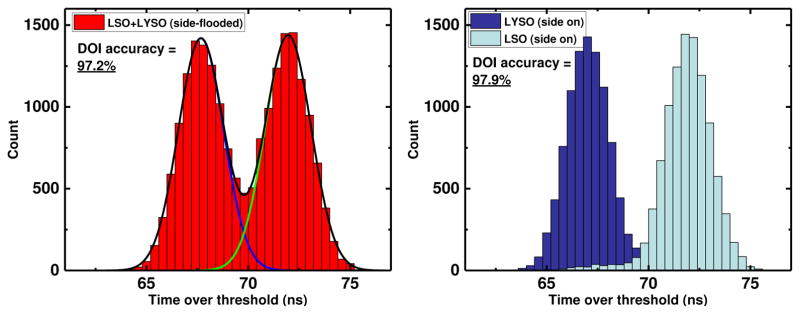
Figure 10 shows the ToT spectra acquired from the output of the ToT circuit in side-flooded (left) and side-on (right) irradiation. Two distinct peaks of the same size can be seen in the side-flooded ToT spectrum, which are further confirmed in the side-on experiment. The DOI accuracy achieved from the ToT circuit output for side-flooded and side-on irradiation are 97.2% and 97.9%, respectively, which are comparable to those acquired from the digitized pulse-based comparator (99.1% as shown in figure 5).
Figure 10.
ToT spectra from the ToT circuit output in side-flooded (left) and side-on (right) irradiation
4. Discussion
We have shown that ToT is a parameter that effectively captures the pulse shape difference of the phoswich detectors used in this study. ToT achieves excellent DOI accuracy (figure 5 and 10) for photopeak events. The ToT approach achieves comparable layer separation (97.2%) to that achieved with the side-on experiment (97.9%) which is assumed to be the gold standard. Two distinct photopeaks are observed in the end-on energy spectrum after layer-deconvolution (right panel of figure 4). The position of the layer-deconvolved photopeaks correspond well with the ones observed in the side-on energy spectra, verifying the layer separation achieved with ToT. The energy resolution without correction for SiPM non-linearity (9.7 % for LYSO and 11.3 % for LSO) achieved with the phoswich detector are comparable to recent studies also using lutetium-based crystals (Schmall et al. 2015, Cates & Levin 2016).
Several interesting observations can be made from the impact of DOI on the coincidence time spectra (figure 7). First, the timing performance is better for events interacting with the top crystal layer (LSO). It is likely due to the combined effect of faster decay time of the LSO crystal and the reduced photon transit time variance. It has been shown that the increased scintillation photon transit time variance from events interacted with the bottom portion of the crystal reduces the temporal density of the earliest arriving photons (figure 11 in (Yeom et al. 2013)). Since a leading edge discriminator, like that used here, for time pickoff acts as an effective average of the information carried by the earliest photons (Gundacker et al. 2015), this increased variance in the arrival time of the earliest photons due to the increased transit time variance produces a larger variance on this averaging estimator for time of interaction. Furthermore, the interface between the two layers only further confounds this scintillation transit time variance by increasing the likelihood that some photons could be trapped in one or both layers. Second, there is a shift of ~40 ps between the coincidence time spectra of two “LYSO against LSO” cases. This demonstrates how DOI can help position the TOF kernel in the image reconstruction. The source was kept at a fixed position in this experiment. Without the correction of DOI, a 40-ps shift of timing spectrum leads to a ~6-mm shift of the TOF kernel in image reconstruction, which can affect ToF-PET imaging performance (Spanoudaki & Levin 2011). Finally, the majority of 511 keV photons interact with the LSO layers, which shows the best timing performance among all layer combinations. For these reasons, using different TOF kernels for different layer combinations (DOI) can further enhance the benefits of TOF, and hence the image quality and accuracy.
As expected, coincidence time resolution degrades with decreasing pulse amplitude (figure 9) such as for partial energy deposition from inter-crystal scatter. However, a timing resolution capable of TOF measurement (418 ps FWHM) is still achieved for the lowest energy window studied here (100 - 200 keV, estimated from the energy spectrum shown in figure 4). This shows that TOF can also be measured for inter-crystal-scattered photons to improve image quality, provided that the detector design can accurately recover the position of these scattered photons. In practice, a calibration scan can be done to construct a look-up table of TOF kernels for different energy windows.
The phoswich diagrams in figure 8 show that, in conjunction with pulse amplitude, ToT can provide some DOI information for the inter-crystal-scattered photons. The layer separation degrades with decreasing pulse amplitude, which is likely due to low photon statistics to support the pulse shape difference and the non-linear nature of ToT.
The terminal capacitance of 320 pF of the SiPM pixel used in this study and the 50 ohm loading resistor in both the ToT circuit and the oscilloscope form a low pass filter that determines the fall time of the SiPM signal (A. Nassalski et al. 2010), which may be further optimized for pulse shape discrimination using ToT. There are two factors to be considered when optimizing the fall time of the SiPM signal for pulse shape discrimination. A longer fall time can in principle increase the ToT difference of the signals from different crystal layers, and hence the DOI accuracy. However, a longer fall time also increases the probability of pulse pileup or baseline shift due to dark counts (Bieniosek et al. 2016), which degrades the DOI accuracy achieved by ToT with a fixed threshold. The same optimization principle applies when one wants to multiplex multiple SiPM pixels to further simplify the readout electronics (Chang et al. 2015). In this case, the terminal capacitance, dark counts and probability of pulse pileup increase proportionally with the number of SiPM pixels multiplexed. The DOI accuracy achieved with ToT at a higher multiplexing ratio is beyond the scope of the current work. However, it should be noted that, based on the singles rate measured in typical clinical scanners (Surti et al. 2007, Grant et al. 2016), the probability of pulse pileup is very low in a readout circuit that exploits the benefits of one-to-one coupling between the crystal elements and SiPM pixels with individual readout channels, which is also the emphasis of this work.
Finally, we verified the results with a physical comparator circuit that can scale to thousands of channels. A DOI accuracy of 97.2% has been achieved (figure 10) for photopeak events processed by the comparator circuit, showing the promises of using ToT for pulse shape discrimination in a real system. Good energy resolution can also be achieved with a dual threshold ToT circuit (Grant & Levin 2014) or a pulse-width modulation circuit, which outputs a energy-linearized ToT pulse (Bieniosek et al. 2013), or with a dynamic threshold (Y. Tian et al. 2015). Therefore, time, energy and pulse shape information can all be encoded in ToT pulses to simplify the readout electronics. Future work will be performed to study the applicability of this novel approach at the array and detector levels. The technique proposed in this study can be found useful not only to PET DOI detector designs but also to other radiation detection applications that employ pulse-shape discrimination.
5. Conclusion
In this paper, we developed and studied the energy, timing and DOI performance of a phoswich detector design that is capable of both TOF and DOI measurements. The DOI accuracy derived from different pulse shape discrimination approaches were evaluated. ToT offered the best DOI accuracy and was used for further layer-deconvolved energy and timing analyses. Excellent crystal separation was achieved using a digitized-pulse-based comparator ToT calculation as well as a physical comparator ToT circuit appropriate for scaling up to a system comprising thousands of channels. The impact of DOI on the timing performance was studied. The DOI and timing performance of crystal scattered photons with this detector design were also evaluated. Using ToT for pulse shape discrimination in a phoswich PET detector design shows great promises since ToT measurements can be easily implemented in the readout electronics.
Acknowledgments
The authors would like to thank Hamamatsu Photonics for providing the SiPMs used in this study. This work was funded in part by a NIH-NIBIB Grant No. R01 EB01946501, a Ministry of Education of Taiwan graduate fellowship, a NIH-NCI Training Grant No. 2T32 CA118681-11A1 and a NIH-NCI Training Grants No. R25 CA118681 and T32CA11868111A1 (Stanford Molecular Imaging Scholars Program).
References
- Nassalski A, Moszyski M, Syntfeld-Kauch A, Szczniak T, widerski, Wolski D, Batsch T, Baszak J. Multi Pixel Photon Counters (MPPC) as an Alternative to APD in PET Applications. IEEE Transactions on Nuclear Science. 2010;57(3):1008–1014. [Google Scholar]
- Ashmanskas W, LeGeyt B, Newcomer F, Panetta J, Ryan W, Van Berg R, Wiener R, Karp J. Waveform-Sampling Electronics for a Whole-Body Time-of-Flight PET Scanner. Nuclear Science, IEEE Transactions on. 2014;61(3):1174–1181. doi: 10.1109/TNS.2014.2303119. [DOI] [PMC free article] [PubMed] [Google Scholar]
- Berg E, Roncali E, Kapusta M, Du J, Cherry SR. A combined time-of-flight and depth-of-interaction detector for total-body positron emission tomography. Medical Physics. 2016;43(2):939–950. doi: 10.1118/1.4940355. [DOI] [PMC free article] [PubMed] [Google Scholar]
- Bieniosek MF, Cates JW, Levin CS. Achieving fast timing performance with multiplexed SiPMs. Physics in Medicine and Biology. 2016;61(7):2879. doi: 10.1088/0031-9155/61/7/2879. [DOI] [PubMed] [Google Scholar]
- Bieniosek MF, Olcott PD, Levin CS. Compact pulse width modulation circuitry for silicon photomultiplier readout. Physics in Medicine and Biology. 2013;58(15) doi: 10.1088/0031-9155/58/15/5049. [DOI] [PMC free article] [PubMed] [Google Scholar]
- Carrier C, Martel C, Schmitt D, Lecomte R. Design of a high resolution positron emission tomograph using solid state scintillation detectors. Nuclear Science, IEEE Transactions on. 1988;35(1):685–690. [Google Scholar]
- Casey M, Eriksson L, Schmand M, Andreaco M, Dahlbom M, Nutt R, Paulus M. Investigation of LSO crystals for high spatial resolution positron emission tomography. Nuclear Science, IEEE Transactions on. 1997;44(3):1109–1113. [Google Scholar]
- Cates JW, Levin CS. Advances in coincidence time resolution for PET. Physics in Medicine and Biology. 2016;61(6):2255. doi: 10.1088/0031-9155/61/6/2255. [DOI] [PubMed] [Google Scholar]
- Cates JW, Vinke R, Levin CS. Analytical calculation of the lower bound on timing resolution for pet scintillation detectors comprising high-aspect-ratio crystal elements. Physics in medicine and biology. 2015;60(13):5141. doi: 10.1088/0031-9155/60/13/5141. [DOI] [PMC free article] [PubMed] [Google Scholar]
- Chang CM, Grant AM, Lee BJ, Kim E, Hong K, Levin CS. Performance characterization of compressed sensing positron emission tomography detectors and data acquisition system. Physics in Medicine and Biology. 2015;60(16):6407. doi: 10.1088/0031-9155/60/16/6407. [DOI] [PubMed] [Google Scholar]
- Dahlbom M, MacDonald L, Eriksson L, Paulus M, Andreaco M, Casey M, Moyers C. Performance of a YSO/LSO phoswich detector for use in a PET/SPECT system. Nuclear Science, IEEE Transactions on. 1997;44(3):1114–1119. [Google Scholar]
- Fleury J, Callier S, de La Taille C, Seguin N, Thienpont D, Dulucq F, Ahmad S, Martin G. Petiroc and Citiroc: front-end ASICs for SiPM read-out and ToF applications. Journal of Instrumentation. 2014;9(01):C01049. [Google Scholar]
- Fontaine R, Tetrault MA, Belanger F, Viscogliosi N, Himmich R, Michaud JB, Robert S, Leroux JD, Semmaoui H, Berard P, Cadorette J, Pepin C, Lecomte R. Real time digital signal processing implementation for an APD-based PET scanner with phoswich detectors. Nuclear Science, IEEE Transactions on. 2006;53(3):784–788. [Google Scholar]
- Grant AM, Deller TW, Khalighi MM, Maramraju SH, Delso G, Levin CS. NEMA NU 2-2012 performance studies for the SiPM-based ToF-PET component of the GE SIGNA PET/MR system. Medical Physics. 2016;43(5):2334–2343. doi: 10.1118/1.4945416. [DOI] [PubMed] [Google Scholar]
- Grant AM, Levin CS. A new dual threshold time-over-threshold circuit for fast timing in PET. Physics in Medicine and Biology. 2014;59(13):3421. doi: 10.1088/0031-9155/59/13/3421. [DOI] [PubMed] [Google Scholar]
- Gundacker S, Auffray E, Jarron P, Meyer T, Lecoq P. On the comparison of analog and digital SiPM readout in terms of expected timing performance. New Developments in Photodetection NDIP14. 2015;787:6–11. [Google Scholar]
- Nemallapudi MV, Gundacker S, Lecoq P, Auffray E, Ferri A, Gola A, Piemonte C. Sub-100 ps coincidence time resolution for positron emission tomography with LSO:Ce codoped with Ca. Physics in Medicine and Biology. 2015;60(12):4635. doi: 10.1088/0031-9155/60/12/4635. [DOI] [PubMed] [Google Scholar]
- Rolo MD, Bugalho R, Gonalves F, Mazza G, Rivetti A, Silva JC, Silva R, Varela J. TOFPET ASIC for PET applications. Journal of Instrumentation. 2013;8(02):C02050. [Google Scholar]
- Roncali E, Phipps JE, Marcu L, Cherry SR. Pulse shape discrimination and classification methods for continuous depth of interaction encoding PET detectors. Physics in Medicine and Biology. 2012;57(20):6571. doi: 10.1088/0031-9155/57/20/6571. [DOI] [PMC free article] [PubMed] [Google Scholar]
- Sacco, Fischer P, Ritzert M. PETA4: a multi-channel TDC/ADC ASIC for SiPM readout. Journal of Instrumentation. 2013;8(12):C12013. [Google Scholar]
- Saoudi A, Pepin C, Dion F, Bentourkia M, Lecomte R, Andreaco M, Casey M, Nutt R, Dautet H. Investigation of depth-of-interaction by pulse shape discrimination in multicrystal detectors read out by avalanche photodiodes. Nuclear Science, IEEE Transactions on. 1999;46(3):462–467. [Google Scholar]
- Schmall JP, Surti S, Karp JS. Characterization of stacked-crystal PET detector designs for measurement of both TOF and DOI. Physics in Medicine and Biology. 2015;60(9):3549. doi: 10.1088/0031-9155/60/9/3549. [DOI] [PMC free article] [PubMed] [Google Scholar]
- Schmand M, Eriksson L, Casey M, Andreaco M, Melcher C, Wienhard K, Flugge G, Nutt R. Performance results of a new DOI detector block for a high resolution PET-LSO research tomograph HRRT. Nuclear Science, IEEE Transactions on. 1998;45(6):3000–3006. [Google Scholar]
- Schmand M, Eriksson L, Casey M, Wienhard K, Flugge G, Nutt R. Advantages using pulse shape discrimination to assign the depth of interaction information (DOI) from a multi layer phoswich detector. Nuclear Science, IEEE Transactions on. 1999;46(4):985–990. [Google Scholar]
- Seidel J, Vaquero J, Siegel S, Gandler W, Green M. Depth identification accuracy of a three layer phoswich PET detector module. Nuclear Science, IEEE Transactions on. 1999;46(3):485–490. [Google Scholar]
- Seiichi Y, Masao I, Tadashi W, Hiroshi W, Yasukazu K, Eku S, Jun H. Development of a Si-PM-based high-resolution PET system for small animals. Physics in Medicine and Biology. 2010;55(19):5817. doi: 10.1088/0031-9155/55/19/013. [DOI] [PubMed] [Google Scholar]
- Spanoudaki VC, Levin CS. Investigating the temporal resolution limits of scintillation detection from pixellated elements: comparison between experiment and simulation. Physics in Medicine and Biology. 2011;56(3):735. doi: 10.1088/0031-9155/56/3/013. [DOI] [PubMed] [Google Scholar]
- Spurrier M, Szupryczynski P, Yang Kan, Carey A, Melcher C. Effects of Co-Doping on the Scintillation Properties of LSO:Ce. Nuclear Science, IEEE Transactions on. 2008;55(3):1178–1182. [Google Scholar]
- Stankova V, Shen W, Briggl K, Chen H, Fischer P, Gil A, Harion T, Kiworra V, Munwes Y, Ritzert M, Schultz-Coulon HC. STIC3 Silicon Photomultiplier Timing Chip with picosecond resolution. New Developments in Photodetection NDIP14. 2015;787(0):284–287. [Google Scholar]
- Surti S, Kuhn A, Werner ME, Perkins AE, Kolthammer J, Karp JS. Performance of Philips Gemini TF PET/CT Scanner with Special Consideration for Its Time-of-Flight Imaging Capabilities. Journal of Nuclear Medicine. 2007;48(3):471–480. [PubMed] [Google Scholar]
- Surti S, Shore A, Karp J. Design Study of a Whole-Body PET Scanner With Improved Spatial and Timing Resolution. Nuclear Science, IEEE Transactions on. 2013;60(5):3220–3226. doi: 10.1109/TNS.2013.2265605. [DOI] [PMC free article] [PubMed] [Google Scholar]
- Thoen H, Keereman V, Mollet P, Holen RV, Vandenberghe S. Influence of detector pixel size, TOF resolution and DOI on image quality in MR-compatible whole-body PET. Physics in Medicine and Biology. 2013;58(18):6459. doi: 10.1088/0031-9155/58/18/6459. [DOI] [PubMed] [Google Scholar]
- Wienhard K, Schmand M, Casey M, Baker K, Bao J, Eriksson L, Jones W, Knoess C, Lenox M, Lercher M, Luk P, Michel C, Reed J, Richerzhagen N, Treffert J, Vollmar S, Young J, Heiss W, Nutt R. The ECAT HRRT: performance and first clinical application of the new high resolution research tomograph. Nuclear Science, IEEE Transactions on. 2002;49(1):104–110. [Google Scholar]
- Tian Y, Takahashi H, Shimazoe K. Characteristics of an Energy-Resolving System Using Dynamic Time Over Threshold Method. IEEE Transactions on Nuclear Science. 2015;62(4):1798–1804. [Google Scholar]
- Yamamoto S, Ishibashi H. A GSO depth of interaction detector for PET. Nuclear Science, IEEE Transactions on. 1998;45(3):1078–1082. [Google Scholar]
- Yeom JY, Vinke R, Levin CS. Optimizing timing performance of silicon photomultiplier-based scintillation detectors. Physics in Medicine and Biology. 2013;58(4):1207–1220. doi: 10.1088/0031-9155/58/4/1207. [DOI] [PMC free article] [PubMed] [Google Scholar]


