Abstract
Reliably creating three-dimensional (3D) mesoscale clusters, in which nanoparticles are spatially arranged in pre-determined positions, is the first step towards arbitrarily designed self-assembled architectures. These engineered clusters would be the mesoscale analogs of molecules and would thus offer tailored nanoparticles properties due to the collective effects. However, establishing a flexible and broadly applicable platform for the fabrication of nanoparticles architectures, as well as probing their 3D non-periodic organizations, is challenging. Here we report a novel strategy for assembling 3D nanoparticle clusters: designing a molecular frame with encoded vertices for particles placement. By positioned specific particles types at the vertices of such frame, a DNA origami octahedron, we fabricated clusters of various symmetries and particles composition. We applied the Cryo-EM methods to uncover the DNA frame structure, and to reveal that nanoparticles are spatially coordinated in the prescribed manner. Employing the demonstrated assembly strategy, we have created nanoclusters with different chiroptical activities based on the specifically encoded center-symmetrical DNA frame and the same set of nanoparticles. We also show that octahedra with particularly selected vertices can serve as tailorable interparticle linker with a certain geometry of interparticle connections, thus, allowing for assembly of 1D or 2D arrays with designed particle arrangements.
The assembly of well-defined particle clusters by design has long been seen as one of the key challenges in rational material fabrication due to their direct analogy with molecules. The designed clusters are not constrained by the orientations of interatomic bonds as in molecules found in the natural world. Therefore, a broad diversity of structures can potentially be generated. Clusters with tailored structures and functions could be used as the designer’s blocks to create higher level organizations. Such clusters were recently proposed for addressing the challenge of inverse engineering in self-assembled systems1,2. From a functional perspective, designed meso-clusters from nanoparticles (NP) are attractive for accessing their collective and synergetic effects3–6 and manipulating their optical response3,7–9.
Recently, much progress was achieved on micron-scales in understanding and fabrication of clusters from so called patchy particles10, where the placement of patches determines directional interparticle interactions11,12. For nanoscale particles, the challenges in placing patterns in the specified particle’s locations with a high fidelity are significant; therefore, alternative strategies were considered. A number of studies explored the DNA-assembled hetero-clusters13, the discrete and polymer-like14 assemblies using nanoparticles with monovalent and multivalent binding properties4,13–16, step-wise assembly from molecularly encoded surfaces17, and via templating of molecular motifs18–20. Nevertheless, methods for robust and massive assembly of complex yet designed cluster architectures in which nanoparticles of different types can be spatially arranged in pre-determined three-dimensional (3D) arrangements remain challenging. Furthermore, an ultimate goal is a development of universal assembly platform that can be applied to a wide range of nanoparticles materials and their surface functionalities.
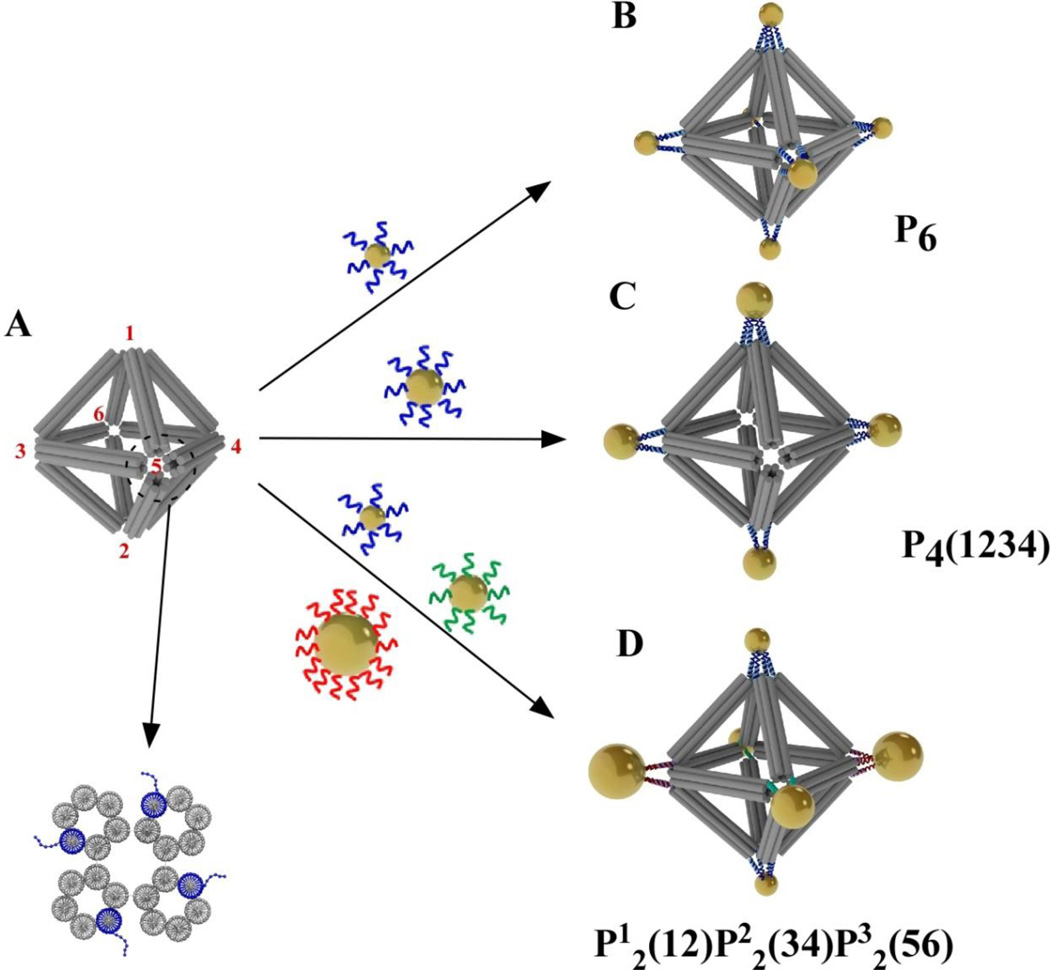
In this paper we propose and demonstrate the experimental realization of the NP cluster assembly platform using a rigid 3D nanoscale molecular frame. We show in the specific implementation using an octahedral DNA frame that nanoparticles can be arranged in 3D in the prescribed locations, which are determined by the frame vertices encoded by the specific DNA sequences (Figure 1). We show several representative examples of particles organizations: (i) an octahedral cluster that fully replicates the frame geometry (Figure 1B); (ii) a square-like cluster in which subset symmetry of the original frame is used (Figure 1C); (iii) an octahedral hetero-cluster in which three types of particles are coordinated in the particular positions (Figure 1D). We stress that the discussed approach is conceptually different from the assembly methods based on patchy and patterned particles, since no complex particle fabrication is required. As we show below, the proposed methodology, “the cluster assembly by frame”, streamlines a fabrication of designed 3D meso-architectures and fully support the integration of different nanoparticle types as soon as they contain specific DNAs in their shell21,22. We choose to use DNA as a frame for the implementation of the concept due to its highly customizable structure23 and ease of programmability of interactions between the frame and particles. Over the past decade, DNA have offered a compelling methods towards creation of nanoparticles arrays, either in 2D using DNA tile motifs24,25 by implementing basic design rules23 or in 3D using DNA-encoded particle shell interactions26,27, as well as discrete assemblies and linear arrays4,8,18. The DNA origami technology allows for the designed fabrication of discrete 2D28 and 3D29 DNA shapes, and the reactive groups can be precisely located30. We use here 3D origami construct, shaped as octahedron with DNA-encoded vertices, as frame for assembly of designed clusters from nanoparticles. Moreover, we show that their optical response, a chiroptical activity7,8,31, can be fully controlled based on the prescribed placement of nanoparticles of different sizes on the same central-symmetrical frame. By exploiting the octahedron frame as a programmable linker between nanoparticles we demonstrate, using ex-situ TEM and in-situ x-ray scattering methods, that low-dimensional, linear 1D and square 2D, nanoparticle arrays can be successfully created in the designed manner.
Figure 1. Scheme of three designer clusters assembled from functionalized gold nanoparticles (NPs) on a designer octahedral DNA origami frame.
(A) The designer octahedral origami structure. Red numbers mark the six corners or vertices of the octahedron. One vertex is zoomed in the lower panel to show the end-on view of the designed structure comprised of four six-helix bundles (6HB). Each 6HB contains one ssDNA sticky end (dotted blue line) that provides encoding. (B) An octahedron with all sticky ends being encoded to coordinate 7-nm NPs into the symmetric 6-NP cluster P6. (C) The P4(1234) cluster structure may form if the ssDNA at vertices 1-2-3-4 of the octahedral frame is programmed with sequence complementary to the ssDNA on the 10-nm gold NPs. (D) The P12(12)P22(34)P32(56) cluster structure may assemble if the ssDNA at vertices 1–2, 3–4, and 5–6 are programed to complement the ssDNA on the 7-nm, 15-nm, and the 10-nm NPs, respectively.
Revealing 3D structure of mesoscale clusters is a significant challenge, particularly, due to the need for probing clusters both on ensemble and individual cluster levels at different scales. Such probing of frame internal structure, 3D positioning of NPs and a cluster population analysis are important for the realization of high-fidelity assembly and understanding the effects of frame-NP interactions. Traditional TEM provides clear images of metal nanoparticles alone32, but not of the DNA constructs. Negative staining EM offers a way of observing both metal particles and DNA template8,18,30, but can flatten thus distort the relatively large 3D structure. In contrast, cryo electron microscopy (cryo-EM) preserves samples in their near native states and provides close to nanometer resolution of structures using single particle 3D reconstruction technique24,33–35 and tomography36–38. We show here that cryo-EM can be successfully applied to probe the 3D structure of DNA-NP clusters.
First, we designed the frame, an octahedral DNA origami structure (Figure 1A), using the caDNAno software package (http://cadnano.org/)39. Each octahedral edge contains a six-helix-bundle (6HB)40–42, out of which one helix (blue, Figure 1A at the bottom) has a single strand (ss) DNA stretched out of the duplex ends for attaching nanoparticles (NPs). Vertex positions (labeled from 1 to 6) could be encoded with distinctive ssDNA “sticky ends”, which can bind the nanoparticles coated with complementary DNA. We designed three routes to assemble different numbers and sizes of gold nanoparticles (Figure 1B–1D). When six vertices have the same sticky end, a six-particle cluster is formed after mixing with the corresponding DNA-encoded NPs. The resulting NP cluster, denoted as ‘P6’ (Figure 1B), has a symmetry Oh. When only four in-plane vertices are encoded and two others are silent, 4-particle cluster (Figure 1C) could be formed, denoted as ‘P4(1234)’ to indicate the number of particles and their vertex locations. The heterogeneous cluster can be created by introduction of different DNA at vertices of choice. Here, we used three distinctive sets of sticky ends, with two of the same kind located at opposite vertices, as shown in Figure 1D. Such design allows binding three types of nanoparticles. We used 7 nm (P1), 10 nm (P2), and 15 nm (P3) gold NP (see supporting information) with respectively commentary shells for prescribing this hetero-cluster, labeled as ‘P12(12)P22(34)P32(56)’.
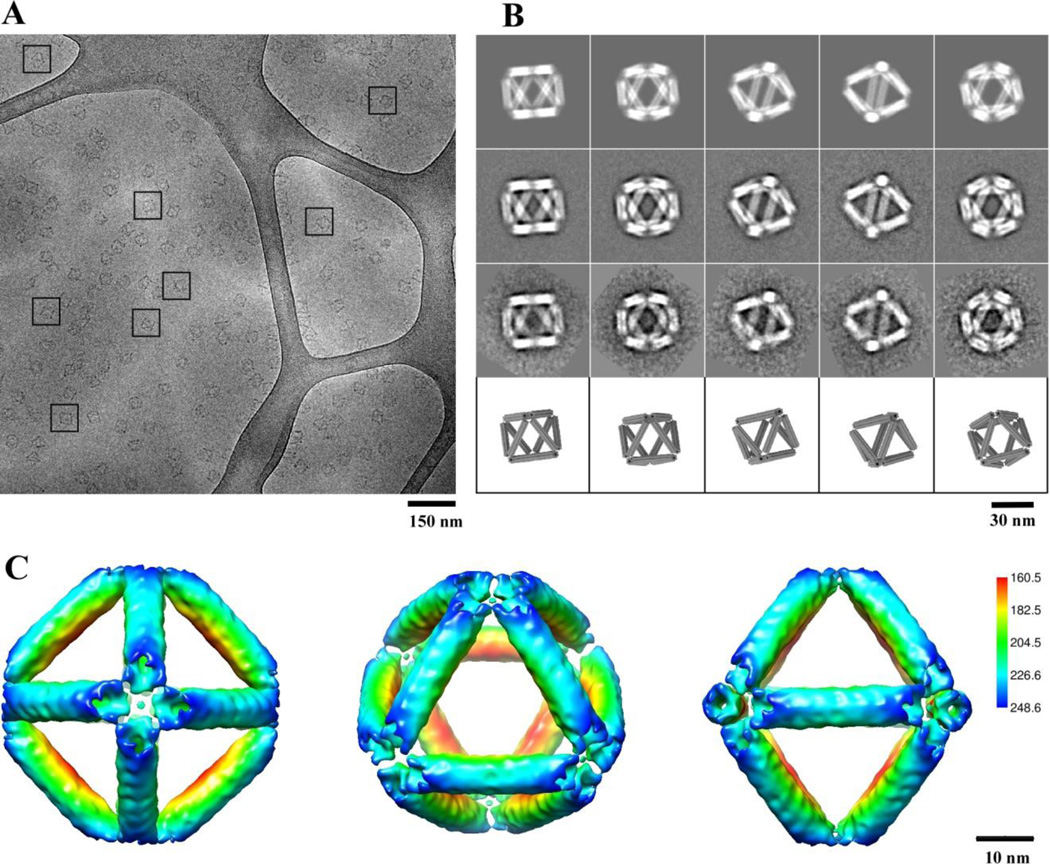
The octahedral DNA frame was formed by mixing M13mp18 DNA and hundreds of staple strands28,29 and slowly annealed from 90 °C to room temperature which was confirmed firstly by gel electrophoresis (Figure S1). According to our design, each six-helix-bundle on the edge has a designed length of 28.6 nm (84 base pairs). To confirm the successful fabrication of octahedron frame after its assembly we carried out a detailed cryo-EM study, in addition to the standard electrophoretic characterization (see supporting information). The high-fidelity octahedral formation (TEM observed yield around 99%) is clearly visible in the raw cryo-EM micrograph (Figure 2A). Several representative views of the DNA octahedra are highlighted by the square boxes. The DNA octahedra are randomly oriented in the vitreous ice, have expected dimensions, and appear monodisperse in shape and size. These 2D images permitted computational reconstruction of the 3D structure of the octahedron origami (see supporting information), as we discuss below. 2D class averages of raw particle images are nearly identical to the corresponding re-projections of the reconstructed 3D density model (Figure 2B). This demonstrates the quality of the particle images and the reliability of the 3D reconstruction of the DNA octahedron.
Figure 2. Cryo-EM and 3D reconstruction of the self-assembled DNA origami octahedron.
(A) A cryo-EM micrograph with representative views of DNA octahedron boxed by a black square. Only cluster structures that were embedded in the vitreous ice and suspended over the irregular holes in the carbon film substrate were selected for further analysis. (B) Comparison of 2D reprojections of the reconstructed 3D density map (top row), with reference-based class averages (second row), reference-free class averages (third row), and with the corresponding views of the 3D design model (bottom row). (C) Surface-rendered 3D density map of the DNA octahedron, as viewed from the 4-fold (left), 3-fold (middle), and 2-fold (right) symmetry axis. The density surface is colored radially from interior red to outer blue. The color key is shown on the right. The values in the color key indicate the distance in angstrom from the octahedral center.
The DNA octahedron structure was derived from approximately 10,000 manually selected raw particle images (Figure 2C). The 3D density map is surface rendered and shown in the typical 4-fold, 3-fold, 2-fold axis views. The octahedral edge in the three-dimensional map is ~29 nm long, in agreement with the designed length. Each edge of the reconstructed DNA octahedron is a hollow structure with a ~2 nm channel in the middle. Again this feature is consistent with our six-helix bundle design for the edge (Figures 1 and S3). The resolution of the reconstructed DNA octahedron structure is estimated to be ~23.5 Å (Figure S4)43, perhaps limited by the rigidity of the structure. Rigidity is an important design parameter for cluster assembly. The persistence length of double helix is about 50 nm44; clusters built from the double helix frame may suffer from the edge flexibility. In contrast, the persistence length for 6HB is around 1–1.6 µm45,46, much longer than both DNA duplex and DNA double crossover (DX) design47. We therefore chose the six-helix bundle (6HB) design to construct octahedron edges. The hollow structure of 6HB and formed octahedral vertices provides housing functionalized moieties, with potential applications in nanotechnology and biomedicine30. Our success in visualizing the structure of the large, symmetric, and non-space-filling 3D origami constructs by cryo-EM is notable, because this method was previously applied only to the space-filling DNA origami35 or flexible origami box33 or to the nano-scale non-origami polyhedra24,33,34.
We computationally built a standard B-DNA model with 84 base pairs (bp) in length and manually arranged six copies to form a close-packed 6HB DNA model, leaving a hollow channel in the middle (see supporting information). We then docked the 6HB model as one entity (rigid body) into one edge of the DNA octahedron EM map, and found that the model fitted the density very well (Figure S3). The good agreement leads us to conclude that we have succeeded in fabricating the DNA origami octahedron that we have designed for. The central cavity of the octahedron should be able to accommodate a spherical particle up to 20 nm in diameter.
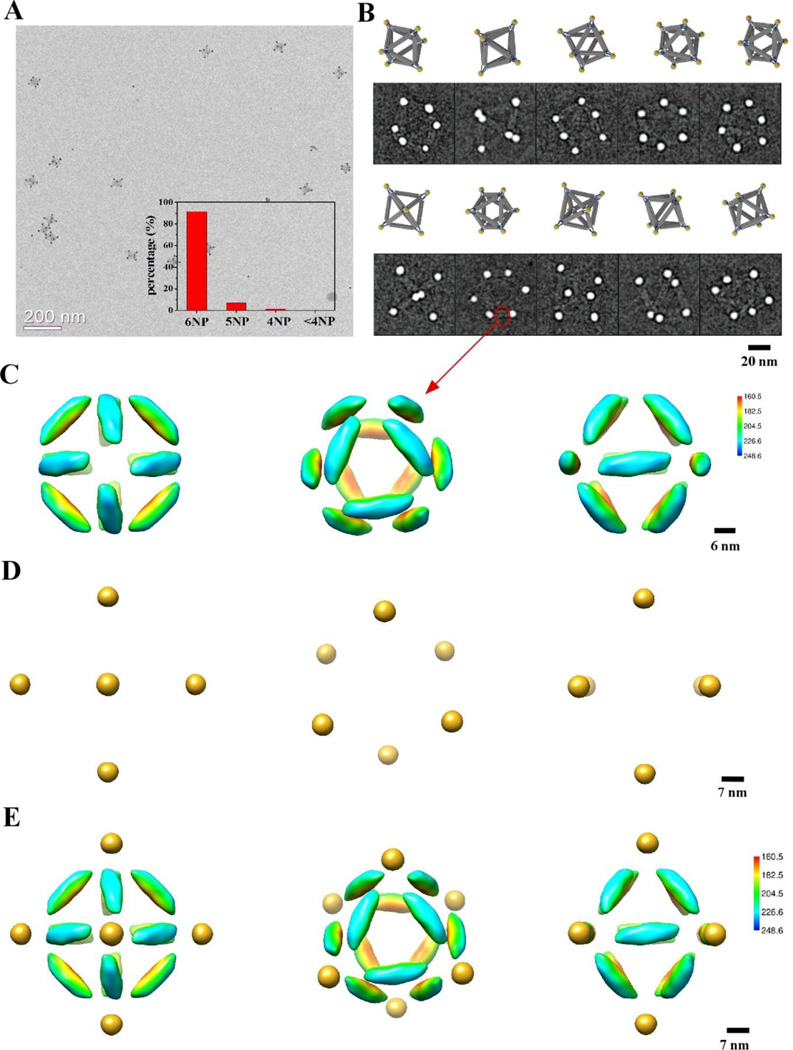
We then assembled a simple P6 cluster on the octahedron frame. We first functionalized the 7-nm gold nanoparticles (NP) with the 30-base ssDNA that are complementary in sequence to the sticky ends of the octahedral vertices (see supporting information), then mixed the NP with the octahedra at a molar ratio of 1:15 (octahedra:NP; DNA octahedra concentration about 1nM). The mixture was annealed from 50 °C to room temperature in 3 hours, concentrated, and loaded into a 1% agarose gel for separation. The gel band containing assembled clusters are cut out, crushed with a pestle, and filtered through a cellulose-acetate spin column, and the collected sample solution was used for negative-staining EM and cryo-EM. We show in Figure 3A a representative raw image of the purified complexes. These clusters are highly homogeneous, with over 90% out of the 460 clusters counted containing the correct number (6) of NPs in the prescribed vertex positions in each octahedron (Figure 3A inset).
Figure 3. The P6 cluster structure as revealed by cryo-EM and 3D reconstruction.
(A) A representative EM image of the P6 cluster structure. Inset shows the histogram of assembled clusters with observed NP numbers. (B) Ten selected cryo-EM images of the fully assembled P6 octahedron-NP clusters (second and forth rows), in comparison with the 3D design model in corresponding views (first and third rows). (C) 3D reconstruction of the DNA portion of the P6 cluster by excluding the high intensity NPs in cryo-EM images. The density surface is colored in the same way as Figure 2C. (D) 3D reconstruction of the six NPs of the P6 cluster by using only the high intensity NP scattering signals in the cryo-EM dataset. (E) The composite 3D EM structure of the P6 cluster derived by computationally combining the structures shown in (C) and (D). The left, middle, and right panel in (C–E) shows 4-fold, 3-fold, and 2-fold views of the respective structure.
It is clear that the 6 NPs of the individual clusters in the raw cryo-EM images are arranged in a manner that is consistent with the octahedral symmetry (Figure 3B). Notably, the DNA is barely visible, with much weaker contrast than the gold NPs. This is because the gold NPs are significantly more electron dense than the DNA. 3D reconstruction from the raw particle images reveals the overall size and symmetry of the P6 cluster (Figure S5). However, when the display threshold is set to show the DNA structure, the gold NPs appear to be distorted and much larger than expected. To overcome the problem, we subsequently calculated two independent 3D reconstructions from the same cryo-EM dataset: in the first reconstruction, the high NP densities were computationally removed from the raw images, keeping the DNA density intact (Figure 3C), and in the second reconstruction the lower intensity DNA density as well as the background noise were removed leaving only the higher intensity NPs (Figure 3D). We normalized and then aligned the two reconstructions by their symmetry axes and merged them into a synthetic structure (Figure 3E). In this compound map, the diameters of NPs are around 7 nm, consistent with the particle size estimated from the raw images. Six nanoparticles are precisely positioned at the six vertices of the reconstructed DNA octahedron frame, with the nearest center-to-center NP distance of ~43 nm.
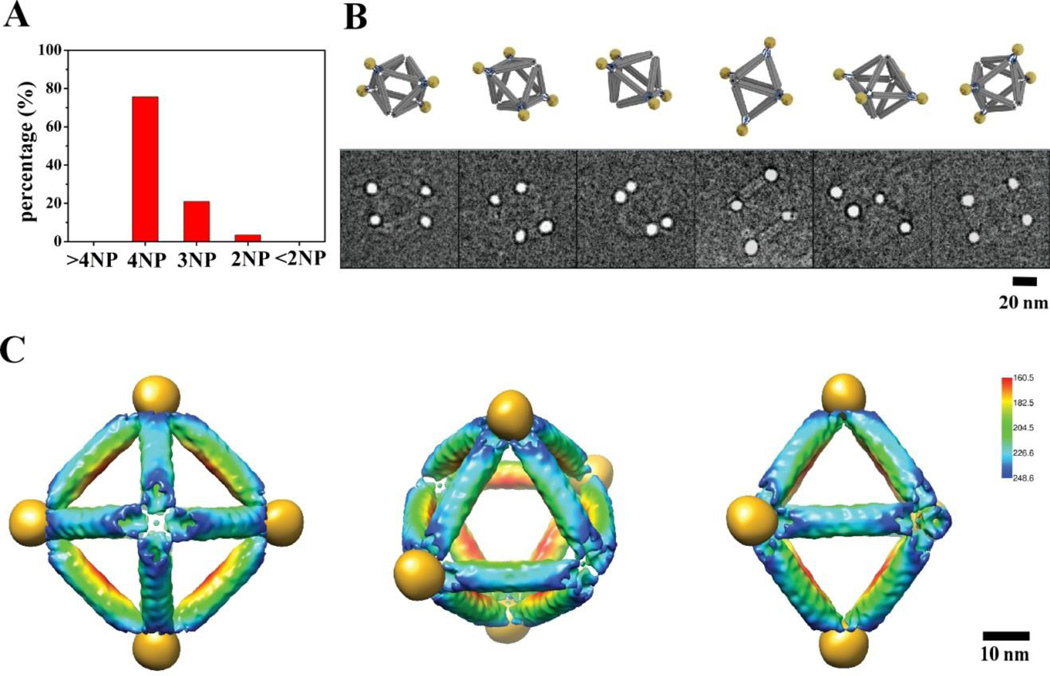
The control over the assembly of pre-defined cluster, P4(1234), with a square-like particle arrangement, was further demonstrated by choosing four co-planner corners of the octahedron with the specific sticky end oligonucleotides (Figure 1C). 10nm gold NPs functioned with complementary DNA were then mixed with the designed octahedra at a molar ratio of 10:1 to form the target cluster. Samples for EM were obtained in the same way as for the P6 cluster. We show the representative image of the P4(1234) clusters in Figure S7. The cluster population histogram (Figure 4A) demonstrates that close to 80% of the clusters contains the correct number (four) of NPs (out of total number 554). Figure 4B compares cryo-EM images of six origami-NP complex with their corresponding views of the 3D model. The DNA density in these images appears even weaker than that in Figure 3B because the NPs used are larger; as a result, their density is more predominant in contrast with DNA octahedra. 3D reconstruction of the NP cluster is shown in Figure S6, where four well-positioned nanoparticles (gold color) are clearly seen located with 4-fold symmetry. The NP size in the reconstruction is around 10 nm, which is consistent with the estimation from the raw images, and the nearest center-to-center NP distance is about 40 nm. To illustrate the arrangement of the four NPs with the DNA octahedra, we computed a composite map by aligning and merging the gold NPs reconstruction with the DNA octahedron reconstruction as shown in the Figure 2C. The composite map shows that four 10-nm NPs are precisely positioned at four vertices of the reconstructed octahedron origami template (Figure 4C).
Figure 4. Structure of the P4(1234) cluster.
(A) The cluster population histogram. (B) Six selected raw cryo-EM images of the assembled DNA-NP cluster (bottom row) in comparison with the design model in corresponding views (top row). (C) A composite density map derived by combining 3D reconstruction of the DNA octahedron (Figure 2C) with 3D reconstruction of the four 10-nm NPs organized by octahedral DNA frame. The rendering threshold of the later is set to show the NP densities. Left, middle, and right panel show view along the four-fold, three-fold, and two-fold symmetry axis of octahedron.
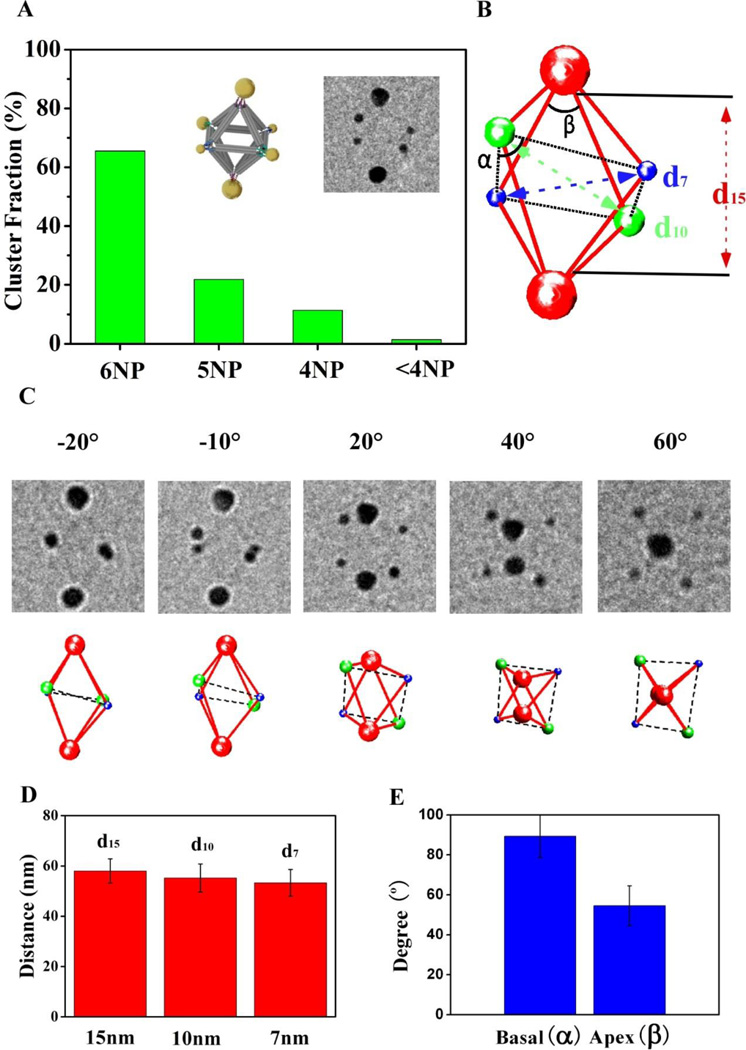
Next we demonstrate that outlined assembly approach allows for the realization of hetero-clusters containing several types of particles in pre-defined positions. For example, the cluster was designed to coordinate three particles types, P12(12)P22(34)P32(56), as shown in Figure 1D. Six corners of the octahedron were grouped into three diagonal sets. By providing the corresponding DNA encoding, we assign vertices 1 and 2, 3 and 4, and 5 and 6 to bind to 7nm, 10 nm and 15 nm NPs respectively. DNA octahedra were mixed with three kinds of NPs with at the corresponding ratio of 1:5:5:5 and slowly annealed and purified as described above. The representative TEM image of the assembled cluster shows that the majority of these clusters have the correct structure (Figure S8). The population histogram, shown in Figure 5A, reveals that about 70% of the clusters (out of a total number of 467 clusters), coordinate 6 NPs with about equal fraction of each particle types. For partially assembled clusters (5NP and less), the missing NPs came from 3 different kinds nearly evenly. Figure S9 shows twelve raw cryo-EM images in comparison with corresponding 2D projections of a designed model of P12P22P32 cluster. We note that due to the high dynamical range of electron densities the DNA is nearly invisible.
Figure 5. Electron tomography of individual hetero-cluster, P12(12)P22(34)P32(56), assembled with three types of NPs.
(A) Statistical analysis of the NP cluster population. The design model and a representative cryo-EM image of the assembled cluster (untilted view) are shown as insets. (B) Reconstructed 3D structure of the NP cluster shown on the inset of (A). The surface-to-surface distance between the diagonally paired 7-nm, 10-nm, and 15-nm NPs are denoted by d7, d10, and d15, respectively. α is the angle centered around the 10-nm NPs, and β around the 15-nm NPs, respectively. (C) Images obtained by tilting the cluster shown in (A) at different angles (from left to right: −20°, −10°, 20°, 40°, 60°) (top row), in comparison with corresponding views of the reconstructed 3D structure. (D) Averaged distances between the diagonally paired 7-, 10-, and 15-nm NPs measured from 12 independently reconstructed P12P22P32 clusters: d15 = 58.0 ± 4.8 nm, d10 = 55.1 ± 5.6 nm, and d7 = 53.3 ± 5.3 nm. (E) Averaged values of the basal (α=89.4° ± 10.9°) and vertex (β = 54.5° ± 10.0°) angles.
To unravel the 3D coordinates of the assembled P12P22P32 cluster, we apply tomographic method for this system that permit a 3D probing of individual clusters. We acquired a series of TEM images from −60° to +60° with 10° intervals for twelve P12P22P32 clusters. The projected positions of the particles were measured and fitted to a tilting model to extract 3D coordinates of the NP (see supporting information), which permitted to reconstruct the cluster structure (Figure 5B). The TEM image inserted in Figure 5A shows the untilted picture of the cluster which corresponds to reconstructed particles positions (Figure 5B), while 5C presents a few selected tilted images of the reconstruction at −20°, −10°, 20°, 40°, 60° tilt angles. The projections of the reconstructed clusters agreed well with the raw EM images. The averaged surface-to-surface distances, d7, d10 and d15, between nanoparticles of the same sizes, 7 nm, 10 nm and 15 nm respectively were obtained from twelve reconstructed clusters (Figure 5D). Small but progressive decrease of interparticle distances by about 4 nm is observed when NP diameter decreases from 15 nm to 7 nm. This change may result from different curvature of particles due to the dependence of DNA length in a shell on particle size48. Also, due to a larger attachment area of vertex’s DNA for bigger particles, a strain might be imposed on the octahedron resulting in its distortion. Averaged basal (α) and vertex (β, for 15 nm NP) angles, as noted in Figure 5B, exhibit the well-defined positions of all NPs attached to octahedral frame, as shown in Figure 5E. Ideal basal angle is around 90° which matches our experimental data; while the vertex angle (54.5°±10.0°) is close to the expected value of ~56°. Thus, we conclude that even attachment of larger particles (15 nm Au core) introduce practically no distortion on the frame; this further support the potential use of the approach for assembly of various designer hetero-cluster.
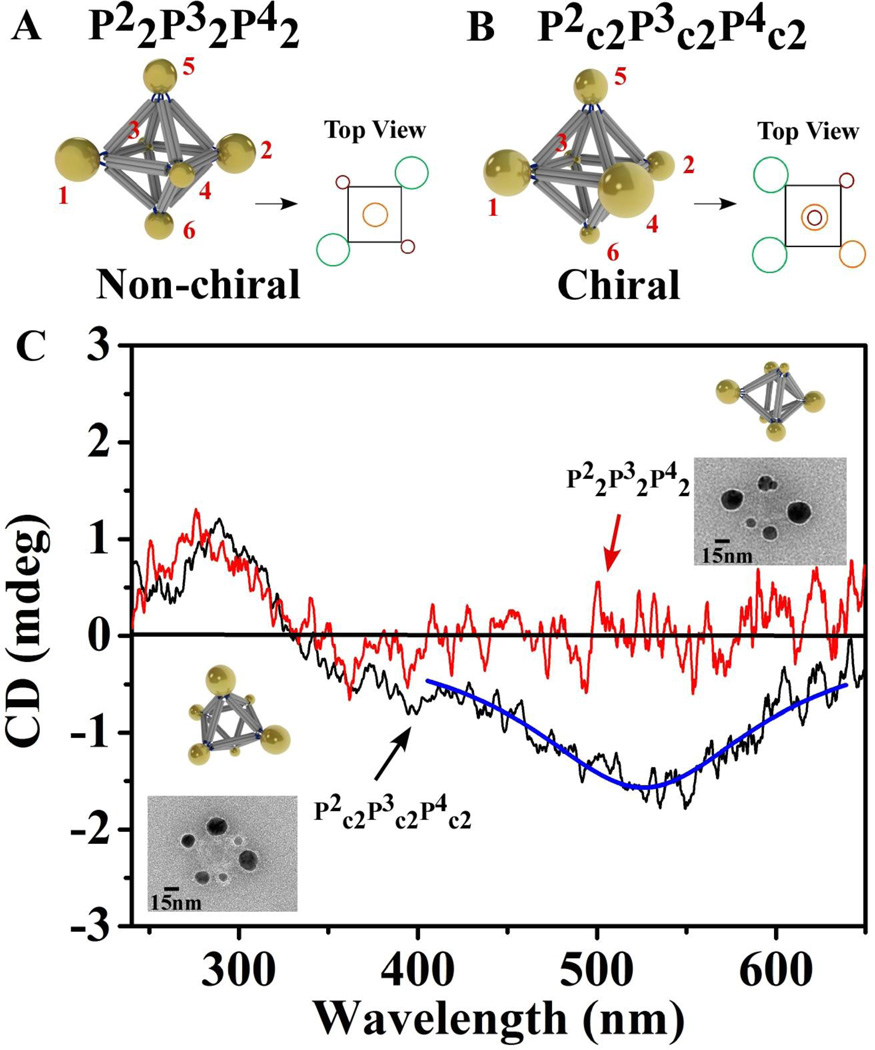
The ability to assemble nanoparticle clusters in the designed manner opens new opportunities for creating materials with regulated functions. For example, the chiraloptical activity might be induced for plasmonically coupled spherical nanoparticles placed on the chiral8 or tetrahedral scaffold31. However, as we show here, even the center-symmetric frame, like octahedron, allows producing a chiroptical response if particles of different sizes are placed accordingly. In this case, the chirality is determined by the position of specifically encoded vertices that, in turn, prescribe the placement of different particles. More specifically, depending on the arrangement of nanoparticles of three sizes on the vertices of octahedron, either in the symmetric fashion, similar to P12P22P32 (Figure 5) or in the non-symmetric way, non-chiral or chiral architectures can be formed (Figure 6a and b). Thus, from the same set of particles and the same, but differently encoded, octahedron frame different chiraloptical signatures can be generated.
Figure 6. CD spectra of octahedron based non-chiral cluster P22(34)P32(56)P42(12) (denoted as P22P32P42) and chiral cluster P22(26)P32(35)P42(14) (denoted as P2c2P3c2P4c2).
(A). Model of non-chiral cluster P22P32P42 with its top view. (B). Model of chiral cluster P2c2P3c2P4c2 with its top view. (C). Red line is the CD spectrum for cluster P22P32P42. The representative TEM image and the model with same orientation are shown at the right top corner. Black line is the CD spectrum for cluster P2c2P3c2P4c2 and the blue line is the Lorentzian fit. The representative TEM image and model with same orientation are shown at the low left corner. The CD peaks at about 270 nm for both types of clusters are DNA signatures.
To realize this idea experimentally, we have substituted the 5 nm P1 particle in P12P22P32 with 20nm gold nanoparticle (P4) in order to increase the cluster plasmonic response. Such new cluster P22(36)P32(25)P42(14), denoted as P22P32P42 (Figure 6A), has the same-size particles placed symmetrically (see also the cluster top view in Figure 6A). Representative TEM image of the P22P32P42 cluster with the correspondingly oriented model are shown on the top right inset of Figure 6C. No circular dichroism (CD) signal was detected in the plasmonic region of the spectrum (Figure 6C, red line) for such cluster. However, when the 3 pairs of NPs are positioned in the asymmetric arrangement (Figure 6B), the resulting octahedral cluster has left-handed chirality49, as can be verified by the counterclockwise rotation of 1-3-5 positions of distinguished particles to match the 4-6-2 positions of their twins. Indeed, the cluster, P22(26)P32(35)P42(14), denoted as P2c2P3c2P4c2, contains three NP pairs with the same kinds of NPs placed at the edge ends. Representative TEM image and the corresponding model are shown at the bottom left inset of Figure 6C. For this P2c2P3c2P4c2 cluster a negative CD signal was observed (Figure 6c, black line), with its center at the plasmonic peak of the gold cluster (the absorption curves are shown on Figure S12), corresponding to the cluster’s left-handed structural chirality. We note that only a very small difference, <1 nm, between plasmonic peak positions for both cases was observed, while, the dramatically different chiroptical responses are exhibited for the symmetric and asymmetric clusters. Interestingly, even the weak plasmonic coupling between nanoparticles (Fig. S12) in our system due to relatively large separations (about 36 nm surface-to-surface distances) can be still translated into the observable CD response. Thus, we demonstrated that the same set of nanoparticles and the same center-symmetric frame could be used to produce clusters with optically different CD responses via a simple, but precise, spatial placements of NPs in the 3D cluster.
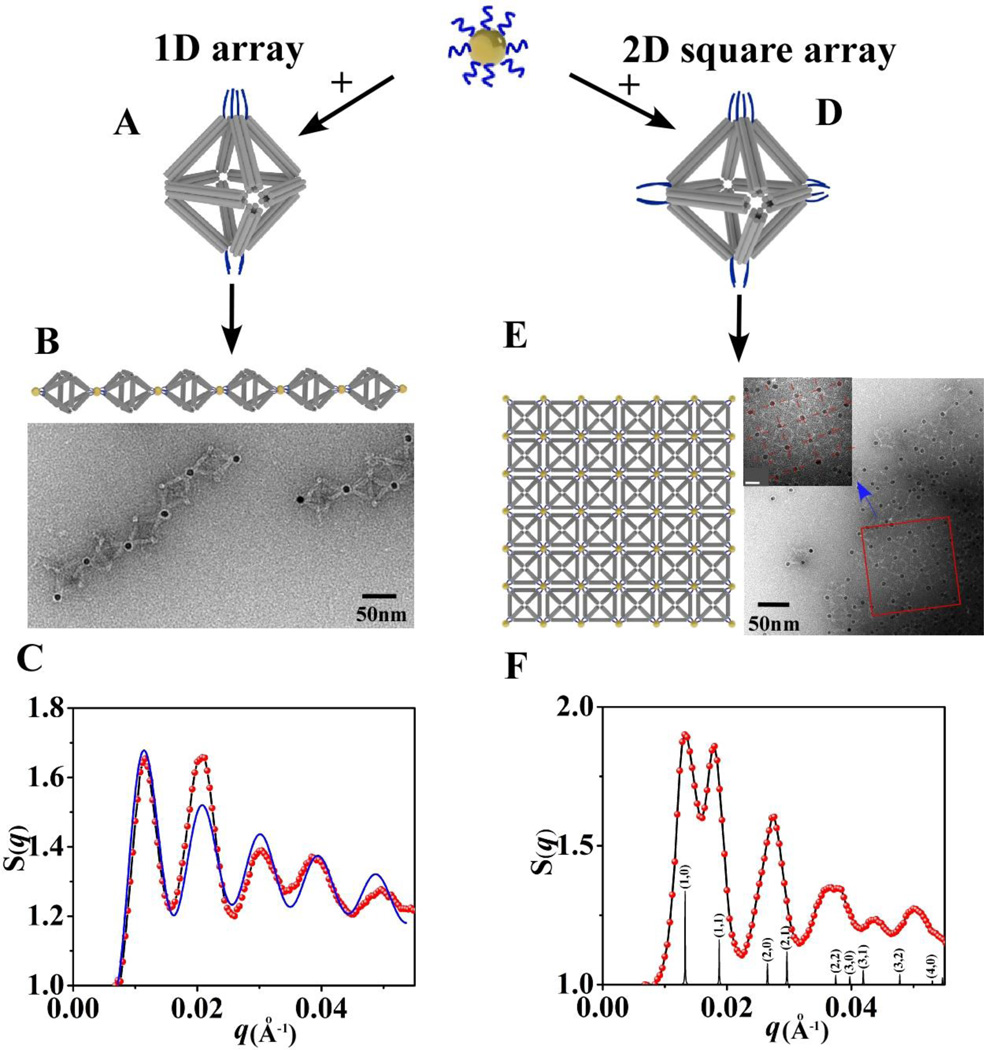
We have further explored the use of the specifically encoded octahedron frame as linking element between NPs for building low-dimensional, 1D and 2D, nanoparticle arrays. In this case the linking symmetry and the resulting structure of the array are determined by the choice of octahedron vertices utilized for inter-particle connections. Unlike assembly approaches utilizing particle positioning on DNA-scaffolds, in the presented strategy NPs and DNAs are integrated in the unified structure, in which the topology of interparticle connections is fully prescribed by the encoding of octahedra vertices. We prescribe these 1D and 2D arrays by encoding the octahedron to carry 2-fold (Figure 7A) and 4-fold (Figure 7D) symmetries, respectively. More specifically, the frame with 2-fold symmetry contains two vertices with encoding for particle recognition at two ends of the major octahedron diagonal; consequently, this design should result in the linear arrangements of NPs linked by the 2-fold linking frame. Expanding this approach, we can direct the assembly of a 2D square array (D4 symmetry) by encoding the four octahedron vertices, lying in the same plane, for NPs binding. To realize this idea for assembly of low-dimensional arrays we mixed octahedra with 10nm gold NPs at the ratio of 1:1. After careful annealing (0.3 °C /h from 50 °C to 20 °C) red loose precipitates or black aggregates appeared gradually for 1D and 2D cases, respectively. The samples were then loaded into a glass capillaries and probed by Small Angle X-ray Scattering (SAXS), as previously described21,26. Two-dimensional scattering patterns were collected from the assemblies, and structure factors, S(q), where q is the wave vector, were obtained by the radial integration and normalization by NP form factor.
Figure 7. Respectively encoded octahedra connect nanoparticles with 2-fold (left panel) or 4-fold (right panel) symmetries for corresponding assembly of low-dimensional, linear 1D and square 2D, NP arrays.
(A). Model of octahedral DNA origami with 2-fold symmetry NP binding for assembly of 1D array. (B). The model of 1D array (upper) and the representative negative stained TEM image of formed 1D array (below). (C). Extracted structure factor S(q) for 1D array from in-situ SAXS pattern (red points is a measurment, and the blue line is fitting as described in the text). (D). The model of octahedral DNA origami with 4-fold symmetry NP binding for assembly of 2D square array. (E). The model of 2D square array and the representative negative stained TEM image of formed 2D NP-octahedra array (inset is a zoomed picture of selected area; bar scale is 20nm). (F). Extracted structure factor S(q) for 2D NP array (red line) and the simulated 2D scattering pattern (black lines with corresponding diffraction peak indexes).
The structure factor for the NP assembly induced by the two-fold encoded octahedron (Figure 7C) exhibits five peaks, with peak position located at q/q1~1, 1.8, 2.7, 3.5, 4.3 (q1 is the position of the first peak). Such structure factor can be reasonably well described (Figure 7C, blue curve) by dumbbell model50,51 with functional form S(q)~sin(dq)/dq, where d is a distance between the NP centers, thus, indicating scattering signature of the NP pairs. The flexibility of 1D array at the points of octahedron attachment to NPs and the large angle over which the attachment can occur, contribute to the non-collinearity of 1D array. The fit yields d=67.4 nm which is close to the expected value based on the design parameters. We further confirmed (Figure 7B) the structure of this array by TEM imaging, which shows the morphology and inter-NP distance (d=63nm), in agreement with the in-situ SAXS results.
The structure of assembly induced by the octahedron with 4-fold symmetry NP connection was initially revealed by SAXS. The observed S(q) peaks signify a 2D NP square array (Figure 7F) with interparticle distance of 47.5nm, which is in agreement with 46.4nm obtained from the model (see supporting information). The deviation of higher order peaks towards larger q from the calculated values can be attributed to the flexibility of 2D NP-octahedron sheet in the solution. Such structure agrees with the array design (Figure 7E, left model). Indeed, in the formed 2D square arrays the four in-plane vertices (Figure 7D) are bound to four gold NPs, while each NP binds four octahedra (the vertices below and above the plane are silent). The size of 2D crystallites is 0.2 µm, as estimated from the scattering peak width, and their melting temperature is about 39 °C, as detected by DLS measurements (Figure S14). The ex-situ visualization with TEM (Figure 7E, right) concurs with the SAXS results, and it closely resembles the model arrangement: a 2D square array of NPs in which they are linked by 4-fold binding octahedron.
The presented studies demonstrate that three-dimensional nanoparticle clusters can be effectively created using the strategy based on the rigid 3D DNA frame with encoded sites for nanoparticles positioning. The example of such approach based on the octahedron, allows for arranging particles in 3D with nearly nanometer precision in the designed non-periodic structure, as confirmed by our detailed visualization using cryo-EM methods. Based on such precise cluster assembly, nano-architectures with different chiroptical activities were created using the same set of nanoparticles but different frame encodings. Moreover, we demonstrated that the designed arrangement of NPs in 1D and 2D arrays could be achieved by prescribing specific vertices of octahedron as NP connecting sites. The structural integrity of DNA frame ensures proper nanoparticles coordination, while DNA origami methodology provides a predictable frame fabrication. Our work opens up numerous exciting opportunities for high-yield precise assembly of tailored 3D mesoscale building blocks, in which multiple nanoparticles of different structures and functions can be integrated.
Supplementary Material
Acknowledgments
Research carried out at the Center for Functional Nanomaterials, Brookhaven National Laboratory was supported by the U.S. Department of Energy, Office of Basic Energy Sciences, under Contract No. DE-AC02-98CH10886.
References
- 1.Halverson JD, Tkachenko AV. DNA-programmed mesoscopic architecture. Physical Review E. 2013;87:062310. doi: 10.1103/PhysRevE.87.062310. [DOI] [PubMed] [Google Scholar]
- 2.Zeravcic Z, Brenner MP. Self-replicating colloidal clusters. Proceedings of the National Academy of Sciences of the United States of America. 2013;111:1748–1753. doi: 10.1073/pnas.1313601111. [DOI] [PMC free article] [PubMed] [Google Scholar]
- 3.Maye MM, Gang O, Cotlet M. Photoluminescence enhancement in CdSe/ZnS-DNA linked-Au nanoparticle heterodimers probed by single molecule spectroscopy. Chemical Communications. 2010;46:6111–6113. doi: 10.1039/c0cc00660b. [DOI] [PubMed] [Google Scholar]
- 4.Yan W, Xu L, Xu C, Ma W, Kuang H, Wang L, Kotov NA. Self-Assembly of Chiral Nanoparticle Pyramids with Strong R/S Optical Activity. Journal of the American Chemical Society. 2012;134:15114–15121. doi: 10.1021/ja3066336. [DOI] [PubMed] [Google Scholar]
- 5.Fan JA, Bao K, Sun L, Bao J, Manoharan VN, Nordlander P, Capasso F. Plasmonic Mode Engineering with Templated Self-Assembled Nanoclusters. Nano Letters. 2012;12:5318–5324. doi: 10.1021/nl302650t. [DOI] [PubMed] [Google Scholar]
- 6.Hiroi K, Komatsu K, Sato T. Superspin glass originating from dipolar interaction with controlled interparticle distance among gamma-Fe2O3 nanoparticles with silica shells. Physical Review B. 2011;83:224423. [Google Scholar]
- 7.Govorov AO, Fan Z, Hernandez P, Slocik JM, Naik RR. Theory of Circular Dichroism of Nanomaterials Comprising Chiral Molecules and Nanocrystals: Plasmon Enhancement, Dipole Interactions, and Dielectric Effects. Nano Letters. 2010;10:1374–1382. doi: 10.1021/nl100010v. [DOI] [PubMed] [Google Scholar]
- 8.Kuzyk A, Schreiber R, Fan Z, Pardatscher G, Roller E-M, Högele A, Simmel FC, Govorov AO, Liedl T. DNA-based self-assembly of chiral plasmonic nanostructures with tailored optical response. Nature. 2012;483:311–314. doi: 10.1038/nature10889. [DOI] [PubMed] [Google Scholar]
- 9.Barrow SJ, Wei X, Baldauf JS, Funston AM, Mulvaney P. The surface plasmon modes of self-assembled gold nanocrystals. Nature Communications. 2012;3:1–9. doi: 10.1038/ncomms2289. [DOI] [PubMed] [Google Scholar]
- 10.Ruzicka B, Zaccarelli E, Zulian L, Angelini R, Sztucki M, Moussaïd A, Narayanan T, Sciortino F. Observation of empty liquids and equilibrium gels in a colloidal clay. Nature Materials. 2011;10:56–60. doi: 10.1038/nmat2921. [DOI] [PubMed] [Google Scholar]
- 11.Wang Y, Wang Y, Breed DR, Manoharan VN, Feng L, Hollingsworth AD, Weck M, Pine DJ. Colloids with valence and specific directional bonding. Nature. 2012;491:51–56. doi: 10.1038/nature11564. [DOI] [PubMed] [Google Scholar]
- 12.Chen Q, K.Whitmer J, Jiang S, Bae SC, Luijten E, Granick S. Supracolloidal Reaction Kinetics of Janus Spheres. Science. 2011;331:199–202. doi: 10.1126/science.1197451. [DOI] [PubMed] [Google Scholar]
- 13.Mastroianni AJ, Claridge SA, Alivisatos AP. Pyramidal and Chiral Groupings of Gold Nanocrystals Assembled Using DNA Scaffolds. Journal of the American Chemical Society. 2009;131:8455–8459. doi: 10.1021/ja808570g. [DOI] [PMC free article] [PubMed] [Google Scholar]
- 14.Klinkova A, Thérien-Aubin H, Choueiri RM, Rubinstein M, Kumacheva E. Colloidal analogs of molecular chain stoppers. Proceedings of the National Academy of Sciences of the United States of America. 2013;110:18775–18779. doi: 10.1073/pnas.1315381110. [DOI] [PMC free article] [PubMed] [Google Scholar]
- 15.Kim J-W, Kim J-H, Deaton R. DNA-Linked Nanoparticle Building Blocks for Programmable Matter. Angewandte Chemie International Edition. 2011;50:9185–9190. doi: 10.1002/anie.201102342. [DOI] [PubMed] [Google Scholar]
- 16.Alivisatos AP, Johnsson KP, Peng X, Wilson TE, Loweth CJ, Bruchez MP, Jr, Schultz PG. Organization of 'nanocrystal molecules' using DNA. Nature. 1996;382:609–611. doi: 10.1038/382609a0. [DOI] [PubMed] [Google Scholar]
- 17.Maye MM, Nykypanchuk D, Cuisinier M, van der Lelie D, Gang O. Stepwise surface encoding for high-throughput assembly of nanoclusters. Nature Materials. 2009;8:388–391. doi: 10.1038/nmat2421. [DOI] [PubMed] [Google Scholar]
- 18.Pal S, Deng Z, Ding B, Yan H, Liu Y. DNA-Origami-Directed Self-Assembly of Discrete Silver-Nanoparticle Architectures. Angewandte Chemie International Edition. 2010;49:2700–2704. doi: 10.1002/anie.201000330. [DOI] [PubMed] [Google Scholar]
- 19.Lee J, Hernandez P, Govorov AO, Kotov NA. Exciton–plasmon interactions in molecular spring assemblies of nanowires and wavelength-based protein detection. Nature Materials. 2007;6:291–295. doi: 10.1038/nmat1869. [DOI] [PubMed] [Google Scholar]
- 20.Sun D, Stadler AL, Gurevich M, Palma E, Stach E, Lelie Dvd, Gang O. Heterogeneous nanoclusters assembled by PNA-templated double-stranded DNA. Nanoscale. 2012;4:6722–6725. doi: 10.1039/c2nr31908j. [DOI] [PubMed] [Google Scholar]
- 21.Zhang Y, Lu F, Yager KG, van der Lelie D, Gang O. A general strategy for the DNA-mediated self-assembly of functional nanoparticles into heterogeneous systems. Nature Nanotechnology. 2013;8:865–872. doi: 10.1038/nnano.2013.209. [DOI] [PubMed] [Google Scholar]
- 22.Zhang C, Macfarlane RJ, Young KL, Choi CHJ, Hao L, Auyeung E, Liu G, Zhou X, Mirkin CA. A general approach to DNA-programmable atom equivalents. Nature Materials. 2013;12:741–746. doi: 10.1038/nmat3647. [DOI] [PubMed] [Google Scholar]
- 23.Seeman NC. DNA in a material world. Nature. 2003;421:427–431. doi: 10.1038/nature01406. [DOI] [PubMed] [Google Scholar]
- 24.Shih WM, Quispe JD, Joyce GF. A 1.7-kilobase single-stranded DNA that folds into a nanoscale octahedron. Nature. 2004;427:618–621. doi: 10.1038/nature02307. [DOI] [PubMed] [Google Scholar]
- 25.Zheng J, Birktoft JJ, Chen Y, Wang T, Sha R, Constantinou PE, Ginell SL, Mao C, Seeman NC. From molecular to macroscopic via the rational design of a self-assembled 3D DNA crystal. Nature. 2009;461:74–77. doi: 10.1038/nature08274. [DOI] [PMC free article] [PubMed] [Google Scholar]
- 26.Nykypanchuk D, Maye MM, van der Lelie D, Gang O. DNA-guided crystallization of colloidal nanoparticles. Nature. 2008;451:549–552. doi: 10.1038/nature06560. [DOI] [PubMed] [Google Scholar]
- 27.Park SY, Lytton-Jean AKR, Lee B, Weigand S, Schatz GC, Mirkin CA. DNA-programmable nanoparticle crystallization. Nature. 2008;451:553–556. doi: 10.1038/nature06508. [DOI] [PubMed] [Google Scholar]
- 28.Rothemund PWK. Folding DNA to create nanoscale shapes and patterns. Nature. 2006;440:297–302. doi: 10.1038/nature04586. [DOI] [PubMed] [Google Scholar]
- 29.Dietz H, Douglas SM, Shih WM. Folding DNA into Twisted and Curved Nanoscale Shapes. Science. 2009;325:725–730. doi: 10.1126/science.1174251. [DOI] [PMC free article] [PubMed] [Google Scholar]
- 30.Zhang C, Li X, Tian C, Yu G, Li Y, Jiang W, Mao C. DNA Nanocages Swallow Gold Nanoparticles (AuNPs) to Form AuNP@DNA Cage Core-Shell Structures. ACS Nano. 2014;8:1130–1135. doi: 10.1021/nn406039p. [DOI] [PubMed] [Google Scholar]
- 31.Yan W, Xu L, Xu C, Ma W, Kuang H, Wang L, Kotov NA. Self-Assembly of Chiral Nanoparticle Pyramids with Strong R/S Optical Activity. Joural of American Chemical Society. 2012;134:15114–15121. doi: 10.1021/ja3066336. [DOI] [PubMed] [Google Scholar]
- 32.Sharma J, Chhabra R, Cheng A, Brownell J, Liu Y, Yan H. Control of Self-Assembly of DNA Tubules Through Integration of Gold Nanoparticles. Science. 2009;323:112–116. doi: 10.1126/science.1165831. [DOI] [PMC free article] [PubMed] [Google Scholar]
- 33.Andersen ES, Dong M, Nielsen MM, Jahn K, Subramani R, Mamdouh W, Golas MM, Sander B, Stark H, Oliveira CLP, Pedersen JS, Birkedal V, Besenbacher F, Gothelf KV, Kjems J. Self-assembly of a nanoscale DNA box with a controllable lid. Nature. 2009;459:73–76. doi: 10.1038/nature07971. [DOI] [PubMed] [Google Scholar]
- 34.He Y, Ye T, Su M, Zhang C, Ribbe AE, Jiang W, Mao C. Hierarchical self-assembly of DNA into symmetric supramolecular polyhedra. Nature. 2008;452:198–201. doi: 10.1038/nature06597. [DOI] [PubMed] [Google Scholar]
- 35.Bai X, Martin TG, Scheres SHW, Dietz H. Cryo-EM structure of a 3D DNA-origami object. Proceedings of the National Academy of Sciences of the United States of America. 2012;149:20012–20017. doi: 10.1073/pnas.1215713109. [DOI] [PMC free article] [PubMed] [Google Scholar]
- 36.Midgley PA, Dunin-borkowski R. e. electron tomography and holography in materials science. Nature Materials. 2009;8:271–280. doi: 10.1038/nmat2406. [DOI] [PubMed] [Google Scholar]
- 37.Kourkoutis LF, Plitzko JM, Baumeister W. Electron Microscopy of Biological Materials at the Nanometer Scale. Annual Review of Materials Research. 2012;42:33–58. [Google Scholar]
- 38.De-Rosier D, Klug A. Reconstruction of three dimensional structures from electron micrographs. Nature. 1968;217:130–134. doi: 10.1038/217130a0. [DOI] [PubMed] [Google Scholar]
- 39.Douglas SM, Marblestone AH, Teerapittayanon S, Vazquez A, Church GM, Shih WM. Rapid prototyping of 3D DNA-origami shapes with caDNAno. Nucleic Acids Research. 2009;37:5001–5006. doi: 10.1093/nar/gkp436. [DOI] [PMC free article] [PubMed] [Google Scholar]
- 40.Mathieu F, Liao S, Kopatsch J, Wang T, Mao C, Seeman NC. Six-Helix Bundles Designed from DNA. Nano Letters. 2005;5:661–665. doi: 10.1021/nl050084f. [DOI] [PMC free article] [PubMed] [Google Scholar]
- 41.Douglas SM, Dietz H, Liedl T, Hogberg B, Graf F, Shih WM. Self-assembly of DNA into nanoscale three-dimensional shapes. Nature. 2009;459:414–418. doi: 10.1038/nature08016. [DOI] [PMC free article] [PubMed] [Google Scholar]
- 42.Douglas SM, Chou JJ, Shih WM. DNA-nanotube-induced alignment of membrane proteins for NMR structure determination. Proceedings of the National Academy of Sciences of the United States of America. 2006;104:6644–6648. doi: 10.1073/pnas.0700930104. [DOI] [PMC free article] [PubMed] [Google Scholar]
- 43.Scheres SH, Chen S. Prevention of overfitting in cryo-EM structure determination. Nat Methods. 2012;9:853–854. doi: 10.1038/nmeth.2115. [DOI] [PMC free article] [PubMed] [Google Scholar]
- 44.Hagerman PJ. Flexibility of DNA. Annual Review of Biophysics and Biophysical Chemistry. 1988;17:265–286. doi: 10.1146/annurev.bb.17.060188.001405. [DOI] [PubMed] [Google Scholar]
- 45.Wang T, Schiffels D, Cuesta SM, Fygenson DK, Seeman NC. Design and characterization of 1D nanotubes and 2D periodic arrays self-assembled from DNA multi-helix bundles. Journal of the American Chemical Society. 2012;134:1606–1616. doi: 10.1021/ja207976q. [DOI] [PMC free article] [PubMed] [Google Scholar]
- 46.Liedl T, Hogberg B, Tytell J, Ingber DE, Shih WM. Self-assembly of three-dimensional prestressed tensegrity structures from DNA. Nature Nanotechnology. 2010;5:520–524. doi: 10.1038/nnano.2010.107. [DOI] [PMC free article] [PubMed] [Google Scholar]
- 47.Sa-Ardyen P, Vologodskii AV, Seeman NC. The flexibility of DNA double crossover molecules. Biophysical Journal. 2003;84:3829–3837. doi: 10.1016/S0006-3495(03)75110-8. [DOI] [PMC free article] [PubMed] [Google Scholar]
- 48.Hill HD, Millstone JE, Banholzer MJ, Mirkin CA. The Role Radius of Curvature Plays in Thiolated Oligonucleotide Loading on Gold Nanoparticles. ACS Nano. 2009;3:418–424. doi: 10.1021/nn800726e. [DOI] [PMC free article] [PubMed] [Google Scholar]
- 49.King RB. Nonhanded Chirality in Octahedral Metal Complexes. Chirality. 2001;13:465–473. doi: 10.1002/chir.1063. [DOI] [PubMed] [Google Scholar]
- 50.Chi C, Vargas-Lara F, Tkachenko AV, Starr FW, Gang O. Internal Structure of Nanoparticle Dimers Linked by DNA. ACS Nano. 2012;6:6793–7802. doi: 10.1021/nn301528h. [DOI] [PubMed] [Google Scholar]
- 51.Kaya H. Scattering from Cylinders with Globular End-Caps. Journal of Applied crystallography. 2004;37:223–230. [Google Scholar]
Associated Data
This section collects any data citations, data availability statements, or supplementary materials included in this article.


