

Abstract
Introduction
Through the introduction of advanced analytical techniques and improved throughput, the scope of dried blood spot testing utilising mass spectrometric methods, has broadly expanded. Clinicians and researchers have become very enthusiastic about the potential applications of dried blood spot based mass spectrometric applications. Analysts on the other hand face challenges of sensitivity, reproducibility and overall accuracy of dried blood spot quantification. In this review, we aim to bring together these two facets to discuss the advantages and current challenges of non-newborn screening applications of dried blood spot quantification by mass spectrometry.
Methods
To address these aims we performed a key word search of the PubMed and MEDLINE online databases in conjunction with individual manual searches to gather information. Keywords for the initial search included; “blood spot” and “mass spectrometry”; while excluding “newborn”; and “neonate”. In addition, databases were restricted to English language and human specific. There was no time period limit applied.
Results
As a result of these selection criteria, 194 references were identified for review. For presentation, this information is divided into: 1) clinical applications; and 2) analytical considerations across the total testing process; being pre-analytical, analytical and post-analytical considerations.
Conclusions
DBS analysis using MS applications is now broadly applied, with drug monitoring for both therapeutic and toxicological analysis being the most extensively reported. Several parameters can affect the accuracy of DBS measurement and further bridge experiments are required to develop adjustment rules for comparability between dried blood spot measures and the equivalent serum/plasma values. Likewise, the establishment of independent reference intervals for dried blood spot sample matrix is required.
Key words: dried blood spots, mass spectrometry, total testing process
INTRODUCTION
A century ago, for the very first time, Ivar Bang described a dried blood matrix as an unconventional sampling method (1). Later, Robert Guthrie in 1963 introduced the dried blood spot technique for screening. Guthrie’s application of the dried blood spot, and his personal crusade to utilise this approach to screen intellectually disabled children, heralded the introduction of newborn screening. Although the particular assay is now defunct, the term “Guthrie card” remains to colloquially describe the dried blood spot collection technique which still underpins today’s newborn screening programs worldwide (2).
The original semi-quantitative bacterial inhibition test developed by Guthrie to screen for phenylketonuria was highly sensitive but had a low analytical throughput (3). Through the introduction of advanced analytical techniques, that have expanded testing options and improved throughput, the scope of newborn screening blood spot sample applications were extended; this included screening applications for congenital hypothyroidism and cystic fibrosis in many centres (4). Further to this expansion was the introduction of tandem mass spectrometry for newborn screening dried blood spot analysis in the 1990s (5).
Mass spectrometry is now the most common technique reported in the literature for dried blood spot analysis (6-9). Dried blood spot analysis offers the advantage of collecting a small sample volume, which is easily transported. However, this also means that the concentration of the target analyte is potentially quite low (e.g. less than 1 ng/L), requiring a sensitive and specific assay for detection and quantification. These considerations, coupled with the expansion of mass spectrometry into clinical laboratories, have led to a surge in the utilisation of this sampling method outside of the scope of newborn screening in the published literature.
Clinicians and researchers have become optimistic about the potential applications of dried blood spot based mass spectrometric applications and it has been used for a range of clinical utilities including drug toxicology and sports doping screening. Scientists and technical analysts on the other hand face challenges regarding how to ensure optimal sensitivity, reproducibility and overall accuracy of dried blood spot quantification. In this review, we aim to bring together the clinical and analytical facets to discuss the advantages and current challenges of non-newborn screening applications of dried blood spot quantification by mass spectrometry.
To address these aims, we performed a key word search of PubMed and MEDLINE online databases in conjunction with individual manual searches to gather information. Keywords for the initial search included; “blood spot” and “mass spectrometry”; while excluding “newborn”; and “neonate”. In addition, databases were restricted to English language and human specific. No time period limit was applied. As a result of this selection criteria, 194 references were identified for review. For presentation, this information is divided into clinical applications and analytical considerations across the total testing process. It is not our intention in this review to highlight all analytical aspects related to quality mass spectrometric analyses (as this has been covered extensively elsewhere) but rather to address the analytical aspects pertinent to the dried blood spot matrix.
CLINICAL APPLICATIONS
The first application of mass spectrometry (MS) to dried blood spot (DBS) analysis was reported 40 years ago (in 1976) for fatty acid determination by direct chemical ionisation (10). By the mid-1980s, when gas chromatography (GC) was the technique of choice for separation and analysis of volatile small molecules, derivatized fatty acids were measured from DBS samples using GC-MS (11). In the 1990s, when electrospray ionization became commercially available, liquid chromatography - tandem mass spectrometry (LC-MS/MS) began to be incorporated into the analytical tools for newborn screening laboratories, leading to the significant expansion of screening applications with phenylalanine and tyrosine being two of the early markers (5, 12). Today dried blood spot based mass spectrometric (DBS-MS) applications are the workhorse for many newborn screening (NBS) laboratories worldwide; and additional tests are continually being added to the repertoire. Outside of NBS, an epidemiological study analysing benzoylecgonine was the first reported DBS-MS application (13).
Now, many potentially reliable and compatible MS detection methods are available across a wide range of disciplines (14). Our literature search identified 97 references encompassing 121 distinct biomarkers determined from DBS samples utilising MS technology beyond its application in NBS. Notably, the role of DBS analysis by MS now encompasses translational research and clinical diagnostic analytes in the areas of therapeutic drug monitoring (TDM); pharmakinetics); toxicokinetics; forensic; endocrinology and metabolism; and other areas of bio-analysis. Table 1 provides a list of these biomarkers.
Table 1.
The list of biomarkers determined from dried blood spot samples utilising mass spectrometry technology, beyond its application in newborn screening studies
| No | Analyte | AnalTech | LLOQ | RepU | Stab | MetV | Ref |
|---|---|---|---|---|---|---|---|
| Metabolic intermediate | |||||||
| 1 | Acylcarnitines | APTDCI-MS/MS | NR | µmol/L | NR | NR | (110) |
| ESI-MS/MS | NR | µmol/L | NR | NR | (111) | ||
| 2 | Adrenal steroids | LC-ESI-MS/MS | 0.75-6.3 | nmol/L | NR | Y | (112) |
| 3 | Amino acids profile | LC-MS/MS | 0.25 | μmol/L | NR | Y | (113) |
| 4 | Bile Acids | ESI-MS/MS | 1 | μmol/L | 10d | Y | (114) |
| 5 | Carnitine | IDES-MS/MS | 1 | μmol/L | NR | Y | (115) |
| ESI-MS/MS | NR | μmol/L | NR | Y | (111, 116) | ||
| 6 | Creatine | FIA-ESI-MS/MS | 0.25-3.57 | μmol/L | NR | Y | (117) |
| 7 | Creatinine | LC-MS/MS | 116 | μmol/L | 7d | Y | (118-120) |
| 8 | CYP450enzymes | LC-MS/MS | 0.1 | ng/ml | 4w | Y | (121) |
| 9 | Cystathionine | LC-MS/MS | 0.1-2.5 | μmol/L | 14d | Y | (122) |
| 10 | F2-isoprostanes | LC-MS/MS | 6 | pg/mL | NR | Y | (123) |
| 11 | Gammabutyrobetaine | ESI-MS/MS | NR | μmol/L | NR | NR | (116) |
| 12 | Glucosylceramide | LC-MS/MS | NR | μg/mL | NR | Y | (124) |
| 13 | Guanidinoacetate | FIA-ESI-MS/MS | 0.25-3.57 | μmol/L | NR | Y | (117) |
| 14 | Haemoglobin peptides | LC-MS/MS | NR | Ratio | NR | NR | (125) |
| 15 | Haemoglobin variants | MS | NR | NR | NR | NR | (64) |
| 16 | Haemoglobins α- and β-chains | FT-ICR-MS | NR | % | NR | NR | (126) |
| 17 | Homocysteine | LC-MS/MS | 1 | μmol/L | 3m | Y | (127) |
| LC-MS/MS | 0.1-2.5 | μmol/L | 14d | Y | (122) | ||
| 18 | Insulin-like growth factor-1 | LC-MS/MS | 50 | ng/ml | 8d | Y | (19) |
| 19 | Methotrexate polyglutamates | LC-MS/MS | 5 | nmol/L | NR | Y | (128) |
| 20 | Methylmalonic acid | LC-MS/MS | 10 | nmol/L | 8w | Y | (129) |
| 21 | Methylmalonylcarnitine | LC-MS/MS | 0.025 | μmol/L | NR | Y | (130) |
| 22 | Nucleoside profile | LC-MS/MS | NR | μmol/L | NR | Y | (131) |
| 23 | Orotic acid | HILIC-MS/MS | 0.18 | μmol/L | NR | Y | (132) |
| 24 | Protein profile | LC-MS/MS | NR | NR | NR | NR | (133) |
| 25 | Proteomics | LC-MS/MS | NR | μmol/L | NR | NR | (134) |
| 26 | Peptide profile | LC-MS/MS | NR | μg/ml | 10d | NR | (135) |
| 27 | Stroles | APTDCI-MS | NR | Ratio | NR | NR | (110, 136) |
| 28 | Succinylacetone | LC-MS/MS | 0.67 | μmol/L | NR | Y | (137) |
| LC-MS/MS | 0.25 | μmol/L | NR | Y | (113) | ||
| 29 | Succinyl-carnitine | LC-MS/MS | 0.025 | μmol/L | NR | Y | (130) |
| 30 | Sulfatides | LC-MS/MS | NR | μg/mL | NR | NR | (6) |
| 31 | Vitamin D | LC-MS/MS | 4.8 | nmol/L | >20y | Y | (38, 138-141) |
| Pharmaceutical drugs | |||||||
| 32 | Acetaminophen (Paracetamol) | LC-MS/MS | 50 | ng/ml | NR | NR | (142) |
| PS-MS | 0.25-0.75 | ng/ml | NR | NR | (7) | ||
| TLC-MS | 5.0-50 | ng/ml | NA | NR | (143) | ||
| 33 | Amitriptyline | PS-MS | 0.25-0.75 | ng/ml | NR | NR | (7) |
| LC-MS/MS | 20 | μg/L | 1m | Y | (144) | ||
| 34 | Amprenavir | LC–MS | 11.7 | ng/ml | 3m | Y | (145) |
| 35 | Paroxetine | GC-MS/MS | 1.0-20 | ng/ml | 30d | Y | (70) |
| LC–MS | 11.7 | ng/ml | 3m | Y | (145) | ||
| 36 | Atazanavir | LC-MS/MS | 0.1 | mg/L | 7d | Y | (146) |
| 37 | Atenolol | LC-HRMS | 25 | ng/ml | 2m | Y | (147) |
| 38 | Benzodiazepines | LC-MS/MS | NR | ng/mL | NR | NR | (148) |
| 39 | Benzethonium chloride | TLC-MS | 5.0-50 | ng/ml | NR | NR | (143) |
| PS-MS | 0.25-0.75 | ng/ml | NR | NR | (7) | ||
| 40 | Bisoprolol | LC-HRMS | 0.5-5.0 | ng/ml | 12w | Y | (149) |
| 41 | Bosentan | LC-MS/MS | 2 | ng/ml | 5w | Y | (150) |
| 42 | Busulfan | LC-MS/MS | 50 | ng/ml | NR | Y | (151) |
| 43 | Citalopram | PS-MS | 0.25-0.75 | ng/ml | NR | NR | (7) |
| 44 | Clarithromycin | LC-MS/MS | 0.05-0.15 | mg/L | 2m | Y | (152) |
| 45 | Clomipramine | LC-MS/MS | 20 | µg/L | 1m | Y | (144) |
| 46 | Cyclosporin A | LC-MS/MS | 116 | µmol/L | 7d | Y | (118, 120, 153-155) |
| 47 | Darunavir | LC-MS/MS | 0.1 | mg/L | 7d | Y | (156) |
| LC–MS | 11.7 | ng/ml | 3m | Y | (145) | ||
| 48 | Dasatinib | LC-MS/MS | 2.5-50 | µg/L | 28d | Y | (157) |
| 49 | Dexamethasone | LC-MS | 15 | ng/ml | 28d | Y | (158) |
| 50 | Efavirenz | LC-MS/MS | 41-102 | ng/ml | NR | N | (145) |
| LC-MS/MS | 0.1 | mg/L | 7d | Y | (156) | ||
| 51 | Emtricitabine | LC-MS/MS | 2.5 | ng/ml | 6 d | Y | (159) |
| 52 | Endoxifen | LC-MS/MS | 0.5 | ng/ml | 20d | Y | (9) |
| 53 | Ertapenem | LC-MS/MS | 0.2 | mg/L | 30d | Y | (54) |
| 54 | Etravirine | LC-MS/MS | 50 | ng/ml | 7d | Y | (160) |
| LC–MS | 11.7 | ng/ml | 3m | Y | (145) | ||
| 55 | Everolimus | LC-MS/MS | 116 | µmol/L | 7d | Y | (118, 120, 153, 155, 161) |
| 56 | Fluoxetine | GC-MS/MS | 1.0-20 | ng/ml | 30d | Y | (70) |
| 57 | Flurbiprofen | LC-MS/MS | 0.35-250 | ng/ml | 5d | Y | (162) |
| 58 | Gammahydroxybutyric acid | GC-MS | 1 | µg/ml | 15d | Y | (67, 163) |
| 59 | HIV protease inhibitors | LC-MS/MS | 0.025-10 | µg/ml | 7d | Y | (164) |
| 60 | Ibuprofen | TLC-MS | 5.0-50 | ng/ml | NR | NR | (143) |
| 61 | Imatinib | LC-MS/MS | 20.5-50 | µg/L | 28d | Y | (157) |
| 62 | Imipramine | LC-MS/MS | 20 | µg/L | 1m | Y | (144) |
| 63 | Linezolid | LC-MS/MS | 0.4 | mg/L | 1m | Y | (165) |
| 64 | Loratadine | LC-MS/MS | 0.2 | ng/ml | 271d | Y | (166) |
| 65 | lopinavir | LC–MS/MS | 0.1 | mg/L | 7d | Y | (156) |
| LC-MS | 11.7 | ng/ml | 3m | Y | (145) | ||
| 66 | Losartan | LC-MS/MS | 1 | ng/ml | 30d | Y | (167) |
| 67 | Mefloquine | LC-MS/MS | 2.5 | nmol/L | 3w | Y | (168) |
| 68 | Midazolam | LC-MS/MS | 0.35-250 | ng/ml | 5d | Y | (162) |
| 69 | MK-1775 (Wee1 inhibitor) | HILIC-MS/MS | 2 | ng/ml | 14m | Y | (169) |
| 70 | N-desmethyltamoxifen | LC-MS/MS | 0.5 | ng/ml | 20d | Y | (9) |
| 71 | Nevirapine | LC-MS/MS | 41.102 | ng/ml | NR | N | (156) |
| LC-MS/MS | 0.1 | mg/L | 7d | Y | (53) | ||
| 72 | Nilotinib | LC-MS/MS | 2.5-50 | µg/L | 28d | Y | (157) |
| 73 | NIM811 (cyclophilin inhibitor) | LC-MS/MS | 10 | ng/ml | 24h | Y | (170) |
| 74 | Nitisinone | LC-MS/MS | 0.1 | µmol/L | NR | Y | (171) |
| LC-MS/MS | 0.25 | µmol/L | NR | Y | (113) | ||
| 75 | Norfluoxetine | GC-MS/MS | 1.0-20 | ng/ml | 30d | Y | (70) |
| 76 | Nortriptyline | LC-MS/MS | 20 | µg/L | 1m | Y | (144) |
| 77 | O-desmethylvenlafaxine | LC-MS/MS | 20 | µg/L | NR | Y | (172) |
| 78 | Omeprazole | LC-MS/MS | 0.35-250 | ng/ml | 5d | Y | (162) |
| 79 | Oseltamivir | LC-MS/MS | 5 | ng/mL | 7d | Y | (173) |
| 80 | Paclitaxel | LC-MS/MS | 0.2 | ng/ml | 45d | Y | (174) |
| PS-MS | 0.25-0.75 | ng/ml | NR | NR | (7) | ||
| 81 | Paroxetine | GC-MS/MS | 1.0-20 | ng/ml | 30d | Y | (70) |
| LC–MS | 11.7 | ng/ml | 3m | Y | (145) | ||
| 82 | Phenobarbital | LC-MS/MS | 1 | mg/L | 10d | Y | (175) |
| 83 | Phenytoin | LC-MS/MS | 0.3 | mg/L | 30d | Y | (176) |
| 84 | Posaconazole | LC-MS/MS | 5 | ng/ml | 13d | Y | (177) |
| 85 | Proguanil | TLC-MS | 5.0-50 | ng/ml | NR | NR | (143) |
| PS-MS | 0.25-0.75 | ng/ml | NR | NR | (7) | ||
| 86 | Propranolol | LC-MS/MS | 2.5 | µg/L | 30d | Y | (178) |
| 87 | Raltegravir | LC-MS/MS | 0.125 | µg/L | 7d | Y | (179) |
| 88 | Ramipril | LC-HRMS | 0.5-5.0 | ng/ml | 12w | Y | (149) |
| 89 | Reboxetine | GC-MS/MS | 1.0-20 | ng/ml | 30d | Y | (70) |
| 90 | Ribavirin | LC-MS/MS | 0.05 | ng/ml | 140d | Y | (180) |
| 91 | Rifampicin | LC-MS/MS | 0.05-0.15 | mg/L | 2m | Y | (152) |
| 92 | Rifapentine | LC-MS/MS | 51 | ng/ml | 11w | Y | (181) |
| 93 | Rifaximin | LC-MS | 0.1 | ng/ml | 30d | Y | (182) |
| 94 | Ritonavir | LC-MS | 11.7 | ng/ml | 3m | Y | (145) |
| 95 | Rosiglitazone | LC-MS/MS | 0.35-250 | ng/ml | 5d | Y | (162) |
| 96 | Saquinavir | LC–MS | 11.7 | ng/ml | 3m | Y | (145) |
| 97 | Simvastatin | LC-HRMS | 0.5-5.0 | ng/ml | 12w | Y | (149) |
| TLC-MS | 5.0-50 | ng/ml | NR | NR | (143) | ||
| PS-MS | 0.25-0.75 | ng/ml | NR | NR | (7) | ||
| 98 | Sirolimus | LC-MS/MS | 116 | µmol/L | 7d | Y | (118, 120, 153, 155) |
| 99 | Sitamaquine | TLC-MS | 5.0-50 | ng/ml | NR | NR | (143) |
| PS-MS | 0.25-0.75 | ng/ml | NR | NR | (7) | ||
| 100 | Sunitinib | PS-MS | 0.25-0.75 | ng/ml | NR | NR | (7) |
| 101 | Tacrolimus | LC-MS/MS | 1 | µg/L | 20d | Y | (8, 60, 118-120, 153, 155, 183) |
| 102 | Tamoxifen | LC-MS/MS | 0.5 | ng/ml | 20d | Y | (9) |
| 103 | Tenofovir | LC-MS/MS | 2.5 | ng/ml | 6d | Y | (159) |
| 104 | Topiramate | LC-MS/MS | 10 | µg/ml | 194d | Y | (184) |
| 105 | Valproic acid | LC-MS | 10 | µmol/L | 42d | Y | (185) |
| GC-MS | 5 | µmol/L | 21d | Y | (69) | ||
| 106 | Vemurafenib | LC-MS/MS | 1 | µg/ml | NR | Y | (186) |
| 107 | Venlafaxine | LC-MS/MS | 20 | µg/L | NR | Y | (172) |
| 108 | 4-nitrophthalic acid | TLC-MS | 5.0-50 | ng/ml | NR | NR | (143) |
| 109 | 4-hydroxytamoxifen | LC-MS/MS | 0.5 | ng/ml | 20d | Y | (9) |
| Illicit drugs | |||||||
| 110 | Amphetamines | ESI-MS/MS & GC-MS | 2.3-11 | ng/ml | NR | Y | (187) |
| 2D-LC-MS/MS | 5 | ng/ml | 6 m | Y | (188) | ||
| 111 | Caffeine | LC-MS/MS | 0.35-250 | ng/ml | 5d | Y | (162) |
| 112 | Cocainics | ESI-MS/MS & GC-MS | 2.3-11 | ng/ml | NR | Y | (187) |
| 2D-LC-MS/MS | 5 | ng/ml | 6 m | Y | (188) | ||
| 113 | Novel psychoactive substances | LC-ESI-MS/MS | 1.0-10 | ng/ml | 1w | Y | (189) |
| 114 | Opiates | 2D-LC-MS/MS | 5 | ng/ml | 6m | Y | (188) |
| ESI-MS/MS & GC-MS | 2.3-11 | ng/ml | NR | Y | (187) | ||
| 115 | Δ9-tetrahydrocannabinol | LC-MS/MS | 100 | ng/ml | 3m | Y | (190) |
| Drug abuse athletics | |||||||
| 116 | Anabolic steroid esters | LC-MS/MS | 0.1 | ng/ml | 28d | Y | (18) |
| 117 | Centchroman metabolites | LC-MS/MS | 1.5-4.5 | ng/ml | 3m | Y | (191) |
| 118 | Testosterone glucuronides | GC-MS | NR | pg/mL | NR | NR | (17) |
| 119 | Therapeutic proteins | LC-MS | NR | ng/mL | 2w | NR | (192) |
| Chemical exposure | |||||||
| 120 | Benzene oxide-Hb | GC-MS | NR | pmol/g | NR | NR | (193) |
| 121 | Polybrominated diphenylethers | GC-HRMS | 0.05 | ng/ml | 30d | Y | (194) |
Therapeutic and toxicological drug analyses are the most extensively reported DBS-MS applications in the literature (Table 1). These DBS-MS applications, (encompassing both LC-MS/MS and GC-MS techniques) are particularly fit for population-based studies of multiple biomarkers (15, 16). Similarly, DBS-MS applications are now applied in sport related doping tests for the detection of anabolic, ergogenic and masking agents (17-19).
Irrespective of the clinical application, there are specific analytical considerations. Several parameters can impact on the accuracy of DBS measurement (10). The following sections of this review will focus on important considerations for DBS-MS quantification in the pre-analytical, analytical and post-analytical phases.
PRE-ANALYTICAL
The pre-analytical phase of testing incorporates the following processes: 1) blood collection from the patient; 2) its application onto the filter paper; 3) drying; and 4) transport and storage of the DBS sample. In addition to the pre-analytical variables identified for routine blood collection, DBS faces additional challenges, including the quality of the DBS sample (which is subject to sample collection and spotting variations), choice of collection card, collection (bleeding and blotting), transport and storage. Moreover, biological factors such as sample viscosity, haematocrit level and the nature of the target analyte, may lead to variation in sample quality.
To support the quality management of the pre-analytical phase, there are defined recommendations for positive patient identification (20), sample collection of capillary blood (21), choice of filter paper (22), application of the sample onto the filter paper (23) and shipment of the DBS sample (24). An example of a standardised protocol for the DBS pre-analytical process is provided in Table 2.
Table 2.
Example dried blood spot sample collection and transport protocol
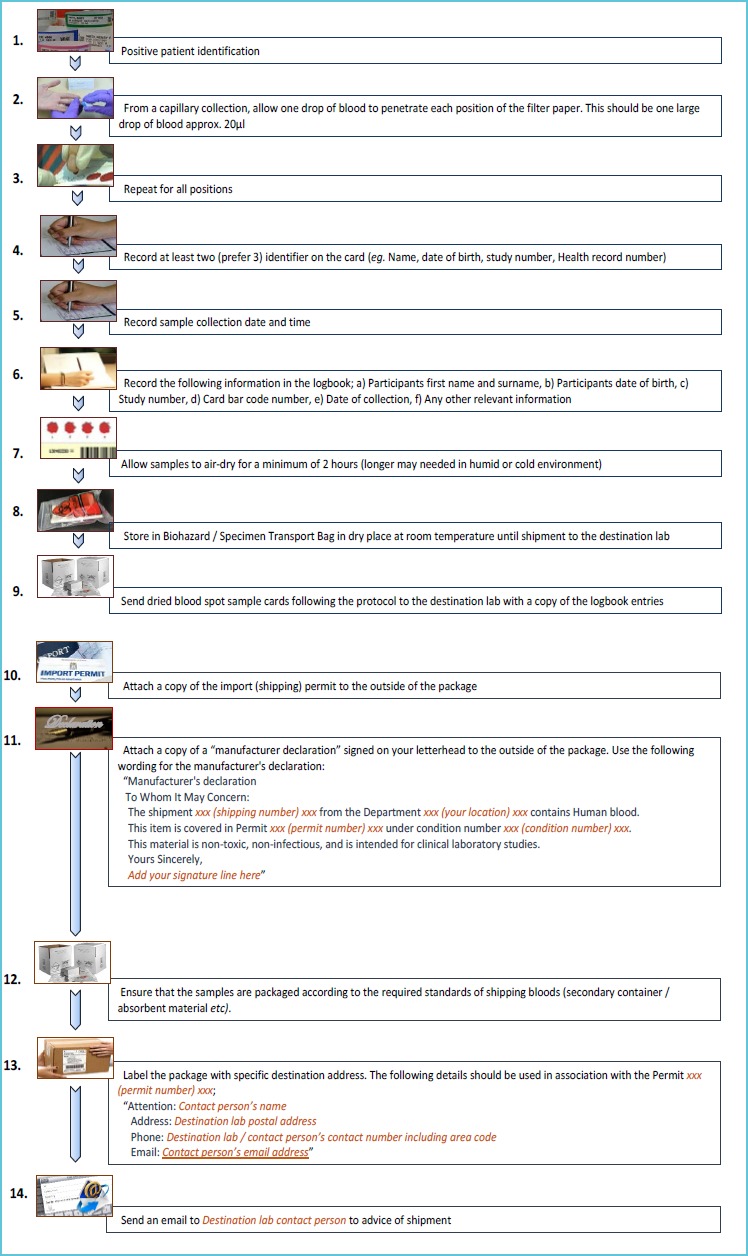 |
Sample collection
The sample collection technique is important for accurate analysis of the DBS. Capillary blood collection is a common approach, as it usually requires less sample volume and is more patient friendly, compared to venepuncture. Both the World Health Organization (WHO) and the United Nations International Children’s Emergency Fund (UNICEF) certify the quality of DBS samples and maintain healthcare workers safety through the provision of guidance manuals and standard operating procedures for DBS sample collection (25, 26). Due to the likelihood of significant sources of artefact formation, specific DBS collection training points are highlighted, including the choice of prick point, lancet type/size, prick depth, pressure rate during blood drop collection, dropping size/speed consistency, uniformity of sample diffusion onto the collection card and DBS contamination due to extended air or light exposure during the drying process. Importantly, WHO highlight that “working with DBS, whole blood or plasma requires the same biohazard safety precautions as whole blood” (26).
Selection of filter paper
Collection of DBS samples is onto one of two types of untreated solid support: pure cotton filter paper and glass microfiber paper. The choice of paper, including its thickness and density, influences the rate of adsorption and dispersion. As an example, the rate of membrane non-specific analyte adsorption is reduced in glass microfibre paper (27). Accordingly, dissimilarities in these solid supports may induce variations in the DBS sample attributes leading to potential differences in analyte stability, commutability, volume per area, and analytical effects (covered later in this review) (28). These DBS specific pre-analytical variables require standardisation and the Clinical and Laboratory Standards Institute (CLSI) offer a guideline, NBS01-6, to support DBS collection (22).
The CLSI guideline recommends the use of two specific collection cards: the Whatman 903 and Ahlstrom 226. Both filter papers are approved by the Food and Drug Administration (FDA), Newborn Screening Quality Assurance Program (NSQAP) and also the Centers for Disease Control and Prevention (CDC) (23).
Sample application to filter paper
Both the Whatman 903 and Ahlstrom 226 cards have a target collection area printed on the paper to indicate and ensure the 50-75 µl sample volume limits (23). The whole blood drop should be spotted onto the mid-point of the collection area to allow for radial dispersion to the designated edge of the spot. This lateral distribution is uneven; as clearly evaluated by autoradiography (29). Usually, the concentration of biomarkers is decreased along the edge of the DBS, while the middle is affected by the volcano effect (paper chromatography effect) and occasionally has a speckled pattern (30). The physical characteristics of the DBS sample are also potentially affected by the patient’s haemoglobin and haematocrit level; which also influences the spreading area of the blotted blood.
Variations in haematocrit will affect the relative plasma percentage of the spot. This is important for analytes predominately found in serum/plasma, as the relative amount of plasma in a disk punched from different spots can vary; and particularly exaggerated when the haematocrit is extremely high or low (31). Whole blood samples with a higher haematocrit tend to distribute to a lesser extent across the filter paper (i.e. smaller blood spot diameter), and consequently the target analyte diffusion distance is shorter. The inverse applies for lower haematocrits. As a result, the determined concentration compared with the “normal” haematocrit sample would be over or under estimated due to the change in the analyte’s distribution and infusion pattern across the blood spot (32, 33). Hence, for accurate quantitation, ideally the patient’s haematocrit needs to be determined, by either a separate capillary drop/sample collected at the time of the DBS collection or directly from the DBS card. Figure 1 provides a visual demonstration of the effect of haematocrit on diffusion.
Figure 1.
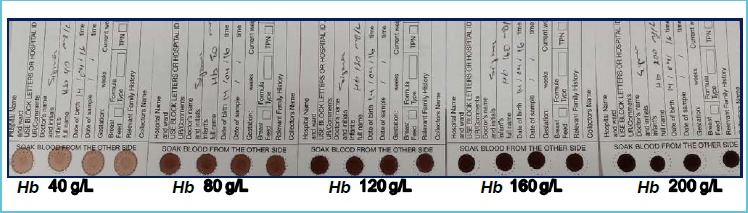
Whole blood samples with different levels of haemoglobin/haematocrit (Hb/Hct) do not diffuse similarly on the collection card
Analytes stability: (storage and transport condition)
DBS samples should be allowed to completely dry before transport and/or storage. It has been demonstrated that rapid drying and storage in low humidity conditions improves the stability of DBS samples (16). The length of time required for air-drying will depend on the local environmental conditions such as air conditioning, room temperature and humidity. DBS drying usually takes from 90 minutes to approximately 4 hours and ideally, the DBS sample should not be left exposed to direct strong sunlight during this period.
The appropriately dried sample can then be placed in an envelope or similar container for the logistically simple and cost effective transport process (16). As the low volume of the dried specimen significantly reduces the risk of infection transmission compared to the other biological samples (34, 35), it can be transported in small lightweight packages that do not require temperature regulation. This negates the often cumbersome and expensive processes associated with transport of liquid biological samples (16).
Once the DBS samples are received at the destination, the size and properties of the DBS samples make storage relatively easy as minimal space is required; and they can often be stored at room temperature.
The stability of the DBS sample does require consideration, as the relevant stability for different analytes on DBS is quite variable. The stability of numerous blood biomarkers on blotting paper at room temperature has been confirmed for a minimum of 7 days (27), several months (pharmaceutical drugs, opiates and nucleic acids) (36, 37), and even more than 20 years (vitamin D) (38). Freezing at -20°C or -80°C has been shown to further increase the stability of DBS samples; often extending the stability from days/months to years (39-41). Further, some reports show that some metabolites have better stability in the form of card-blotted whole blood compared to plasma (42).
Despite these exciting reports of long-term stability, there are many recognized potential influences, in addition to storage time, which could affect stability; including the type of filter paper, light exposure, temperature, humidity as well as the nature of the target analyte. Examples of changes to the collection process to improve stability include: 1) rapidly lowering the pH of the spotted blood sample to extend the stability time of some structurally unstable drugs which degrade during the drying process; and 2) use of ethylenediaminetetraacetic acid (EDTA) as an anticoagulant to preserve and stabilise DBS samples for enzyme activity determination (43, 44). As a result of variations in stability, analyte specific protocols need to be administered for the collection and storage of DBS samples. Table 1 includes a guide to the stability of DBS samples for different analytes found in the literature.
ANALYTICAL CONSIDERATIONS
The solid form of the DBS sample is not compatible with most analytical techniques and requires elution of the sample from the filter paper. Accordingly, the testing process commonly includes three main stages: primary sample preparation, sample pre-treatment and sample analysis. Analysis can be further divided into chromatographic separation and mass spectrometric filtration and detection. The overall quality of this analytical process needs consideration. In this section of the review, we will discuss each of these aspects in turn. Figure 2 provides a general summary of the DBS-MS process.
Figure 2.
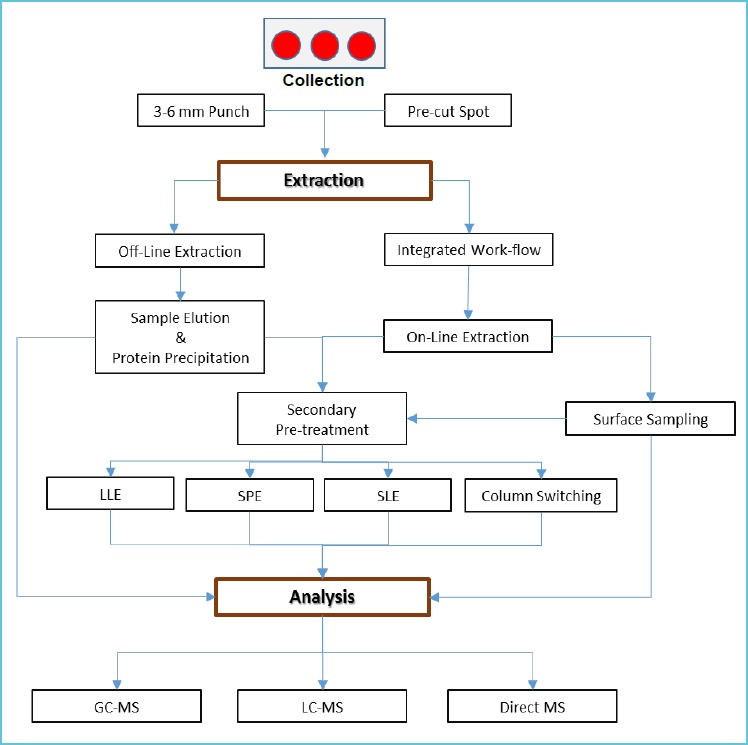
Dried blood spot sample analysis process flowchart for mass spectrometric analysis
Primary sample preparation
The punch
Sample preparation usually starts with deportation of a segment of the DBS from the blotter using a manual or automated puncher. Commonly, to minimise the assay bias due to punch location, it is recommended to consistently take the DBS punch either from the centre or close to the outer edge (45). The punch size may vary from 3 – 6 mm to the whole spot, depending on the method.
Techniques have been developed to overcome the variations in haematocrit and also minimize the labour associated with the sample preparation process. Strategies to overcome the haematocrit effect include:
Pre-cutting or perforating the filter paper as part of the DBS handling procedure to recover the haematocrit effect and eliminate the chance of carry-over between the punches;
Blotting of less whole blood volume (e.g. 10 µl) on the smaller pre-cut disk (3 or 6 mm) and analysis of the whole disk to disregard the haematocrit effect and improve the assay bias, (46-49);
A two-layered polymeric membrane to form a separated secondary dried plasma spot from the whole blood sample to be analysed following solid phase extraction (50);
Development of a novel collection card for DBS sampling, which generates a volumetric plasma sample (2.5 or 5.0 µL) from a non-volumetric application of whole blood sample. The purported advantages of this collection matrix includes enhanced assay reproducibility and selectivity, with a simplified sample extraction procedure and elimination of the haematocrit effect (51).
Elution
For analysis, the analyte of interest firstly requires elution out of the filter paper along with the whole blood matrix by using appropriate extractor buffers. The efficient elution of analytes from the DBS is challenging and there is always a chance of analyte loss due to ineffective extraction; poor sample elution is due to either incomplete extraction or analyte degradation. Hence, the choice of optimal extractor materials may vary from one compound to the other. As an example, pure methanol is considered a generic solvent for drugs of abuse extraction of the blood spot sample (52). Water on the other hand impairs the interaction between cellulose and the target analyte’s hydroxyl groups and the partial addition of water prior to the organic extraction advances the efficiency in certain cases (eg. antivirals) (53). To achieve effective analyte recovery with maximum extraction efficiency, the extraction parameters, including extractor solution mix, duration, temperature and application of additional solvation energy (sonication), need to be optimised for each individual target metabolite (31, 54).
Sample pre-treatment
A variety of sample preparation approaches have been suggested, with selection depending on the molecular characterisation of the target compound. Incorporation of sample pre-treatment methods, either in combination with each other or in isolation, include the classic sample preparation process of: 1) protein precipitation (PPT); 2) liquid-liquid extraction (LLE); 3) solid phase extraction (SPE); 4) supported liquid extraction (SLE); and/or 5) derivatization.
Extraction and derivatization procedures applied manually (or offline) are considerably time consuming and laborious. Whilst derivatization is not required for many plasma based analytes using LC-MS/MS, it is required for many DBS analysis to improve the sensitivity; offsetting the small sample volume. However, as the derivatization process prolongs the overall analysis time it is considered to be a limiting factor and has been a driver for the development of on-line extraction techniques to facilitate the DBS sample pre-analytical treatment.
Automation of sample preparation directly coupled with the LC-MS/MS system has been introduced to improve turn-around time and run cost. PPT is a simple and popular method for automation that has been utilised for TDM (55). However, following a single PPT procedure, salts and other endogenous analytes are still present which may cause ion suppression in the MS process. SPE-LC-MS/MS set-up is designed to facilitate online sample desorption and is a time and cost effective method for DBS analysis (37, 56-59). Compared to PPT, SPE presents an improved sample clean-up (60). There are specific challenges with on-line extraction approaches, in comparison with the off-line extraction methods which may be a significant source of assay bias, including; non-homogenous mixture of internal standard (ISTD) with the analyte in the extract; sample dilution then band broadening in chromatography separation; and/or inadequate focusing of the extract onto the analytical column (10). Accordingly, as part of the method development process, certain strategies are required to eliminate these issues.
Technology has been developed that allows for the direct sampling of the DBS, without the need for a change to liquid or elution. As it is described by the manufacturer, “Liquid Microjunction Surface Sampling Probes (LMJ-SSP) are self-aspirating devices where liquid is pumped to and aspirated away from a surface of interest to a mass spectrometer for integrated extraction and ionization” (61). By utilising the LMJ-SSP technology, the analyte of interest could be directly extracted from the different surfaces and detected by a mass spectrometer in a short time frame with minimum sample handling (62). The LMJ-SSP device coupled with the MS has been utilised for the determination of proteins in the DBS sample (63), direct tandem mass spectrometer for detection of haemoglobin (64), as well as therapeutic drugs (65, 66). Likewise, novel “on spot” direct derivatization approaches provide a time and cost effective alternative sample preparation procedure; a technique introduced to determine thiorphan drug (67, 68).
Sample analysis
Gas chromatography is known as a cheaper and faster separation technique compare to the LC, utilising long and compact capillary columns that enhance resolution. GC-MS analytical techniques often offer a higher separating power and efficient reproducibility compared with LC-MS. Accordingly, GC-MS is still utilised for the determination of volatile biomarkers with low molecular weight and heat resistance fragments. Applications include, steroids, metabolomics and therapeutic drug monitoring studies using DBS samples (17, 67, 69-71) (Table 1). However, the application of GC is limited to gas soluble, volatile and heat resistance small molecules (often derivatization is required to turn non-volatile molecules to volatile), which are gas soluble (72, 73).
LC is preferred for analysis of heat sensitive analytes, with no molecular size restriction. Additionally unlike GC, target compounds co-interact with both mobile phase and solid phase which results in better selectivity (73). The choice of GC or LC instruments depends on the required sensitivity and target analyte characteristics. Despite the fact that the GC-MS provides selectivity, sensitivity and robustness for many DBS analytes, the literature demonstrates that, it is not as popular as LC-MS/MS (Table 1). This is likely to be due to the improved specificity and sensitivity afforded by LC-MS/MS for blood spot analysis; associated with a significantly faster and usually more cost effective process compared to GC-MS (74, 75).Furthermore, advanced UHPLC technology has boosted the resolution of peak separation (even more effective than GC) (72, 73).
By introduction of the two dimensional chromatography (2D-C) tools (applicable on both GC and LC), the separation efficiency, analytical sensitivity, quantitation accuracy and precision have been improved. This 2D-C process has reduced the DBS matrix and carry-over effects, with reports suggesting improved imprecision and bias (76, 77). With the further addition of on-line extraction joined to the 2D-C system, sensitivity and specificity is maximised when coupled with either a triple-quadrupole tandem mass spectrometer or a high-resolution quadrupole time of flight mass spectrometer (QTOF-MS) (60, 78).
The advances in ion source technology have enhanced sensitivity for both polar and non-polar analytes from DBS samples (79-81). Selective/multiple reaction monitoring (SRM/MRM) modes in MS/MS detection, focusing on specific transitions, have advanced the assay specificity remarkably along with improving linearity and limits of detection (10, 82).
Negating the pre-analytical clean-up and chromatographic front end separation, direct MS methods and surface sampling techniques coupled with MS have been used for DBS samples (83). Desorption electrospray ionisation (DESI), direct analysis in real time (DART) and direct electro spray ionisation mass spectrometry (ESI-MS) methods have been utilised in order to generate ions from the surface, thus avoiding purification or derivatization processes (83-90). However, elimination of this primary sample purification and separation may result in loss of sensitivity and precision due to the disintegrated metabolite interferences (89).
Thus, the application of non-paper blotting matrices and online SPE in conjunction with the direct MS methods is recommended to enhance the sensitivity and measurement precision (75, 91). Ultimately, the gains of time efficiency and throughput need to be balanced with achieving the desired method performance.
Quality considerations
There are some important considerations in relation to the method validation and acceptance criteria for DBS analysis. Accordingly, the European bio-analysis forum (EBF) has described the details of the DBS sample analysis methodology to provide specific recommendations for validation of DBS methods (92). The EBF recommendations document includes specific concepts of; collection card variability, sample-to-sample variability, DBS homogeneity, punch point effect, sample stability, blood physical parameters effect, matrix effect, extraction recovery, IS application and internal quality control (IQC) and calibrator preparation. In addition to the detail provided in this document, traceability to the liquid matrix sample, fitness for clinical purpose and reference intervals/decision limits for interpretation require consideration.
Collection cards
To avoid issues of inter-card variability, calibrator and control material should be prepared using identical collection card type/manufacture as the patient samples. If multiple type/manufacturer of cards are used, then a method comparison is required to determine the comparative card stability, extraction recovery and matrix effect (93).
Haematocrit effect
As mentioned earlier, the physical behaviour of blotted whole blood is influenced by different parameters such as; haematocrit level, degree of haemolysis and anticoagulant type (if it is applied). Currently the haematocrit is recognised as the most significant parameter affecting blood spot characteristics (drying time, diffusion and homogeneity) and assay reproducibility. The Haematocrit effect is more substantial when a sub-sample disk punch is analysed, rather than the whole DBS sample. Hence, method validation studies for DBS sample applications also need to include investigations of the impact of haematocrit variation on measurement and assay performance (94).
Application of internal standard
The incorporation of the ISTD to the DBS sample processing is an important step and ideally should occur early in the process. 1) Collection cards pre-treated with the ISTD can be prepared prior to the spotting of the blood. This ensures both the ISTD and nominated compounds have undergone the same matrix and extraction effect. However, this approach logistically might not be practicable when dealing with multiple studies. 2) Commonly manual extraction methods utilise the approach of integrating the ISTD into the DBS elution reagent/extraction solvent. In this method, the ISTD is co-extracted along with the target analyte. 3) Addition of the ISTD into the sample along with extraction/preparation process is another simple alternative. However, as the ISTD is not fully incorporated with the paper matrix, variations in elution recovery are not accounted for. 4) Using on-line DBS sample preparation technology, the ISTD is sprayed on the blood spot before the extraction using the Touch-spray technique (95-97).
Carry-over
Carry-over is a significant issue for DBS-MS analysis. Carry-over may have different sources including: physical card to card contact during storage; spot to spot originated from the puncher head and post-preparation initiated from the instrument (e.g. auto-sampler and analytical column) (92). As the puncher head is re-used, contamination and sample carry-over are notable concerns. To overcome this issue, either a clean-up step or a blank-card punch in between the samples is recommended (98). To investigate the instrumentation carry-over, two injections of sequential blank DBS extracts should be performed after an injection of a sample with the upper limit of quantitation concentration. The response for the first and second blank matrix should not exceed 20% and 5% respectively of the mean response of the lower limit of detection of the analyte of interest (99).
Internal quality control
IQC spiked samples preparation for DBS analysis requires special considerations compared to liquid phase biologic samples. The main challenge of internal QC is keeping the matrix consistent with that of patient’s blood spot sample. Both sample dilution and saturation may occur in spiked sample preparations (93). Ideally fresh non-haemolysed whole blood samples, with a closely matched haematocrit level to the study group, should be chosen for spiking (99). These IQCs should be spotted onto the filter paper and eluted along with the patient samples.
External quality assurance
External quality assurance (EQA) programs are considered essential tools in evaluating the reliability and traceability of the analytical assay as well as monitoring the quality of the laboratory performance. The United Kingdom National External Quality Assessment Service (UK-NEQAS), the European Research Network for evaluation and improvement of screening, Diagnosis and treatment of Inherited disorders of Metabolism (ERNDIM) and the CDC (NSQAP) provide a variety of schemes for DBS-NBS testing. However, there is no further EQA program available to assure the accuracy of DBS analysis outside of NBS. Hence, for most DBS analytes discussed in this review we do not have a peer review process to fully gauge laboratory performance. This represents a gap in harmonisation of analytes measured in this matrix.
Calibration
The preparation of standards for DBS quantitative analysis includes whole blood fortification (replacement of certain amounts of plasma with the artificial plasma containing a known concentration of target analyte) with a set of commercial or in-house calibrator materials before spotting. The percentage of non-aqueous components replaced with plasma needs to be minimised to prevent solvent effects creating inconsistency between spiked samples (calibrators) and patient samples in terms of spot formation (92). Most DBS analytes currently measured (Table 1) are small molecular weight well defined compounds and therefore, in principle, full standardisation with traceability should be achievable. However, in practice the DBS matrix adds an extra level of complexity to the traceability chain and commutability needs to be determined.
POST-ANALYTICAL
Post-analytical concerns of the testing process phase mainly include; result reporting and interpretation, assay total error management and turnaround time (100). The key for the introduction of DBS analysis as a diagnostic tool is the cross validation of the method to a reference plasma/serum based assay. However, it is essential to take into account the fact that the concentration of the biomarkers in whole blood may vary from serum/plasma.
To turn the numerical result generated from the DBS analysis into a clinical meaningful result, a reference interval (RI) or decision point needs to be established. As such DBS specific RI have been developed for many analytes (101-106). For analytes routinely measured in liquid whole blood comparative RI can often be transferred to DBS samples. However, it is often more challenging for DBS analytes that require a comparison to serum for their clinical interpretation.
Some DBS analytes, such as vitamin D, require a conversion to their serum equivalent concentration for interpretation. This requires the development of a robust relationship between the measured analyte in the blotted whole blood and the equivalent serum sample. For this, we need to be able to estimate the equivalent blood volume in the blood spot punch. Two main approaches have been described to evaluate the corresponding serum volume; the application of chemical tracers and geometric calculation (10).
Chemical tracers, such as 125I-albumin, 51Crhaemoglubin and 125I-L-thyroxin, have been used to estimate the equivalent serum volume of the blotted whole blood punch. In this process, the serum volume is determined by comparing radiochemical counts of the blood spot punch with the known volume of whole blood samples in the liquid phase (29). A geometric calculation to evaluate the ratio of the punched disk to the known volume of the entire spotted whole blood with the pre-measured haematocrit has been applied (107, 108). However, application of this approach does not fully take into account the chromatographic effect of the blood distribution on the filter paper, and still raises issues of analytical bias for the final measurement (109); this is why it is recommended that the punch is taken from the centre of the spot. Considering the fact that these common methods are not applicable to archived DBS samples, direct estimation of haemoglobin concentration on the DBS punch is an alternative, but is currently not described in the literature.
CONCLUSIONS
The initial widespread application of dried blood spot was utilised for newborn screening. More recently, it has been applied more broadly and mass spectrometric based applications are the dominant techniques, with liquid chromatography separation being more popular than gas chromatography. Drug monitoring (therapeutic and toxicology) and pharma-toxico-kinetics studies are the major application groups outside of newborn screening. For many analytes, method validation and further bridge experiments are required to develop adjustment rules to convert the results obtained from the dried blood spot analysis to the equivalent serum/plasma values. Likewise, establishment of robust reference intervals or decision limits is essential for dried blood spot analytes. It is envisaged, with the inherent advantages of the alternative dried blood spot sampling technique compared to the classic plasma based strategies, in future micro-sampling based assays will certainly play a substantial role for analysis of biomarkers.
DECLARATIONS
Competing interests: None
Funding: NHMRC - Centre of Excellence in Paediatric Food Allergy and Food-related Immune Disorders - Grant ID 1041420.
Financial Disclosure: Nothing to disclose
Ethical Approval: Not Applicable
Guarantor: Ronda Greaves
Contributorship: Mrs. Zakaria performed the literature search and wrote the first draft of the manuscript. All authors contributed to the writing of the subsequent drafts, reviewed, edited, and approved the final manuscript.
ACKNOWLEDGEMENTS
We wish to thank Mr. Nick Crinis (Austin Pathology, Melbourne Australia), Prof. Daryl Eyles (Queensland Centre for Mental Health Research Developmental Neurobiology laboratory, Queensland, Australia), Dr. Chris Fouracre (Agilent Technologies Australia), and Dr. James Pitt and Mr. Nick Tzanakos (Victorian Clinical Genetics Service, Melbourne Australia) for their support and discussion of various concepts related to dried blood spot-mass spectrometric applications.
Abbreviations for Table 1 (in alphabetical order)
- 2D:
two dimensional
- AnalTech:
analytical technique
- APTDCI-MS:
atmospheric pressure thermal desorption chemical ionization mass spectrometry
- CE:
chemical exposure
- D:
day
- DAA:
drug abuse athletics
- Dab:
drug abuse
- Dad:
drug adherence
- ESI:
electrospray ionisation
- FIA-ESI-MS/MS:
flow Injection analysis-electrospray ionisation tandem mass spectrometry
- FT-ICR-MS:
fourier transform ion cyclotron resonance mass spectrometry
- GC:
gas chromatography
- GC-HRMS:
gas chromatography–high resolution mass spectrometry
- HILIC-MS/MS:
hydrophilic Interaction chromatography tandem mass spectrometry
- ID:
illicit drug
- IDES-MS/MS:
isotope-dilution electrospray tandem mass spectrometry
- LC:
liquid chromatography
- LC-HRMS:
Liquid chromatography–high resolution mass spectrometry
- LLOQ:
lower limit of quantitation
- M:
month
- MetV:
method validation
- MI:
metabolic intermediate
- MS:
mass spectrometry
- NR:
not reported
- PD:
pharmaceutical drugs
- PS-MS:
paper spray mass spectrometry
- PK:
pharmakinetics
- Ref:
reference
- RepU:
reporting unit
- Stab:
stability
- TDM:
therapeutic drug monitoring
- TK:
toxcicokinetics
- TLC-MS:
thin-layer chromatography mass spectrometry
- W:
week
- Y:
yes
REFERENCES
- 1.Bang I. Ein verfahren zur mikrobestimmung von blutbestandteilen. Biochem Ztschr. 1913;49:19-39. [Google Scholar]
- 2.Guthrie KJR. the PKU story: A crusade against mental retardation. Pasadena, USA: Hope Publishing House; 1997. [Google Scholar]
- 3.Guthrie R, Susi A. A simple phenylalanine method for detecting phenylketonuria in large populations of newborn infants. Pediatrics. 1963;32:338-43. [PubMed] [Google Scholar]
- 4.Gruner N, Stambouli O, Ross RS. Dried blood spots-preparing and processing for use in immunoassays and in molecular techniques. Journal of visualized experiments: JoVE. 2015(97). [DOI] [PMC free article] [PubMed] [Google Scholar]
- 5.Sweetman L. Newborn Screening by Tandem Mass Spectrometry. Gaining Experience. 2001;47(11):1937-8. [PubMed] [Google Scholar]
- 6.Han M, Jun SH, Song SH, Park HD, Park KU, Song J. Ultra-performance liquid chromatography/tandem mass spectrometry for determination of sulfatides in dried blood spots from patients with metachromatic leukodystrophy. Rapid Commun Mass Spectrom. 2014;28(6):587-94. [DOI] [PubMed] [Google Scholar]
- 7.Manicke NE, Abu-Rabie P, Spooner N, Ouyang Z, Cooks RG. Quantitative analysis of therapeutic drugs in dried blood spot samples by paper spray mass spectrometry: an avenue to therapeutic drug monitoring. J Am Soc Mass Spectrom. 2011;22(9):1501-7. [DOI] [PubMed] [Google Scholar]
- 8.Li Q, Cao D, Huang Y, Xu H, Yu C, Li Z. Development and validation of a sensitive LC-MS/MS method for determination of tacrolimus on dried blood spots. Biomed Chromatogr. 2013;27(3):327-34. [DOI] [PubMed] [Google Scholar]
- 9.Antunes MV, Raymundo S, de Oliveira V, Staudt DE, Gossling G, Peteffi GP, et al. Ultra-high performance liquid chromatography tandem mass spectrometric method for the determination of tamoxifen, N-desmethyltamoxifen, 4-hydroxytamoxifen and endoxifen in dried blood spots--development, validation and clinical application during breast cancer adjuvant therapy. Talanta. 2015;132:775-84. [DOI] [PubMed] [Google Scholar]
- 10.Wagner M, Tonoli D, Varesio E, Hopfgartner G. The use of mass spectrometry to analyze dried blood spots. Mass spectrometry reviews. 2016;35(3):361-438. [DOI] [PubMed] [Google Scholar]
- 11.Nishio H, Kodama S, Yokoyama S, Matsuo T, Mio T, Sumino K. A simple method to diagnose adrenoleukodystrophy using a dried blood spot on filter paper. Clinica chimica acta; international journal of clinical chemistry. 1986;159(1):77-82. [DOI] [PubMed] [Google Scholar]
- 12.Millington DS, Kodo N, Norwood DL, Roe CR. Tandem mass spectrometry: a new method for acylcarnitine profiling with potential for neonatal screening for inborn errors of metabolism. Journal of inherited metabolic disease. 1990;13(3):321-4. [DOI] [PubMed] [Google Scholar]
- 13.Sosnoff CS, Ann Q, Bernert JT, Jr., Powell MK, Miller BB, Henderson LO, et al. Analysis of benzoylecgonine in dried blood spots by liquid chromatography--atmospheric pressure chemical ionization tandem mass spectrometry. Journal of analytical toxicology. 1996;20(3):179-84. [DOI] [PubMed] [Google Scholar]
- 14.Burnett JE. Dried blood spot sampling: practical considerations and recommendation for use with preclinical studies. Bioanalysis. 2011;3(10):1099-107. [DOI] [PubMed] [Google Scholar]
- 15.Williams SR, McDade TW. The use of dried blood spot sampling in the national social life, health, and aging project. The journals of gerontology Series B, Psychological sciences and social sciences. 2009;64 Suppl 1:i131-6. [DOI] [PMC free article] [PubMed] [Google Scholar]
- 16.McDade TW, Williams S, Snodgrass JJ. What a drop can do: dried blood spots as a minimally invasive method for integrating biomarkers into population-based research. Demography. 2007;44(4):899-925. [DOI] [PubMed] [Google Scholar]
- 17.Peng SH, Segura J, Farre M, de la Torre X. Oral testosterone administration detected by testosterone glucuronidation measured in blood spots dried on filter paper. Clinical chemistry. 2000;46(4):515-22. [PubMed] [Google Scholar]
- 18.Tretzel L, Thomas A, Geyer H, Gmeiner G, Forsdahl G, Pop V, et al. Use of dried blood spots in doping control analysis of anabolic steroid esters. Journal of pharmaceutical and biomedical analysis. 2014;96:21-30. [DOI] [PubMed] [Google Scholar]
- 19.Cox HD, Rampton J, Eichner D. Quantification of insulin-like growth factor-1 in dried blood spots for detection of growth hormone abuse in sport. Analytical and bioanalytical chemistry. 2013;405(6):1949-58. [DOI] [PubMed] [Google Scholar]
- 20.NSQHS. Safety and Quality Improvement Guide Patient Identification and Procedure Matching. Darling-hurst, NSW: Australian Commission on Safety and Quality in Health Care; 2012. p. 28. [Google Scholar]
- 21.Guidelines on Drawing Blood: Best Practices in Phlebotomy, Capillary sampling [Internet]. World Health Organization. 2010. [cited 18/08/2016]. Available from: http://www.ncbi.nlm.nih.gov/books/NBK138654. [PubMed] [Google Scholar]
- 22.Hannon WH. Blood Collection on Filter Paper for Newborn Screening Programs; Approved Standard. Institute CaLS, editor. NBS01-A6. sixth ed: CLSI; 2013. [Google Scholar]
- 23.Hannon WH. NBS01-A6: Blood Collection on Filter Paper for Newborn Screening Programs; Approved Standard—Sixth Edition [Approved Guideline]. Clinical and Laboratory Standards Institute; 2013. [updated. 2013; cited 1-56238-884-3] 52]. [Google Scholar]
- 24.CDC. Laboratory Quality Assurance and Standardization Programs. Guidelines for the Shipment of Dried Blood Spot Specimens. USA: Centers for Disease Control and Prevention; 1993. p. 4. [Google Scholar]
- 25.UNICEF. Taking blood from infants for the HIV DNA PCR test - Standard Operating Procedures. National Health Laboratory Services, UNICEF, De Beers Fund; 2009. p. 25. [Google Scholar]
- 26.WHO. HIV rapid test training package: participant manual Blood Collection and handling- DBS: World Health Organisation; 2005. p. 13. [Google Scholar]
- 27.Lehmann S, Delaby C, Vialaret J, Ducos J, Hirtz C. Current and future use of “dried blood spot” analyses in clinical chemistry. Clinical chemistry and laboratory medicine. 2013;51(10):1897-909. [DOI] [PubMed] [Google Scholar]
- 28.Luckwell J, Danielsson Å, Johnson B, Clegg S, Green M, Pierce A. Applications and Chemistry of Cellulose Papers for Dried Blood Spots. Dried Blood Spots: John Wiley & Sons, Inc.; 2014. p. 332-43. [Google Scholar]
- 29.Mei JV, Zobel SD, Hall EM, De Jesus VR, Adam BW, Hannon WH. Performance properties of filter paper devices for whole blood collection. Bioanalysis. 2010;2(8):1397-403. [DOI] [PubMed] [Google Scholar]
- 30.Ren X, Paehler T, Zimmer M, Guo Z, Zane P, Emmons GT. Impact of various factors on radioactivity distribution in different DBS papers. Bioanalysis. 2010;2(8):1469-75. [DOI] [PubMed] [Google Scholar]
- 31.Vu DH, Koster RA, Alffenaar JW, Brouwers JR, Uges DR. Determination of moxifloxacin in dried blood spots using LC-MS/MS and the impact of the hematocrit and blood volume. Journal of chromatography B, Analytical technologies in the biomedical and life sciences. 2011;879(15-16):1063-70. [DOI] [PubMed] [Google Scholar]
- 32.Peng M, Liu L, Peng L. Evaluation of factors influencing accuracy in the analysis of succinylacetone in dried blood spots. Clinica chimica acta; international journal of clinical chemistry. 2012;413(15-16):1265-9. [DOI] [PubMed] [Google Scholar]
- 33.Holub M, Tuschl K, Ratschmann R, Strnadova KA, Muhl A, Heinze G, et al. Influence of hematocrit and localisation of punch in dried blood spots on levels of amino acids and acylcarnitines measured by tandem mass spectrometry. Clinica chimica acta; international journal of clinical chemistry. 2006;373(1-2):27-31. [DOI] [PubMed] [Google Scholar]
- 34.Parker SP, Cubitt WD. The use of the dried blood spot sample in epidemiological studies. Journal of clinical pathology. 1999;52(9):633-9. [DOI] [PMC free article] [PubMed] [Google Scholar]
- 35.Resnick L, Veren K, Salahuddin SZ, Tondreau S, Markham PD. Stability and inactivation of HTLV-III/LAV under clinical and laboratory environments. Jama. 1986;255(14):1887-91. [PubMed] [Google Scholar]
- 36.Garcia Boy R, Henseler J, Mattern R, Skopp G. Determination of morphine and 6-acetylmorphine in blood with use of dried blood spots. Therapeutic drug monitoring. 2008;30(6):733-9. [DOI] [PubMed] [Google Scholar]
- 37.Wong P, Pham R, Whitely C, Soto M, Salyers K, James C, et al. Application of automated serial blood sampling and dried blood spot technique with liquid chromatography-tandem mass spectrometry for pharmacokinetic studies in mice. Journal of pharmaceutical and biomedical analysis. 2011;56(3):604-8. [DOI] [PubMed] [Google Scholar]
- 38.Heath AK, Williamson EJ, Ebeling PR, Kvaskoff D, Eyles DW, English DR. Measurements of 25-hydroxyvitamin D concentrations in archived dried blood spots are reliable and accurately reflect those in plasma. The Journal of clinical endocrinology and metabolism. 2014;99(9):3319-24. [DOI] [PubMed] [Google Scholar]
- 39.Prentice P, Turner C, Wong MC, Dalton RN. Stability of metabolites in dried blood spots stored at different temperatures over a 2-year period. Bioanalysis. 2013;5(12):1507-14. [DOI] [PubMed] [Google Scholar]
- 40.Michopoulos F, Theodoridis G, Smith CJ, Wilson ID. Metabolite profiles from dried blood spots for metabonomic studies using UPLC combined with orthogonal acceleration ToF-MS: effects of different papers and sample storage stability. Bioanalysis. 2011;3(24):2757-67. [DOI] [PubMed] [Google Scholar]
- 41.Hollegaard MV, Grauholm J, Borglum A, Nyegaard M, Norgaard-Pedersen B, Orntoft T, et al. Genome-wide scans using archived neonatal dried blood spot samples. BMC genomics. 2009;10:297. [DOI] [PMC free article] [PubMed] [Google Scholar]
- 42.D’Arienzo CJ, Ji QC, Discenza L, Cornelius G, Hynes J, Cornelius L, et al. DBS sampling can be used to stabilize prodrugs in drug discovery rodent studies without the addition of esterase inhibitors. Bioanalysis. 2010;2(8):1415-22. [DOI] [PubMed] [Google Scholar]
- 43.Liu G, Ji QC, Jemal M, Tymiak AA, Arnold ME. Approach to evaluating dried blood spot sample stability during drying process and discovery of a treated card to maintain analyte stability by rapid on-card pH modification. Anal Chem. 2011;83(23):9033-8. [DOI] [PubMed] [Google Scholar]
- 44.Elbin CS, Olivova P, Marashio CA, Cooper SK, Cullen E, Keutzer JM, et al. The effect of preparation, storage and shipping of dried blood spots on the activity of five lysosomal enzymes. Clinica Chimica Acta. 2011;412(13–14):1207-12. [DOI] [PubMed] [Google Scholar]
- 45.O’Mara M, Hudson-Curtis B, Olson K, Yueh Y, Dunn J, Spooner N. The effect of hematocrit and punch location on assay bias during quantitative bioanalysis of dried blood spot samples. Bioanalysis. 2011;3(20):2335-47. [DOI] [PubMed] [Google Scholar]
- 46.Youhnovski N, Bergeron A, Furtado M, Garofolo F. Precut dried blood spot (PCDBS): an alternative to dried blood spot (DBS) technique to overcome hematocrit impact. Rapid Commun Mass Spectrom. 2011;25(19):2951-8. [DOI] [PubMed] [Google Scholar]
- 47.Li F, Zulkoski J, Fast D, Michael S. Perforated dried blood spots: a novel format for accurate microsampling. Bioanalysis. 2011;3(20):2321-33. [DOI] [PubMed] [Google Scholar]
- 48.Li F, Ploch S, Fast D, Michael S. Perforated dried blood spot accurate microsampling: the concept and its applications in toxicokinetic sample collection. Journal of mass spectrometry: JMS. 2012;47(5):655-67. [DOI] [PubMed] [Google Scholar]
- 49.Zheng N, Yuan L, Ji QC, Mangus H, Song Y, Frost C, et al. “Center punch” and “whole spot” bioanalysis of apixaban in human dried blood spot samples by UHPLC-MS/MS. Journal of chromatography B, Analytical technologies in the biomedical and life sciences. 2015;988:66-74. [DOI] [PubMed] [Google Scholar]
- 50.Li Y, Henion J, Abbott R, Wang P. The use of a membrane filtration device to form dried plasma spots for the quantitative determination of guanfacine in whole blood. Rapid Commun Mass Spectrom. 2012;26(10):1208-12. [DOI] [PubMed] [Google Scholar]
- 51.Shimadzu S. Noviplex Cards: Shimadzu Oceania; 2016. [cited 2016 04/08/2016]. Available from: https://shimadzu.com.au/noviplex-cards. [Google Scholar]
- 52.Odoardi S, Anzillotti L, Strano-Rossi S. Simplifying sample pretreatment: application of dried blood spot (DBS) method to blood samples, including postmortem, for UHPLC-MS/MS analysis of drugs of abuse. Forensic science international. 2014;243:61-7. [DOI] [PubMed] [Google Scholar]
- 53.Nirogi R, Kandikere V, Komarneni P, Aleti R, Padala N, Kalaikadhiban I, et al. Exploring dried blood spot sampling technique for simultaneous quantification of antiretrovirals: lamivudine, stavudine and nevirapine in a rodent pharmacokinetic study. Biomed Chromatogr. 2012;26(12):1472-81. [DOI] [PubMed] [Google Scholar]
- 54.la Marca G, Giocaliere E, Villanelli F, Malvagia S, Funghini S, Ombrone D, et al. Development of an UPLC-MS/MS method for the determination of antibiotic ertapenem on dried blood spots. Journal of pharmaceutical and biomedical analysis. 2012;61:108-13. [DOI] [PubMed] [Google Scholar]
- 55.Koseki N, Nakashima A, Nagae Y, Masuda N. Simultaneous quantitative determination of cyclosporine A and its three main metabolites (AM1, AM4N and AM9) in human blood by liquid chromatography/mass spectrometry using a rapid sample processing method. Rapid Commun Mass Spectrom. 2006;20(5):733-40. [DOI] [PubMed] [Google Scholar]
- 56.Li Y, Henion J, Abbott R, Wang P. Semi-automated direct elution of dried blood spots for the quantitative determination of guanfacine in human blood. Bioanalysis. 2012;4(12):1445-56. [DOI] [PubMed] [Google Scholar]
- 57.Deglon J, Thomas A, Daali Y, Lauer E, Samer C, Desmeules J, et al. Automated system for on-line desorption of dried blood spots applied to LC/MS/MS pharmacokinetic study of flurbiprofen and its metabolite. Journal of pharmaceutical and biomedical analysis. 2011;54(2):359-67. [DOI] [PubMed] [Google Scholar]
- 58.Miller JHt, Poston PA, Karnes HT. Direct analysis of dried blood spots by in-line desorption combined with high-resolution chromatography and mass spectrometry for quantification of maple syrup urine disease biomarkers leucine and isoleucine. Analytical and bioanalytical chemistry. 2011;400(1):237-44. [DOI] [PubMed] [Google Scholar]
- 59.Clark GT, Haynes JJ. Utilization of DBS within drug discovery: a simple 2D-LC-MS/MS system to minimize blood- and paper-based matrix effects from FTA elute DBS. Bioanalysis. 2011;3(11):1253-70. [DOI] [PubMed] [Google Scholar]
- 60.Shokati T, Bodenberger N, Gadpaille H, Schniedewind B, Vinks AA, Jiang W, et al. Quantification of the Immunosuppressant Tacrolimus on Dried Blood Spots Using LC-MS/MS. Journal of visualized experiments: JoVE. 2015(105): e52424. [DOI] [PMC free article] [PubMed] [Google Scholar]
- 61.Prosolia. Liquid Microjunction Surface Sampling IN USA: Prosolia Inc; 2014. [cited 2014 17/10/2016]. Available from: http://www.prosolia.com/liquid-microjunction-surface-sampling. [Google Scholar]
- 62.Van Berkel GJ, Kertesz V, King RC. High-Throughput Mode Liquid Microjunction Surface Sampling Probe. Analytical Chemistry. 2009;81(16):7096-101. [DOI] [PubMed] [Google Scholar]
- 63.Van Berkel GJ, Kertesz V. Continuous-flow liquid microjunction surface sampling probe connected on-line with high-performance liquid chromatography/mass spectrometry for spatially resolved analysis of small molecules and proteins. Rapid Commun Mass Spectrom. 2013;27(12):1329-34. [DOI] [PubMed] [Google Scholar]
- 64.Edwards RL, Creese AJ, Baumert M, Griffiths P, Bunch J, Cooper HJ. Hemoglobin Variant Analysis via Direct Surface Sampling of Dried Blood Spots Coupled with High-Resolution Mass Spectrometry. Analytical Chemistry. 2011;83(6):2265-70. [DOI] [PMC free article] [PubMed] [Google Scholar]
- 65.Gaissmaier T, Siebenhaar M, Todorova V, Hullen V, Hopf C. Therapeutic drug monitoring in dried blood spots using liquid microjunction surface sampling and high resolution mass spectrometry. Analyst. 2016;141(3):892-901. [DOI] [PubMed] [Google Scholar]
- 66.Kertesz V, Van Berkel GJ. Fully automated liquid extraction-based surface sampling and ionization using a chip-based robotic nanoelectrospray platform. Journal of mass spectrometry: JMS. 2010;45(3):252-60. [DOI] [PubMed] [Google Scholar]
- 67.Ingels AS, Lambert WE, Stove CP. Determination of gamma-hydroxybutyric acid in dried blood spots using a simple GC-MS method with direct “on spot” derivatization. Analytical and bioanalytical chemistry. 2010;398(5):2173-82. [DOI] [PubMed] [Google Scholar]
- 68.Mess JN, Taillon MP, Cote C, Garofolo F. Dried blood spot on-card derivatization: an alternative form of sample handling to overcome the instability of thiorphan in biological matrix. Biomed Chromatogr. 2012;26(12):1617-24. [DOI] [PubMed] [Google Scholar]
- 69.Rhoden L, Antunes MV, Hidalgo P, Alvares da Silva C, Linden R. Simple procedure for determination of valproic acid in dried blood spots by gas chromatography-mass spectrometry. Journal of pharmaceutical and biomedical analysis. 2014;96:207-12. [DOI] [PubMed] [Google Scholar]
- 70.Deglon J, Lauer E, Thomas A, Mangin P, Staub C. Use of the dried blood spot sampling process coupled with fast gas chromatography and negative-ion chemical ionization tandem mass spectrometry: application to fluoxetine, norfluoxetine, reboxetine, and paroxetine analysis. Analytical and bioanalytical chemistry. 2010;396(7):2523-32. [DOI] [PubMed] [Google Scholar]
- 71.Kong ST, Lin HS, Ching J, Ho PC. Evaluation of dried blood spots as sample matrix for gas chromatography/mass spectrometry based metabolomic profiling. Anal Chem. 2011;83(11):4314-8. [DOI] [PubMed] [Google Scholar]
- 72.Pitt JJ. Principles and Applications of Liquid Chromatography-Mass Spectrometry in Clinical Biochemistry. The Clinical Biochemist Reviews. 2009;30(1):19-34. [PMC free article] [PubMed] [Google Scholar]
- 73.Miller JM. Chromatography with Mass Spectral Detection (GC/MS and LC/MS). Chromatography: John Wiley & Sons, Inc.; 2009. p. 309-29. [Google Scholar]
- 74.Xu RN, Fan L, Rieser MJ, El-Shourbagy TA. Recent advances in high-throughput quantitative bioanalysis by LC-MS/MS. Journal of pharmaceutical and biomedical analysis. 2007;44(2):342-55. [DOI] [PubMed] [Google Scholar]
- 75.Meesters RJ, Hooff GP. State-of-the-art dried blood spot analysis: an overview of recent advances and future trends. Bioanalysis. 2013;5(17):2187-208. [DOI] [PubMed] [Google Scholar]
- 76.Shushan B. A review of clinical diagnostic applications of liquid chromatography-tandem mass spectrometry. Mass spectrometry reviews. 2010;29(6):930-44. [DOI] [PubMed] [Google Scholar]
- 77.Li F, McMahon C, Li F, Zulkoski J. LC-MS/MS sensitivity enhancement using 2D-SCX/RPLC and its application in the assessment of pharmacokinetics of clonidine in dried blood spots. Bioanalysis. 2011;3(14):1577-86. [DOI] [PubMed] [Google Scholar]
- 78.Oliveira RV, Henion J, Wickremsinhe E. Fully-automated approach for online dried blood spot extraction and bioanalysis by two-dimensional-liquid chromatography coupled with high-resolution quadrupole time-of-flight mass spectrometry. Anal Chem. 2014;86(2):1246-53. [DOI] [PubMed] [Google Scholar]
- 79.Saint-Marcoux F, Sauvage FL, Marquet P. Current role of LC-MS in therapeutic drug monitoring. Analytical and bioanalytical chemistry. 2007;388(7):1327-49. [DOI] [PubMed] [Google Scholar]
- 80.Wu AH, Gerona R, Armenian P, French D, Petrie M, Lynch KL. Role of liquid chromatography-high-resolution mass spectrometry (LC-HR/MS) in clinical toxicology. Clinical toxicology (Philadelphia, Pa). 2012;50(8):733-42. [DOI] [PubMed] [Google Scholar]
- 81.Taylor PJ, Tai CH, Franklin ME, Pillans PI. The current role of liquid chromatography-tandem mass spectrometry in therapeutic drug monitoring of immunosuppressant and antiretroviral drugs. Clinical biochemistry. 2011;44(1):14-20. [DOI] [PubMed] [Google Scholar]
- 82.Keevil BG. The analysis of dried blood spot samples using liquid chromatography tandem mass spectrometry. Clinical biochemistry. 2011;44(1):110-8. [DOI] [PubMed] [Google Scholar]
- 83.Crawford E, Gordon J, Wu J-T, Musselman B, Liu R, Yu S. Direct analysis in real time coupled with dried spot sampling for bioanalysis in a drug-discovery setting. Bioanalysis. 2011;3(11):1217-26. [DOI] [PubMed] [Google Scholar]
- 84.Cody RB, John Dane A. Direct Analysis in Real-Time Ion Source. Encyclopedia of Analytical Chemistry: John Wiley & Sons, Ltd; 2006. [Google Scholar]
- 85.Wang C, Zhu H, Cai Z, Song F, Liu Z, Liu S. Newborn screening of phenylketonuria using direct analysis in real time (DART) mass spectrometry. Analytical and bioanalytical chemistry. 2013;405(10):3159-64. [DOI] [PubMed] [Google Scholar]
- 86.Wild BJ, Green BN, Cooper EK, Lalloz MRA, Erten S, Stephens AD, et al. Rapid Identification of Hemoglobin Variants by Electrospray Ionization Mass Spectrometry. Blood Cells, Molecules, and Diseases. 2001;27(3):691-704. [DOI] [PubMed] [Google Scholar]
- 87.Takáts Z, Wiseman JM, Gologan B, Cooks RG. Mass Spectrometry Sampling Under Ambient Conditions with Desorption Electrospray Ionization. Science. 2004;306(5695):471-3. [DOI] [PubMed] [Google Scholar]
- 88.Wiseman JM, Kennedy JH. Analysis of dried blood spots using DESI mass spectrometry. Methods in molecular biology (Clifton, NJ). 2014;1198:291-7. [DOI] [PubMed] [Google Scholar]
- 89.Wiseman JM, Evans CA, Bowen CL, Kennedy JH. Direct analysis of dried blood spots utilizing desorption electrospray ionization (DESI) mass spectrometry. Analyst. 2010;135(4):720-5. [DOI] [PubMed] [Google Scholar]
- 90.Ranc V, Havlíček V, Bednar P, Lemr K. Nano-desorption electrospray and kinetic method in chiral analysis of drugs in whole human blood samples. European Journal of Mass Spectrometry. 2008;14(6):411-7. [DOI] [PubMed] [Google Scholar]
- 91.Dénes J, Katona M, Hosszú Á, Czuczy N, Takáts Z. Analysis of Biological Fluids by Direct Combination of Solid Phase Extraction and Desorption Electrospray Ionization Mass Spectrometry. Analytical Chemistry. 2009;81(4):1669-75. [DOI] [PubMed] [Google Scholar]
- 92.Timmerman P, White S, Globig S, Ludtke S, Brunet L, Smeraglia J. EBF recommendation on the validation of bioanalytical methods for dried blood spots. Bioanalysis. 2011;3(14):1567-75. [DOI] [PubMed] [Google Scholar]
- 93.Abbott R, Smeraglia J, White S, Luedtke S, Brunet L, Thomas E, et al. Connecting strategies on dried blood spots. Bioanalysis. 2010;2(11):1809-16. [DOI] [PubMed] [Google Scholar]
- 94.Timmerman P, White S, Cobb Z, Woods K, de Vries R, Spooner N, et al. European Bioanalysis Forum continued plans to support liquid microsampling. Bioanalysis. 2014;6(14):1897-900. [DOI] [PubMed] [Google Scholar]
- 95.Abu-Rabie P, Denniff P, Spooner N, Brynjolffssen J, Galluzzo P, Sanders G. Method of applying internal standard to dried matrix spot samples for use in quantitative bioanalysis. Anal Chem. 2011;83(22):8779-86. [DOI] [PubMed] [Google Scholar]
- 96.Meesters R, Hooff G, van Huizen N, Gruters R, Luider T. Impact of internal standard addition on dried blood spot analysis in bioanalytical method development. Bioanalysis. 2011;3(20):2357-64. [DOI] [PubMed] [Google Scholar]
- 97.Zimmer D, Hassler S, Betschart B, Sack S, Fankhauser C, Loppacher M. Internal standard application to dried blood spots by spraying: investigation of the internal standard distribution. Bioanalysis. 2013;5(6):711-9. [DOI] [PubMed] [Google Scholar]
- 98.Heinig K, Bucheli F, Hartenbach R, Gajate-Perez A. Determination of mycophenolic acid and its phenyl glucuronide in human plasma, ultrafiltrate, blood, DBS and dried plasma spots. Bioanalysis. 2010;2(8):1423-35. [DOI] [PubMed] [Google Scholar]
- 99.Li W, Tse FL. Dried blood spot sampling in combination with LC-MS/MS for quantitative analysis of small molecules. Biomed Chromatogr. 2010;24(1):49-65. [DOI] [PubMed] [Google Scholar]
- 100.Hawkins R. Managing the pre- and post-analytical phases of the total testing process. Annals of laboratory medicine. 2012;32(1):5-16. [DOI] [PMC free article] [PubMed] [Google Scholar]
- 101.Müller KB, Rodrigues MD, Pereira VG, Martins AM, D’Almeida V. Reference values for lysosomal enzymes activities using dried blood spots samples - a Brazilian experience. Diagnostic Pathology. 2010;5(1):65. [DOI] [PMC free article] [PubMed] [Google Scholar]
- 102.D’Apolito O, Garofalo D, la Marca G, Dello Russo A, Corso G. Reference intervals for orotic acid in urine, plasma and dried blood spot using hydrophilic interaction liquid chromatography-tandem mass spectrometry. Journal of chromatography B, Analytical technologies in the biomedical and life sciences. 2012;883-884:155-60. [DOI] [PubMed] [Google Scholar]
- 103.Kim B, Lee MN, Park HD, Kim JW, Chang YS, Park WS, et al. Dried blood spot testing for seven steroids using liquid chromatography-tandem mass spectrometry with reference interval determination in the Korean population. Annals of laboratory medicine. 2015;35(6):578-85. [DOI] [PMC free article] [PubMed] [Google Scholar]
- 104.Aldemir O, Ergun P, Gunes S, Koroglu OA, Yalaz M, Kultursay N, et al. Reference intervals of alpha-glycosidase, beta-glycosidase, and alpha-galactosidase in dried blood spot in a Turkish newborn population. European journal of pediatrics. 2013;172(9):1221-7. [DOI] [PubMed] [Google Scholar]
- 105.Schroder TH, Mattman A, Sinclair G, Vallance HD, Lamers Y. Reference interval of methylmalonic acid concentrations in dried blood spots of healthy, term newborns to facilitate neonatal screening of vitamin B12 deficiency. Clinical biochemistry. 2016;49(13-14):973-8. [DOI] [PubMed] [Google Scholar]
- 106.Dietzen DJ, Bennett MJ, Lo SF, Grey VL, Jones PM. Dried Blood Spot Reference Intervals for Steroids and Amino Acids in a Neonatal Cohort of the National Children’s Study. Clinical chemistry. 2016. [DOI] [PubMed] [Google Scholar]
- 107.Denniff P, Spooner N. The effect of hematocrit on assay bias when using DBS samples for the quantitative bioanalysis of drugs. Bioanalysis. 2010;2(8):1385-95. [DOI] [PubMed] [Google Scholar]
- 108.De Kesel PM, Sadones N, Capiau S, Lambert WE, Stove CP. Hemato-critical issues in quantitative analysis of dried blood spots: challenges and solutions. Bioanalysis. 2013;5(16):2023-41. [DOI] [PubMed] [Google Scholar]
- 109.Meesters RJ, Zhang J, van Huizen NA, Hooff GP, Gruters RA, Luider TM. Dried matrix on paper disks: the next generation DBS microsampling technique for managing the hematocrit effect in DBS analysis. Bioanalysis. 2012;4(16):2027-35. [DOI] [PubMed] [Google Scholar]
- 110.Corso G, D’Apolito O, Garofalo D, Paglia G, Dello Russo A. Profiling of acylcarnitines and sterols from dried blood or plasma spot by atmospheric pressure thermal desorption chemical ionization (APTDCI) tandem mass spectrometry. Biochimica et biophysica acta. 2011;1811(11):669-79. [DOI] [PubMed] [Google Scholar]
- 111.Thompson JW, Zhang H, Smith P, Hillman S, Moseley MA, Millington DS. Extraction and analysis of carnitine and acylcarnitines by electrospray ionization tandem mass spectrometry directly from dried blood and plasma spots using a novel autosampler. Rapid Commun Mass Spectrom. 2012;26(21):2548-54. [DOI] [PubMed] [Google Scholar]
- 112.Janzen N, Sander S, Terhardt M, Peter M, Sander J. Fast and direct quantification of adrenal steroids by tandem mass spectrometry in serum and dried blood spots. Journal of chromatography B, Analytical technologies in the biomedical and life sciences. 2008;861(1):117-22. [DOI] [PubMed] [Google Scholar]
- 113.la Marca G, Malvagia S, Materazzi S, Della Bona ML, Boenzi S, Martinelli D, et al. LC-MS/MS method for simultaneous determination on a dried blood spot of multiple analytes relevant for treatment monitoring in patients with tyrosinemia type I. Anal Chem. 2012;84(2):1184-8. [DOI] [PubMed] [Google Scholar]
- 114.Mills KA, Mushtaq I, Johnson AW, Whitfield PD, Clayton PT. A method for the quantitation of conjugated bile acids in dried blood spots using electrospray ionizationmass spectrometry. Pediatric research. 1998;43(3):361-8. [DOI] [PubMed] [Google Scholar]
- 115.Schulze A, Schmidt C, Kohlmuller D, Hoffmann GF, Mayatepek E. Accurate measurement of free carnitine in dried blood spots by isotope-dilution electrospray tandem mass spectrometry without butylation. Clinica chimica acta; international journal of clinical chemistry. 2003;335(1-2):137-45. [DOI] [PubMed] [Google Scholar]
- 116.Primassin S, Spiekerkoetter U. ESI-MS/MS measurement of free carnitine and its precursor gamma-butyrobetaine in plasma and dried blood spots from patients with organic acidurias and fatty acid oxidation disorders. Molecular genetics and metabolism. 2010;101(2-3):141-5. [DOI] [PubMed] [Google Scholar]
- 117.Carducci C, Santagata S, Leuzzi V, Carducci C, Artiola C, Giovanniello T, et al. Quantitative determination of guanidinoacetate and creatine in dried blood spot by flow injection analysis-electrospray tandem mass spectrometry. Clinica chimica acta; international journal of clinical chemistry. 2006;364(1-2):180-7. [DOI] [PubMed] [Google Scholar]
- 118.den Burger JC, Wilhelm AJ, Chahbouni A, Vos RM, Sinjewel A, Swart EL. Analysis of cyclosporin A, tacrolimus, sirolimus, and everolimus in dried blood spot samples using liquid chromatography tandem mass spectrometry. Analytical and bioanalytical chemistry. 2012;404(6-7):1803-11. [DOI] [PubMed] [Google Scholar]
- 119.Koop DR, Bleyle LA, Munar M, Cherala G, Al-Uzri A. Analysis of tacrolimus and creatinine from a single dried blood spot using liquid chromatography tandem mass spectrometry. Journal of chromatography B, Analytical technologies in the biomedical and life sciences. 2013;926:54-61. [DOI] [PMC free article] [PubMed] [Google Scholar]
- 120.Koster RA, Alffenaar JW, Greijdanus B, Uges DR. Fast LC-MS/MS analysis of tacrolimus, sirolimus, everolimus and cyclosporin A in dried blood spots and the influence of the hematocrit and immunosuppressant concentration on recovery. Talanta. 2013;115:47-54. [DOI] [PubMed] [Google Scholar]
- 121.de Boer T, Wieling J, Meulman E, Reuvers M, Renkema G, den Daas I, et al. Application of dried blood spot sampling combined with LC-MS/MS for genotyping and phenotyping of CYP450 enzymes in healthy volunteers. Biomed Chromatogr. 2011;25(10):1112-23. [DOI] [PubMed] [Google Scholar]
- 122.Bartl J, Chrastina P, Krijt J, Hodik J, Peskova K, Kozich V. Simultaneous determination of cystathionine, total homocysteine, and methionine in dried blood spots by liquid chromatography/tandem mass spectrometry and its utility for the management of patients with homocystinuria. Clinica chimica acta; international journal of clinical chemistry. 2014;437:211-7. [DOI] [PubMed] [Google Scholar]
- 123.Bastani NE, Gundersen TE, Blomhoff R. Dried blood spot (DBS) sample collection for determination of the oxidative stress biomarker 8-epi-PGF(2alpha) in humans using liquid chromatography/tandem mass spectrometry. Rapid Commun Mass Spectrom. 2012;26(6):645-52. [DOI] [PubMed] [Google Scholar]
- 124.Ji AJ, Wang H, Ziso-Qejvanaj E, Zheng K, Chung LL, Foley T, et al. A novel approach for quantitation of glucosylceramide in human dried blood spot using LC-MS/MS. Bioanalysis. 2015;7(12):1483-96. [DOI] [PubMed] [Google Scholar]
- 125.Haynes CA, Guerra SL, Fontana JC, DeJesus VR. HPLC-ESI-MS/MS analysis of hemoglobin peptides in tryptic digests of dried-blood spot extracts detects HbS, HbC, HbD, HbE, HbO-Arab, and HbG-Philadelphia mutations. Clinica chimica acta; international journal of clinical chemistry. 2013;424:191-200. [DOI] [PubMed] [Google Scholar]
- 126.Henning S, Mormann M, Peter-Katalinic J, Pohlentz G. Direct analysis of alpha- and beta-chains of hemoglobins from mammalian blood samples by nanoESI mass spectrometry during in-capillary proteolytic digestion. Amino Acids. 2011;41(2):343-50. [DOI] [PubMed] [Google Scholar]
- 127.McCann SJ, Gillingwater S, Keevil BG, Cooper DP, Morris MR. Measurement of total homocysteine in plasma and blood spots using liquid chromatography-tandem mass spectrometry: comparison with the plasma Abbott IMx method. Annals of clinical biochemistry. 2003;40(Pt 2):161-5. [DOI] [PubMed] [Google Scholar]
- 128.Hawwa AF, Albawab A, Rooney M, Wedderburn LR, Beresford MW, McElnay JC. A novel dried blood spot-LC-MS method for the quantification of methotrexate polyglutamates as a potential marker for methotrexate use in children. PloS one. 2014;9(2):e89908. [DOI] [PMC free article] [PubMed] [Google Scholar]
- 129.Schroder TH, Quay TA, Lamers Y. Methylmalonic acid quantified in dried blood spots provides a precise, valid, and stable measure of functional vitamin B-12 status in healthy women. The Journal of nutrition. 2014;144(10):1658-63. [DOI] [PubMed] [Google Scholar]
- 130.Rizzo C, Boenzi S, Inglese R, la Marca G, Muraca M, Martinez TB, et al. Measurement of succinyl-carnitine and methylmalonyl-carnitine on dried blood spot by liquid chromatography-tandem mass spectrometry. Clinica chimica acta; international journal of clinical chemistry. 2014;429:30-3. [DOI] [PubMed] [Google Scholar]
- 131.la Marca G, Canessa C, Giocaliere E, Romano F, Malvagia S, Funghini S, et al. Diagnosis of immunodeficiency caused by a purine nucleoside phosphorylase defect by using tandem mass spectrometry on dried blood spots. The Journal of allergy and clinical immunology. 2014;134(1):155-9. [DOI] [PubMed] [Google Scholar]
- 132.D’Apolito O, Garofalo D, Paglia G, Zuppaldi A, Corso G. Orotic acid quantification in dried blood spots and biological fluids by hydrophilic interaction liquid chromatography tandem mass spectrometry. Journal of separation science. 2010;33(6-7):966-73. [DOI] [PubMed] [Google Scholar]
- 133.Chambers AG, Percy AJ, Hardie DB, Borchers CH. Comparison of proteins in whole blood and dried blood spot samples by LC/MS/MS. J Am Soc Mass Spectrom. 2013;24(9):1338-45. [DOI] [PubMed] [Google Scholar]
- 134.Martin NJ, Bunch J, Cooper HJ. Dried blood spot proteomics: surface extraction of endogenous proteins coupled with automated sample preparation and mass spectrometry analysis. J Am Soc Mass Spectrom. 2013;24(8):1242-9. [DOI] [PMC free article] [PubMed] [Google Scholar]
- 135.Chambers AG, Percy AJ, Yang J, Camenzind AG, Borchers CH. Multiplexed quantitation of endogenous proteins in dried blood spots by multiple reaction monitoring-mass spectrometry. Molecular & cellular proteomics: MCP. 2013;12(3):781-91. [DOI] [PMC free article] [PubMed] [Google Scholar]
- 136.Paglia G, D’Apolito O, Gelzo M, Dello Russo A, Corso G. Direct analysis of sterols from dried plasma/blood spots by an atmospheric pressure thermal desorption chemical ionization mass spectrometry (APTDCI-MS) method for a rapid screening of Smith-Lemli-Opitz syndrome. Analyst. 2010;135(4):789-96. [DOI] [PubMed] [Google Scholar]
- 137.Al-Dirbashi OY, Rashed MS, Jacob M, Al-Ahaideb LY, Al-Amoudi M, Rahbeeni Z, et al. Improved method to determine succinylacetone in dried blood spots for diagnosis of tyrosinemia type 1 using UPLC-MS/MS. Biomed Chromatogr. 2008;22(11):1181-5. [DOI] [PubMed] [Google Scholar]
- 138.Higashi T, Suzuki M, Hanai J, Inagaki S, Min JZ, Shimada K, et al. A specific LC/ESI-MS/MS method for determination of 25-hydroxyvitamin D3 in neonatal dried blood spots containing a potential interfering metabolite, 3-epi-25-hydroxyvitamin D3. Journal of separation science. 2011;34(7):725-32. [DOI] [PubMed] [Google Scholar]
- 139.Hoeller U, Baur M, Roos FF, Brennan L, Daniel H, Fallaize R, et al. Application of dried blood spots to determine vitamin D status in a large nutritional study with unsupervised sampling: the Food4Me project. The British journal of nutrition. 2016;115(2):202-11. [DOI] [PubMed] [Google Scholar]
- 140.Larkin EK, Gebretsadik T, Koestner N, Newman MS, Liu Z, Carroll KN, et al. Agreement of blood spot card measurements of vitamin D levels with serum, whole blood specimen types and a dietary recall instrument. PloS one. 2011;6(1):e16602. [DOI] [PMC free article] [PubMed] [Google Scholar]
- 141.Newman MS, Brandon TR, Groves MN, Gregory WL, Kapur S, Zava DT. A liquid chromatography/tandem mass spectrometry method for determination of 25-hydroxy vitamin D2 and 25-hydroxy vitamin D3 in dried blood spots: a potential adjunct to diabetes and cardiometabolic risk screening. Journal of diabetes science and technology. 2009;3(1):156-62. [DOI] [PMC free article] [PubMed] [Google Scholar]
- 142.Li W, Doherty JP, Kulmatycki K, Smith HT, Tse FL. Simultaneous LC-MS/MS quantitation of acetaminophen and its glucuronide and sulfate metabolites in human dried blood spot samples collected by subjects in a pilot clinical study. Bioanalysis. 2012;4(12):1429-43. [DOI] [PubMed] [Google Scholar]
- 143.Abu-Rabie P, Spooner N. Direct quantitative bioanalysis of drugs in dried blood spot samples using a thin-layer chromatography mass spectrometer interface. Anal Chem. 2009;81(24):10275-84. [DOI] [PubMed] [Google Scholar]
- 144.Berm EJ, Paardekooper J, Brummel-Mulder E, Hak E, Wilffert B, Maring JG. A simple dried blood spot method for therapeutic drug monitoring of the tricyclic antidepressants amitriptyline, nortriptyline, imipramine, clomipramine, and their active metabolites using LC-MS/MS. Talanta. 2015;134:165-72. [DOI] [PubMed] [Google Scholar]
- 145.D’Avolio A, Simiele M, Siccardi M, Baietto L, Sciandra M, Bonora S, et al. HPLC-MS method for the quantification of nine anti-HIV drugs from dry plasma spot on glass filter and their long term stability in different conditions. Journal of pharmaceutical and biomedical analysis. 2010;52(5):774-80. [DOI] [PubMed] [Google Scholar]
- 146.ter Heine R, Rosing H, van Gorp EC, Mulder JW, van der Steeg WA, Beijnen JH, et al. Quantification of protease inhibitors and non-nucleoside reverse transcriptase inhibitors in dried blood spots by liquid chromatographytriple quadrupole mass spectrometry. Journal of chromatography B, Analytical technologies in the biomedical and life sciences. 2008;867(2):205-12. [DOI] [PubMed] [Google Scholar]
- 147.Lawson G, Cocks E, Tanna S. Quantitative determination of atenolol in dried blood spot samples by LC-HRMS: a potential method for assessing medication adherence. Journal of chromatography B, Analytical technologies in the biomedical and life sciences. 2012;897:72-9. [DOI] [PubMed] [Google Scholar]
- 148.Deglon J, Versace F, Lauer E, Widmer C, Mangin P, Thomas A, et al. Rapid LC-MS/MS quantification of the major benzodiazepines and their metabolites on dried blood spots using a simple and cost-effective sample pretreatment. Bioanalysis. 2012;4(11):1337-50. [DOI] [PubMed] [Google Scholar]
- 149.Lawson G, Cocks E, Tanna S. Bisoprolol, ramipril and simvastatin determination in dried blood spot samples using LC-HRMS for assessing medication adherence. Journal of pharmaceutical and biomedical analysis. 2013;81-82:99-107. [DOI] [PubMed] [Google Scholar]
- 150.Ganz N, Singrasa M, Nicolas L, Gutierrez M, Dingemanse J, Dobelin W, et al. Development and validation of a fully automated online human dried blood spot analysis of bosentan and its metabolites using the Sample Card And Prep DBS System. Journal of chromatography B, Analytical technologies in the biomedical and life sciences. 2012;885-886:50-60. [DOI] [PubMed] [Google Scholar]
- 151.Ansari M, Uppugunduri CR, Deglon J, Theoret Y, Versace F, Gumy-Pause F, et al. A simplified method for busulfan monitoring using dried blood spot in combination with liquid chromatography/tandem mass spectrometry. Rapid Commun Mass Spectrom. 2012;26(12):1437-46. [DOI] [PubMed] [Google Scholar]
- 152.Vu DH, Koster RA, Bolhuis MS, Greijdanus B, Altena RV, Nguyen DH, et al. Simultaneous determination of rifampicin, clarithromycin and their metabolites in dried blood spots using LC-MS/MS. Talanta. 2014;121:9-17. [DOI] [PubMed] [Google Scholar]
- 153.Koster RA, Greijdanus B, Alffenaar JW, Touw DJ. Dried blood spot analysis of creatinine with LC-MS/MS in addition to immunosuppressants analysis. Analytical and bioanalytical chemistry. 2015;407(6):1585-94. [DOI] [PubMed] [Google Scholar]
- 154.Wilhelm AJ, den Burger JC, Vos RM, Chahbouni A, Sinjewel A. Analysis of cyclosporin A in dried blood spots using liquid chromatography tandem mass spectrometry. Journal of chromatography B, Analytical technologies in the biomedical and life sciences. 2009;877(14-15):1595-8. [DOI] [PubMed] [Google Scholar]
- 155.Sadilkova K, Busby B, Dickerson JA, Rutledge JC, Jack RM. Clinical validation and implementation of a multiplexed immunosuppressant assay in dried blood spots by LC-MS/MS. Clinica chimica acta; international journal of clinical chemistry. 2013;421:152-6. [DOI] [PubMed] [Google Scholar]
- 156.Koal T, Burhenne H, Romling R, Svoboda M, Resch K, Kaever V. Quantification of antiretroviral drugs in dried blood spot samples by means of liquid chromatography/tandem mass spectrometry. Rapid Commun Mass Spectrom. 2005;19(21):2995-3001. [DOI] [PubMed] [Google Scholar]
- 157.Kralj E, Trontelj J, Pajic T, Kristl A. Simultaneous measurement of imatinib, nilotinib and dasatinib in dried blood spot by ultra high performance liquid chromatography tandem mass spectrometry. Journal of chromatography B, Analytical technologies in the biomedical and life sciences. 2012;903:150-6. [DOI] [PubMed] [Google Scholar]
- 158.Patel P, Tanna S, Mulla H, Kairamkonda V, Pandya H, Lawson G. Dexamethasone quantification in dried blood spot samples using LC-MS: The potential for application to neonatal pharmacokinetic studies. Journal of chromatography B, Analytical technologies in the biomedical and life sciences. 2010;878(31):3277-82. [DOI] [PubMed] [Google Scholar]
- 159.Zheng JH, Guida LA, Rower C, Castillo-Mancilla J, Meditz A, Klein B, et al. Quantitation of tenofovir and emtricitabine in dried blood spots (DBS) with LC-MS/MS. Journal of pharmaceutical and biomedical analysis. 2014;88:144-51. [DOI] [PMC free article] [PubMed] [Google Scholar]
- 160.Ter Heine R, Rosing H, van Gorp EC, Mulder JW, Beijnen JH, Huitema AD. Quantification of etravirine (TMC125) in plasma, dried blood spots and peripheral blood mononuclear cell lysate by liquid chromatography tandem mass spectrometry. Journal of pharmaceutical and biomedical analysis. 2009;49(2):393-400. [DOI] [PubMed] [Google Scholar]
- 161.van der Heijden J, de Beer Y, Hoogtanders K, Christiaans M, de Jong GJ, Neef C, et al. Therapeutic drug monitoring of everolimus using the dried blood spot method in combination with liquid chromatography-mass spectrometry. Journal of pharmaceutical and biomedical analysis. 2009;50(4):664-70. [DOI] [PubMed] [Google Scholar]
- 162.Lad R. Validation of individual quantitative methods for determination of cytochrome P450 probe substrates in human dried blood spots with HPLC-MS/MS. Bioanalysis. 2010;2(11):1849-61. [DOI] [PubMed] [Google Scholar]
- 163.Ingels AS, De Paepe P, Anseeuw K, Van Sassenbroeck D, Neels H, Lambert W, et al. Dried blood spot punches for confirmation of suspected gamma-hydroxybutyric acid intoxications: validation of an optimized GC-MS procedure. Bioanalysis. 2011;3(20):2271-81. [DOI] [PubMed] [Google Scholar]
- 164.Watanabe K, Varesio E, Hopfgartner G. Parallel ultra high pressure liquid chromatography-mass spectrometry for the quantification of HIV protease inhibitors using dried spot sample collection format. Journal of chromatography B, Analytical technologies in the biomedical and life sciences. 2014;965:244-53. [DOI] [PubMed] [Google Scholar]
- 165.la Marca G, Villanelli F, Malvagia S, Ombrone D, Funghini S, De Gaudio M, et al. Rapid and sensitive LC-MS/MS method for the analysis of antibiotic linezolid on dried blood spot. Journal of pharmaceutical and biomedical analysis. 2012;67-68:86-91. [DOI] [PubMed] [Google Scholar]
- 166.Li W, Doherty J, Moench P, Flarakos J, Tse FL. LC-MS/MS bioanalysis of loratadine (Claritin) in dried blood spot (DBS) samples collected by subjects in a clinical research study. Journal of chromatography B, Analytical technologies in the biomedical and life sciences. 2015;983-984:117-24. [DOI] [PubMed] [Google Scholar]
- 167.Rao RN, Raju SS, Vali RM, Sankar GG. Liquid chromatography-mass spectrometric determination of losartan and its active metabolite on dried blood spots. Journal of chromatography B, Analytical technologies in the biomedical and life sciences. 2012;902:47-54. [DOI] [PubMed] [Google Scholar]
- 168.Geditz MC, Lindner W, Lammerhofer M, Heinkele G, Kerb R, Ramharter M, et al. Simultaneous quantification of mefloquine (+)- and (-)-enantiomers and the carboxy metabolite in dried blood spots by liquid chromatography/tandem mass spectrometry. Journal of chromatography B, Analytical technologies in the biomedical and life sciences. 2014;968:32-9. [DOI] [PubMed] [Google Scholar]
- 169.Xu Y, Fang W, Zeng W, Leijen S, Woolf EJ. Evaluation of dried blood spot (DBS) technology versus plasma analysis for the determination of MK-1775 by HILIC-MS/MS in support of clinical studies. Analytical and bioanalytical chemistry. 2012;404(10):3037-48. [DOI] [PubMed] [Google Scholar]
- 170.Li W, Williams SM, Smith HT, Tse FL. Quantitative analysis of NIM811, a cyclophilin inhibitor, in human dried blood spots using liquid chromatography-tandem mass spectrometry. Journal of chromatography B, Analytical technologies in the biomedical and life sciences. 2011;879(24):2376-82. [DOI] [PubMed] [Google Scholar]
- 171.Sander J, Janzen N, Terhardt M, Sander S, Gokcay G, Demirkol M, et al. Monitoring tyrosinaemia type I: Blood spot test for nitisinone (NTBC). Clinica chimica acta; international journal of clinical chemistry. 2011;412(1-2):134-8. [DOI] [PubMed] [Google Scholar]
- 172.Berm EJ, Brummel-Mulder E, Paardekooper J, Hak E, Wilffert B, Maring JG. Determination of venlafaxine and O-desmethylvenlafaxine in dried blood spots for TDM purposes, using LC-MS/MS. Analytical and bioanalytical chemistry. 2014;406(9-10):2349-53. [DOI] [PubMed] [Google Scholar]
- 173.Hooff GP, Meesters RJ, van Kampen JJ, van Huizen NA, Koch B, Al Hadithy AF, et al. Dried blood spot UHPLC-MS/MS analysis of oseltamivir and oseltamivircarboxylate--a validated assay for the clinic. Analytical and bioanalytical chemistry. 2011;400(10):3473-9. [DOI] [PMC free article] [PubMed] [Google Scholar]
- 174.Nageswara Rao R, Satyanarayana Raju S, Mastan Vali R, Sarma VU, Girija Sankar G. LC-ESI-MS/MS determination of paclitaxel on dried blood spots. Biomed Chromatogr. 2012;26(5):616-21. [DOI] [PubMed] [Google Scholar]
- 175.la Marca G, Malvagia S, Filippi L, Luceri F, Moneti G, Guerrini R. A new rapid micromethod for the assay of phenobarbital from dried blood spots by LC-tandem mass spectrometry. Epilepsia. 2009;50(12):2658-62. [DOI] [PubMed] [Google Scholar]
- 176.Villanelli F, Giocaliere E, Malvagia S, Rosati A, Forni G, Funghini S, et al. Dried blood spot assay for the quantification of phenytoin using Liquid Chromatography-Mass Spectrometry. Clinica chimica acta; international journal of clinical chemistry. 2015;440:31-5. [DOI] [PubMed] [Google Scholar]
- 177.Reddy TM, Tama CI, Hayes RN. A dried blood spots technique based LC-MS/MS method for the analysis of posaconazole in human whole blood samples. Journal of chromatography B, Analytical technologies in the biomedical and life sciences. 2011;879(30):3626-38. [DOI] [PubMed] [Google Scholar]
- 178.Della Bona ML, Malvagia S, Villanelli F, Giocaliere E, Ombrone D, Funghini S, et al. A rapid liquid chromatography tandem mass spectrometry-based method for measuring propranolol on dried blood spots. Journal of pharmaceutical and biomedical analysis. 2013;78-79:34-8. [DOI] [PubMed] [Google Scholar]
- 179.Ter Heine R, Hillebrand MJ, Rosing H, van Gorp EC, Mulder JW, Beijnen JH, et al. Quantification of the HIV-integrase inhibitor raltegravir and detection of its main metabolite in human plasma, dried blood spots and peripheral blood mononuclear cell lysate by means of high-performance liquid chromatography tandem mass spectrometry. Journal of pharmaceutical and biomedical analysis. 2009;49(2):451-8. [DOI] [PubMed] [Google Scholar]
- 180.Jimmerson LC, Zheng JH, Bushman LR, MacBrayne CE, Anderson PL, Kiser JJ. Development and validation of a dried blood spot assay for the quantification of ribavirin using liquid chromatography coupled to mass spectrometry. Journal of chromatography B, Analytical technologies in the biomedical and life sciences. 2014;944:18-24. [DOI] [PMC free article] [PubMed] [Google Scholar]
- 181.Parsons TL, Marzinke MA, Hoang T, Bliven-Sizemore E, Weiner M, Mac Kenzie WR, et al. Quantification of rifapentine, a potent antituberculosis drug, from dried blood spot samples using liquid chromatographic-tandem mass spectrometric analysis. Antimicrob Agents Chemother. 2014;58(11):6747-57. [DOI] [PMC free article] [PubMed] [Google Scholar]
- 182.Rao RN, Vali RM, Ramachandra B, Maurya PK. Rapid determination of rifaximin on dried blood spots by LC-ESI-MS. Biomed Chromatogr. 2011;25(11):1201-7. [DOI] [PubMed] [Google Scholar]
- 183.Hoogtanders K, van der Heijden J, Christiaans M, Edelbroek P, van Hooff JP, Stolk LM. Therapeutic drug monitoring of tacrolimus with the dried blood spot method. Journal of pharmaceutical and biomedical analysis. 2007;44(3):658-64. [DOI] [PubMed] [Google Scholar]
- 184.Popov TV, Maricic LC, Prosen H, Voncina DB. Development and validation of dried blood spots technique for quantitative determination of topiramate using liquid chromatography-tandem mass spectrometry. Biomed Chromatogr. 2013;27(8):1054-61. [DOI] [PubMed] [Google Scholar]
- 185.Pohanka A, Mahindi M, Masquelier M, Gustafsson LL, Beck O. Quantification of valproic acid in dried blood spots. Scand J Clin Lab Invest. 2014;74(7):648-52. [DOI] [PubMed] [Google Scholar]
- 186.Nijenhuis CM, Rosing H, Schellens JH, Beijnen JH. Quantifying vemurafenib in dried blood spots using high-performance LC-MS/MS. Bioanalysis. 2014;6(23): 3215-24. [DOI] [PubMed] [Google Scholar]
- 187.Antelo-Dominguez A, Cocho JA, Tabernero MJ, Bermejo AM, Bermejo-Barrera P, Moreda-Pineiro A. Simultaneous determination of cocaine and opiates in dried blood spots by electrospray ionization tandem mass spectrometry. Talanta. 2013;117:235-41. [DOI] [PubMed] [Google Scholar]
- 188.Saussereau E, Lacroix C, Gaulier JM, Goulle JP. Online liquid chromatography/tandem mass spectrometry simultaneous determination of opiates, cocainics and amphetamines in dried blood spots. Journal of chromatography B, Analytical technologies in the biomedical and life sciences. 2012;885-886:1-7. [DOI] [PubMed] [Google Scholar]
- 189.Ambach L, Hernandez Redondo A, Konig S, Weinmann W. Rapid and simple LC-MS/MS screening of 64 novel psychoactive substances using dried blood spots. Drug testing and analysis. 2014;6(4):367-75. [DOI] [PubMed] [Google Scholar]
- 190.Mercolini L, Mandrioli R, Sorella V, Somaini L, Giocondi D, Serpelloni G, et al. Dried blood spots: liquid chromatography-mass spectrometry analysis of Delta9-tetrahydrocannabinol and its main metabolites. J Chromatogr A. 2013;1271(1):33-40. [DOI] [PubMed] [Google Scholar]
- 191.Lal J, Sharma N. Simultaneous quantification of centchroman and its 7-demethylated metabolite in rat dried blood spot samples using LC-MS/MS. Biomed Chromatogr. 2012;26(9):1089-95. [DOI] [PubMed] [Google Scholar]
- 192.Sleczka BG, D’Arienzo CJ, Tymiak AA, Olah TV. Quantitation of therapeutic proteins following direct trypsin digestion of dried blood spot samples and detection by LC-MS-based bioanalytical methods in drug discovery. Bioanalysis. 2012;4(1):29-40. [DOI] [PubMed] [Google Scholar]
- 193.Funk WE, Waidyanatha S, Chaing SH, Rappaport SM. Hemoglobin adducts of benzene oxide in neonatal and adult dried blood spots. Cancer epidemiology, biomarkers & prevention: a publication of the American Association for Cancer Research, cosponsored by the American Society of Preventive Oncology. 2008;17(8):1896-901. [DOI] [PMC free article] [PubMed] [Google Scholar]
- 194.Lu D, Wang D, Ip HS, Barley F, Ramage R, She J. Measurements of polybrominated diphenyl ethers and polychlorinated biphenyls in a single drop of blood. Journal of chromatography B, Analytical technologies in the biomedical and life sciences. 2012;891-892:36-43. [DOI] [PubMed] [Google Scholar]