Abstract
Background
We desired to observe the changes of transforming growth factor-β1/drosophila mothers against decapentaplegic protein (TGF-β1/Smad3) signaling pathway in the hippocampus region of cerebral ischemic stroke rats so that the effects of this pathway on nerve cells can be investigated.
Material/Methods
The ischemic stroke models were built by middle cerebral artery occlusion (MCAO) in vivo and oxygen-glucose deprivation (OGD) in vitro. TGF-β1 and TGF-β1 inhibitors were injected into rat models while TGF-β1, TGF-β1 siRNA, Smad3, and Smad3 siRNA were transfected into cells. Infarct sizes were measured using triphenyltetrazolium chloride (TTC) staining, while the apoptosis rate of cells were calculated by Annexin V-fluorescein isothiocyanate/propidium iodide (Annexin V-FITC/PI) staining. Levels of TGF-β1, Smad3, and Bcl-2 were examined by real-time polymerase chain reaction (RT-PCR), immunohistochemical, and Western blot analysis.
Results
The expressions of TGF-β1/Smad3 signal pathway were significantly increased in both model rats and BV2 cells, whereas the expression of Bcl-2 was down-regulated (P<0.05). The TGF-β1/Smad3 signal pathway exhibited protective effects, including the down-regulation of infarction size in cerebral tissues and the down-regulation of apoptosis rate of BV2 cells by increasing the expression of Bcl-2 (P<0.05). In addition, these effects could be antagonized by the corresponding inhibitors and siRNA (P<0.05).
Conclusions
The TGF-β1/Smad3 signaling pathway was up-regulated once cerebral ischemic stroke was simulated. TGF-β1 may activate the expression of Bcl-2 via Smad3 to suppress the apoptosis of neurons.
MeSH Keywords: Apoptosis; CA1 Region, Hippocampal; Genes, bcl-2; Infarction, Middle Cerebral Artery; Latent TGF-beta Binding Proteins; Smad Proteins
Background
Recent epidemiological data suggest that cerebrovascular disease has a higher morbidity and mortality in China [1]. Approximately 1.6 million people in China die from stroke each year and 75% of stroke patients eventually experience hemiparalysis sequels which significantly affect their quality of life [2]. The main causes of ischemic stroke are atherosclerosis and gradual cholesterol deposition, which can narrow major blood vessels in the body [3,4]. Most effective therapeutic methods of ischemic stroke only can alleviate symptoms and impede the progression of disease. However, damaged necrotic nerve cells resulting from stroke cannot be restored [5]. Therefore, discovering a mechanism that is able to repair ischemic cerebral apoplexy and trigger the regeneration of nerves will have a significant impact on clinical practices.
Transforming growth factor-β (TGF-β) super family is a group of proteins which can regulate cell growth, differentiation, proliferation, and apoptosis [6]. TGF-β super family has 3 different subtypes – TGF-β1, TGF-β2, and TGF-β3 – and their cell surfaces are matched with the corresponding TGF-β receptors (TGF-βR I, II, III) [7]. TGF-β1 was first discovered in human platelets; it is a protein precursor containing 390 amino acids, and it becomes a mature peptide of 112 amino acids after proteolysis [8]. Previous studies indicated that TGF-β1 is associated with gene transcription, biological processes, wound healing, scars, and fibrosis in many diseases such as cancer, hypertension, tissue fibrosis, and cardiovascular disease [9,10]. For instance, Wang et al. indicated that the expression level of TGF-β1 in cerebral apoplexy patient’s serum was lower than in the control group, suggesting that TGF-β1 is an important molecule in the process of ischemic stroke [11]. Although TGF-β1 plays a crucial role in regulating important cellular activities, only a few TGF-β1 activating pathways have been researched and the full mechanism of activation pathways is not well understood [12]. TGF-β1/Smads signaling pathway is one of the most important pathway that activates TGF-β1 [13]. Studies have provided evidence that TGF-β1 must connect to its receptor once it is activated and the signal transduction pathway is mediated by the Smads lipocalin family [14]. Hence, it is suspected that the TGF-β1/Smads signaling pathway may have significant impact on other pathways that regulate biological activities [14].
Smad3 is a subtype of the Smads lipocalin family and it is composed of highly conservative MH1 and MH2, which can directly connect with DNA [15]. The binding sites between Smad3 and DNA contain a sequence of CAGA, which is a common sequence of some promoters [16]. The combination of Smad3 and c-myc promoter GGCGGG sequence may trigger the inhibition of the c-myc transcription of the TGF-β pathway [17]. As a result, Smad3 is essential to immune suppression, which is mediated by TGF-β when transcriptional responses are regulated [18].
Since various diseases have been linked with TGF-β1/Smad3 signaling pathways, Smad3 was selected in our study in order to observe the changes in the TGF-β1/Smad signaling pathway when an ischemic stroke model was established in rats. The present study may illuminate the mechanism of TGF-β1/Smad3 signaling pathways in the process of ischemic stroke.
Material and Methods
Animals
Fifty healthy male adult Sprague Dawley (SD) rats, weighing 230–270 g, were purchased from the Huai’an First People’s Hospital. Rats were housed withy 4 or 5 in a cage with 12 h light/12 h dark cycle. In addition, rats had ad libitum access to food and water during the treatment period. Fifty SD rats were randomly divided into the normal group (Normal), sham-operation group (Sham), model group (Model), TGF-β1 group (TGF-β1), and TGF-β1 inhibitors group (TGF-β1 inhibitors). Each group contained 10 rats. All procedures in this research were approved by the Animal Care Institute and were in accordance with the guidelines of the First People’s Hospital of Changshou City and Huai’an First People’s Hospital.
Stroke model establishment
The middle cerebral artery occlusion (MCAO) models were built using the bolt line method according to previous research [19] and this approach resulted in the embolism of offside cerebral artery in SD rats. In brief, all rats were fasted for 12 h before the operation and drinking water was administrated normally. After being placed in supine position and fastened on the operation table, rats were anesthetized by 3.5% chloral hydrate (0.1 ml/kg, intraperitoneal injection), shaved, and swabbed with iodine ethanol. Then the CCA (common carotid artery) was exposed and isolated, and the MCAO model was carried out using an intraluminal thread. A surgical midline incision was made to expose the ICA (internal carotid artery), ECA (external carotid artery), and right CCA. A nylon suture (heparin-dampened, monofilament, 0.26-mm diameter) was inserted into the right CCA lumen and then was gently injected into the ICA for about 18 mm. Ninety minutes after the injection, nylon sutures were gently removed from the ICA and reperfusion was performed. Finally, we closed the neck incision. An automatic homeothermic blanket control unit was fitted into the rats through surgical procedures in order to monitor and maintain the body temperature of rats at 37°C. Rats with the sham-operation received the same surgical procedures without the insertion of the monofilament nylon suture. Once the cerebral ischemic stroke model was achieved, 50 ul TGF-β1 (0.1 μg/ml) was injected into the hippocampus of rats (TGF-β1 group) whereas 50 ul TGF-β1 inhibitors (0.1 μg/ml) were injected into the hippocampus of rats in the TGF-β1 inhibitors group, according to previous research [20].
Triphenyltetrazolium chloride (TTC) staining for evaluating cerebral infarction
Rats were anesthetized intraperitoneally with sodium pentobarbital (40 mg/kg), and their brains were removed and frozen at −20°C for 30 min. Tissues of frozen forebrains were dissected and coronal sliced into 2-mm slices in adult rat brain matrix (Kent scientific Corporation) using a rodent brain matrix slicer. These tissue slices were stained with 2% 2,3,7-triphenyltetrazolium chloride (TTC, Sigma, USA) for 20 min in dark conditions at 37°C, then they were soaked and scanned in 4% paraformaldehyde phosphate buffer for 1 h. The degree of cerebral infarction was represented by the ratio between the infarct area and the entire brain area. Unstained (white) area was considered as the infract area whereas normal brain tissues were stained in red. The Image J 1.46R software (NIH, USA) enabled us to assess the cerebral infarction status: infarct area (white)/total area.
Immunohistochemistry
The 50-μm paraffin-embedded tissue sections were obtained by the Leica Vibratome slicing system and they were stained according to the corresponding protocols. Each tissue slice was stored at 4°C for use. H2O2 (3%) was incubated with the sections for 30 min at 25°C to remove the endogenous peroxidase activity. After this, sections were washed by TBS-A and TBS-B for 15 min and 30 min, respectively, to block unspecific bindings. Next, samples were incubated with the corresponding primary anti-TGF-β1 and Smad3 antibody (1:800, Covance, USA) at 4°C overnight. Then, excessive antibodies were washed and the appropriate second antibody was incubated with samples for 1 h at 25°C. After that, slices were incubated with the secondary antibodies labeled by horseradish peroxidase (HRP). Lastly, the avidin-biotin horseradish peroxidase system was used to develop sections with diaminobenzidine (DAB) substrate and images were analyzed by use of ImageJ software.
Cell culture
Murine microglial cell line (BV2) was purchased from the Institute of Biochemistry and Cell Biology (Shanghai). Cells were incubated in Dulbecco’s modified Eagle medium (DMEM, Gibco, CA) with the supplement of glutamine (2 mmol/L, Invitrogen), penicillin (200 U/mL, Hyclone), streptomycin (100 μg/mL, Hyclone), and 10% fetal bovine serum at 37°C with 5% CO2.
Oxygen-glucose deprivation (OGD)
BV2 cells in the control group were grown in the complete DMEM medium supplemented with 4.5 g/mL glucose in normoxic conditions (21% O2 and 5% CO2) for 18 h. In the OGD group, BV2 cells were incubated in the DMEM medium without glucose or serum in hypoxia conditions (5% CO2 and 95% N2) for 4 h followed by incubation under normoxic conditions for 14 h.
Cell transfection
Indicated plasmids were transfected into BV2 cells using Lipofectamine 2000 (Invitrogen). Cells were cultured under the control or OGD condition for 4 h once transfection had been carried out for 24 h. Next, cells were transfected with TGF-β1, TGF-β1 siRNA, Smad3, and Smad3 siRNA using Lipofectamine 2000 (Invitrogen) and were grown in the control or OGD condition as mentioned above.
BV2 cells were divided into 6 groups: control group (cells with control condition and transfection of indicated plasmids); OGD group (cells with OGD condition and transfection of indicated plasmids); TGF-β1 group (cells with OGD condition and transfection of TGF-β1); TGF-β1 siRNA group (cells with OGD condition and transfection of TGF-β1 siRNA); Smad3 group (cells with OGD condition and transfection of Smad3), and Smad3 siRNA group (cells with OGD condition and transfection of Smad3 siRNA).
Cell apoptosis assay
Apoptosis rates of cell samples were calculated after cells were stained using the Annexin V-FITC/PI Apoptosis Detection Kit (BD Biosciences) by flow cytometry. Annexin V+ and Prodium Iodide (PI) + cells represented necrosis, Annexin V+ and PI− cells represented apoptosis, while Annexin V− and PI– cells represented normal cells.
RNA isolation and real-time polymerase chain reaction (RT-PCR)
TRIzol reagent kit (Invitrogen) was used to extract total RNA from brain tissues according to the protocol. Real-time reverse transcription-polymerase chain reaction (RT-PCR) was performed using ABI7500 quantitative PCR Amplifier (Applied Biosystems). The primers of TGF-β1 and Smad3 were purchased from the Applied Biosystems and the β-actin was used as the internal reference (the primer sequences are listed in Table 1). The reaction condition was set at 95°C for 10 min, 40 cycles at 95°C for 10 s, 60°C for 20 s, and 72°C for 34 s. The expression levels of target genes were normalized to those of the control gene and were calculated using the method of 2−ΔΔCT. Each experiment was replicated 3 times.
Table 1.
Primer sequences of TGF-β1, Smad3 and β-actin for RT-PCR.
| Gene | Primer sequence | |
|---|---|---|
| TGF-b1 | Sense | 5′-CACCATCCATGACATGAACC-3′ |
| Antisense | 5′-TCATGTTGGACAACTGCTCC-3′ | |
| Smad3 | Sense | 5′-GCTTGGTGAAGAAGCTCAAGAA-3′ |
| Antisense | 5′-GCGTCCATGCTGTGGTTCAT-3′ | |
| b-actin | Sense | 5′-CCTGCCTCTACTGGCGCTGC-3′ |
| Antisense | 5′-GCAGTGGGGACACGGAAGGC-3′ | |
RT-PCR – real time-polymerase chain reaction; TGF-β1 – transforming growth factor-β1; Smad3 – drosophila mothers against decapentaplegic protein 3.
Western blot
Tissues and cells were harvested and lysed by radio immunoprecipitation assay (RIPA) buffer. Total protein was separated and calculated in line with the Bradford method [21]. After this, the total protein was denatured in boiling water, separated through sodium dodecyl sulfate-polyacrylamide gel electrophoresis (SDS-PAGE), and transferred onto polyvinylidene fluoride (PVDF) membranes. The membranes were washed in Tris-Buffered Saline Tween (TBST) with 5% skim milk for 1 h and were then treated with primary antibodies against TGF-β1, Smad3, Bcl-2 (1:500, 1:200, 1:500, respectively, Zhongshan Biology Company, Beijing) at 4°C overnight. After being washed, the membranes were treated with the secondary antibodies (horseradish peroxidase-conjugated goat anti-goat, 1:2000 dilution, Zhongshan Biology Company, Beijing). Samples in which β-actin was set as the endogenous control were processed with enhanced chemiluminescence and quantified by software (Lab Works4.5, Mitov Software).
Statistical analysis
All statistical analyses were performed with SPSS 18.0 software (Chicago, IL, USA). Data are shown in the form of mean ± standard deviation (SD). The 2-tailed t test or 1-way analysis of variance was used for group comparisons and P<0.05 was considered statistically significant.
Results
Results of TTC staining
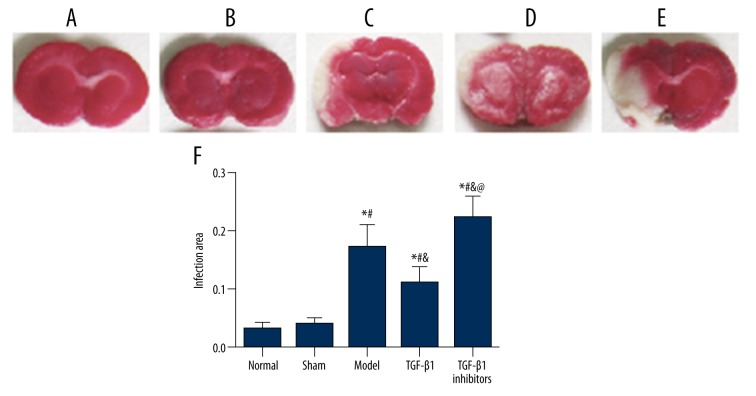
The infarction volume in model rats was measured using TTC staining. As shown in Figure 1, normal tissues were stained in red, while infarction area was stained in white. No infarction area was identified in the normal and sham group, while the model group had significantly higher rate of infarction compared to the normal and sham group (P<0.05). In addition, the TGF-β1 inhibitors group had a higher rate of infarction compared to the model group, while treatment of TGF-β1 decreased the infarction area compared with the model and TGF-β1 inhibitors group (all P<0.05).
Figure 1.
TTC staining showed the area of ischemia-induced injury in cerebral tissues. (A–E) Representative photographs of TTC stained tissue samples of coronal brain in groups of normal (A), sham (B), model (C), TGF-β1 (D), and TGF-β1 inhibitors (E). (F) Summary of infarct size in cerebral brain tissues. Data are presented as mean ±SD. * P<0.05 versus normal group; # P<0.05 versus sham group; & P<0.05 versus model group; @ P<0.05 versus TGF-β1 group.
The expression of TGF-β1 and Smad3 in hippocampus
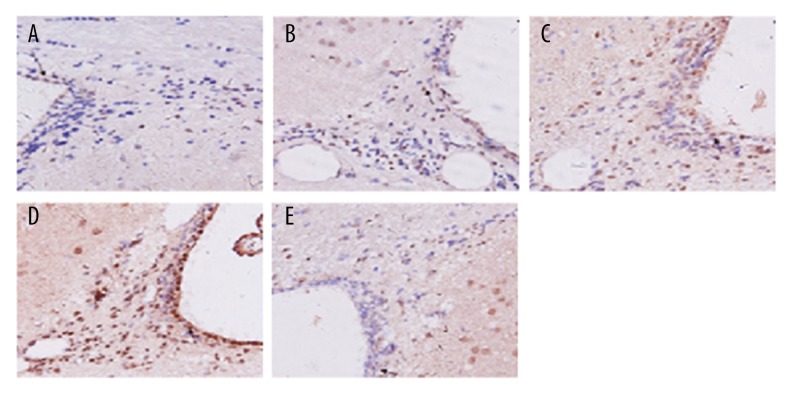
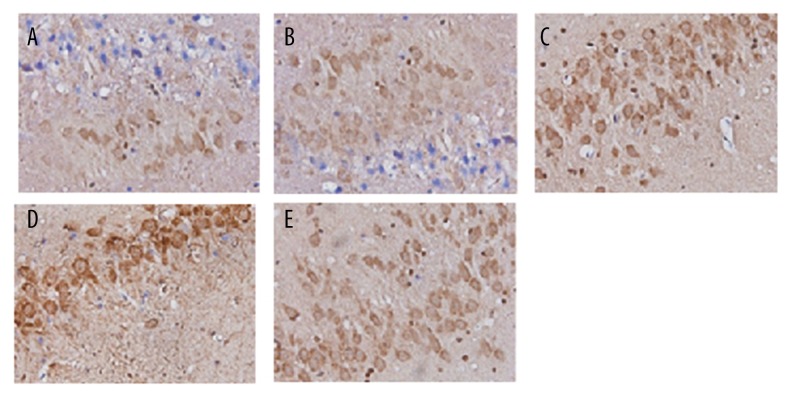
As shown in Figures 2 and 3, TGF-β1 and Smad3 were stained in brown. The proportion of positive area in the model and TGF-β1 group was remarkably higher than that in the normal and sham group, while the positive area in the TGF-β1 inhibitors group was obviously lower than those in the model and TGF-β1 group.
Figure 2.
Immunohistochemical staining with TGF-β1 in brain tissues for groups of normal (A), sham (B), model (C), TGF-β1 (D), and TGF-β1 inhibitors (E).
Figure 3.
Immunohistochemical staining with Smad3 in brain tissues for groups of normal (A), sham (B), model (C), TGF-β1 (D), and TGF-β1 inhibitors (E).
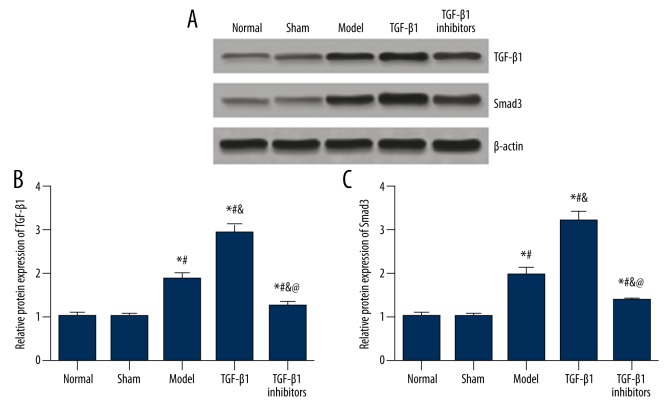
The results of immunohistochemistry were confirmed by the Western blot analysis. As shown in Figure 4, no significant difference in the expressions of TGF-β1 and Smad3 protein was identified between the normal and sham group (P>0.05). Compared with the normal and sham group, the expressions of TGF-β1 and Smad3 were significantly up-regulated in model rats (P<0.05). Treatment of TGF-β1 further increased the expressions of TGF-β1 and Smad3, whereas the TGF-β1 inhibitors group exhibited lower expressions of TGF-β1 and Smad3 than those of the model and TGF-β1 group (all P<0.05).
Figure 4.
Protein expressions of TGF-β1 and Smad3 in brain tissues of model rats. (A) Western blot analysis of TGF-β1 and Smad3 in tissues from different groups with β-actin as internal control. (B, C) Quantitative protein level of TGF-β1 (B) and Smad3 (C) in tissues. Data are presented as mean ±SD. * P<0.05 versus normal group; # P<0.05 versus sham group; & P<0.05 versus model group; @ P<0.05 versus TGF-β1 group.
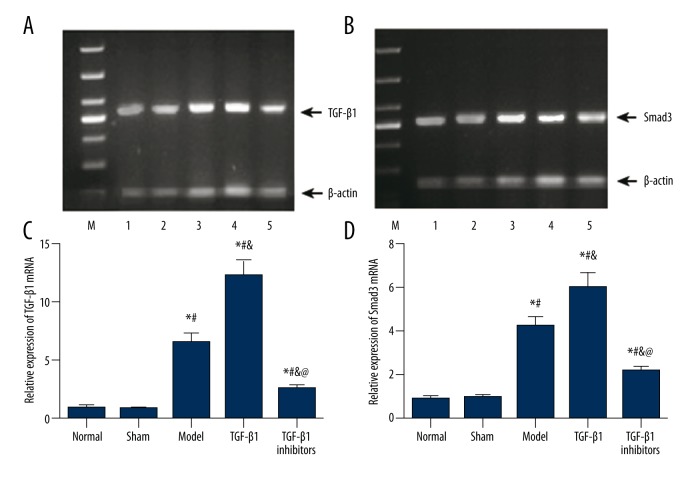
In addition, we calculated the mRNA expressions of TGF-β1 and Smad3 using RT-PCR, and the corresponding results were consistent with those obtained by immunohistochemistry. As shown in Figure 5, no significant difference was found between the normal and sham group (P>0.05). The expression of TGF-β1 and Smad3 mRNA were increased significantly in the model group and the increase appeared to be more significant in the TGF-β1 group (all P<0.05). Lastly, the TGF-β1 inhibitors group exhibited remarkably lower mRNA expression of TGF-β1 and Smad3 compared to the model and TGF-β1 group (all P<0.05).
Figure 5.
MiRNA expressions of TGF-β1 and Smad3 in brain tissues of model rats. (A, B) Gel electrophoresis analysis of TGF-β1 (A) and Smad3 (B) in tissues from different groups with β-actin as internal control. (C, D) Quantitative mRNA level of TGF-β1 (C) and Smad3 (D) in tissues. Data are presented as mean ±SD. * P<0.05 versus normal group; # P<0.05 versus sham group; & P<0.05 versus model group; @ P<0.05 versus TGF-β1 group.
The expression of TGF-β1 and Smad3 in cells
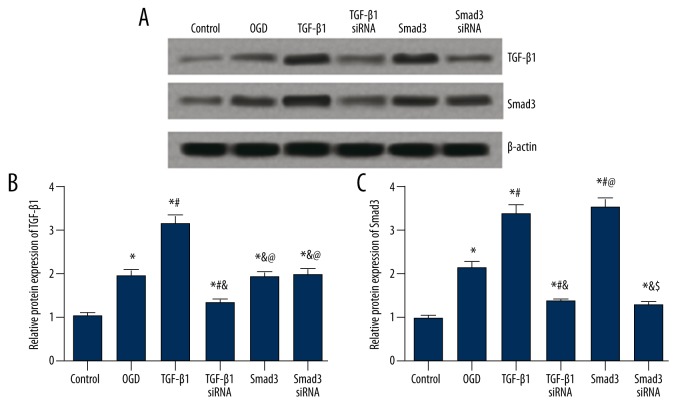
For the expression of TGF-β1 in BV2 cells, the OGD group had a significantly higher level than the control group, and the TGF-β1 group had even higher expression of TGF-β1 than the OGD group (P<0.05, Figure 6A, 6B). Transfection of TGF-β1 siRNA down-regulated the TGF-β1 expression (P<0.05), while transfection of smad3 and smad3 siRNA had no significant effects on the TGF-β1 expression (P>0.05, Figure 6A, 6B).
Figure 6.
Protein expressions of TGF-β1 and Smad3 in BV2 cells after transfection. (A) Western blot analysis of TGF-β1 and Smad3 in cells from different groups with β-actin as internal control. (B, C) Quantitative protein level of TGF-β1 (B) and Smad3 (C) in cells. Data are presented as mean ±SD. * P<0.05 versus control group; # P<0.05 versus OGD group; & P<0.05 versus TGF-β1 group; @ P<0.05 versus TGF-β1 siRNA group; $ P<0.05 versus Smad3 group.
For the expression of Smad3, the OGD group had significantly higher level of Smad3 than the control group, and transfection of TGF-β1 or Smad3 further up-regulated the Smad3 expression (P<0.05, Figure 6A, 6C). In addition, the TGF-β1 siRNA and Smad3 siRNA group displayed lower Smad3 expression than the OGD, TGF-β1, and Smad3 group (P<0.05, Figure 6A, 6C).
Effects of TGF-β1/Smad3 signal pathway on the apoptosis of BV2 cells
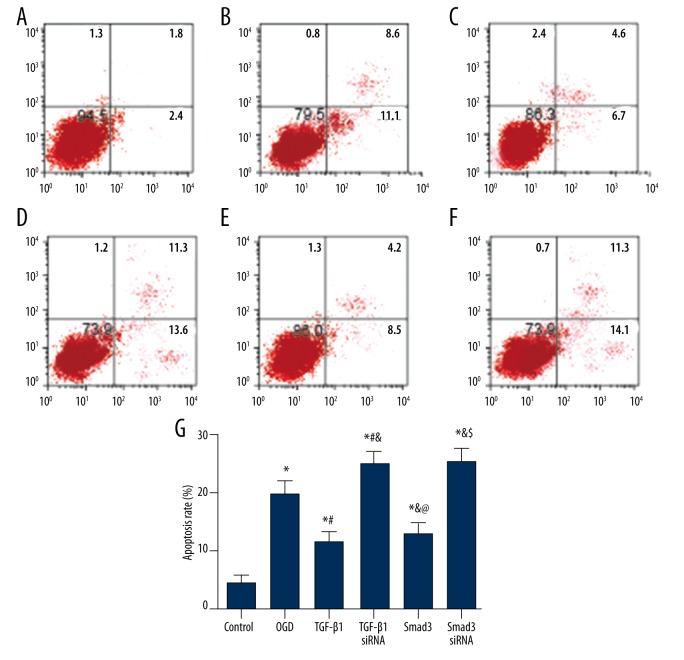
The results of annexin V-FITC/PI staining show the apoptosis status of BV2 cells (Figure 7). Cells in the control group had a lower rate of apoptosis, whereas the OGD group had a significantly higher apoptosis rate than the control group (P<0.05). Groups of TGF-β1 siRNA and Smad3 siRNA had the highest apoptosis rates, while the transfection of TGF-β1 or Smad3 decreased the apoptosis rate of cells compared to the OGD, TGF-β1 siRNA, and Smad3 siRNA group (all P<0.05).
Figure 7.
Apoptosis rate of cells in each group estimated by flow cytometry. (A–F) Distribution of apoptotic cells in groups of control (A), OGD (B), TGF-β1 (C), TGF-β1 siRNA (D), Smad3 (E), and Smad3 siRNA (F). (G) Relative apoptosis rate of cells in each group. Data are presented as mean ±SD for 3 independent experiments. * P<0.05 versus control group; # P<0.05 versus OGD group; & P<0.05 versus TGF-β1 group; @ P<0.05 versus TGF-β1 siRNA group; $ P<0.05 versus Smad3 group.
Effects of TGF-β1/Smad3 signal pathway on the expression of Bcl-2
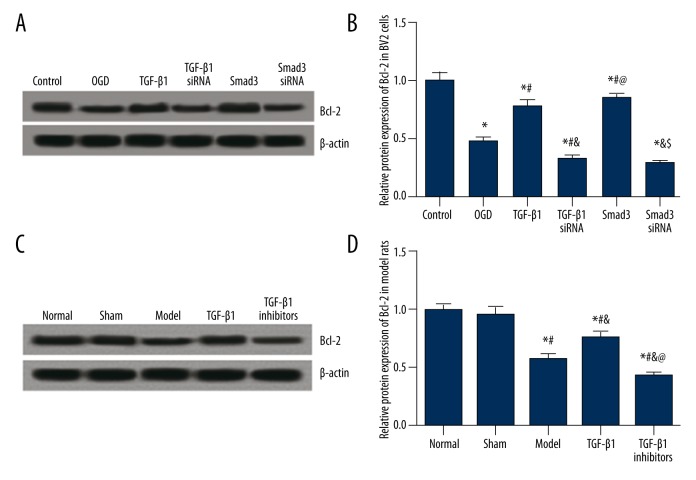
We further detected the expression of Bcl-2 which is an apoptosis inhibitor. For the Bcl-2 expression in BV2 cells, the OGD group exhibited significantly lower Bcl-2 level than the control group, and this trend seemed to be more significant in the TGF-β1 siRNA and Smad3 siRNA group. By contrast, the TGF-β1 and Smad3 group exhibited remarkably higher Bcl-2 expression compared to the OGD group (all P<0.05, Figure 8A, 8B).
Figure 8.
Expression of Bcl-2, both in vitro and in vivo. (A) Western blot analysis of Bcl-2 in cells from different groups with β-actin as internal control. (B) Quantitative protein level of Bcl-2 in cells. Data are presented as mean ±SD for 3 independent experiments. * P<0.05 versus control group; # P<0.05 versus OGD group; & P<0.05 versus TGF-β1 group; @ P<0.05 versus TGF-β1 siRNA group; & P<0.05 versus Smad3 group. (C) Western blot analysis of Bcl-2 in tissues from model rats. (D) Quantitative protein level of Bcl-2 in tissues from model rats. Data are presented as mean ±SD. * P<0.05 versus normal group; # P<0.05 versus sham group; & P<0.05 versus model group; @ P<0.05 versus TGF-β1 group.
The expression of Bcl-2 in model rats had a similar trend to the results in vitro. No significant difference was identified between the normal and sham group (P>0.05). The model group had significantly lower Bcl-2 expression than the normal and sham group (P<0.05, Figure 8C, 8D). The TGF-β1 group had significantly higher Bcl-2 expression compared with the model group whereas the opposite trend was observed in the TGF-β1 inhibitors group (all P<0.05, Figure 8C, 8D).
Discussion
Ischemic stroke is one of the leading causes of severe disability and death in developed countries [22]. The major determinate of pathogenesis of tissue damage in ischemic stroke is cerebral ischemia, which is caused by an acute blockage of the arterial blood flow in brain tissues [23]. As suggested by pathophysiology studies on cerebral ischemia, inflammatory factors are the major causes for neuronal apoptosis [24]. In the present study, we found that the expressions of TGF-β1 and Smad3 were up-regulated in both ischemic cerebral tissues of MCAO rats and OGD-induced BV2 cells, whereas the Bcl-2 expression was down-regulated. Our data indicate that the TGF-β1/Smad3/Bcl-2 pathway, which is another significant cell apoptosis pathway, is involved in the pathological mechanisms of cerebral ischemia stroke.
Members of the TGF family are significant modulators of cell growth, migration, differentiation, and apoptosis, all of which are involved in tissue homeostasis [25]. Among the TGF family members, TGF-β1 is a multifold cytokine influencing various aspects, such as matrix metalloproteinases, integrity of blood-brain barrier and ischemia stroke. Hu et al. found that TGF-β1 can inhibit the expressions of proteinases degrading matrix, such as matrix metalloproteinases [26]. Ronaldson et al. proved that exogenous TGF-β1 can preserve the integrity of the blood-brain barrier under the state of inflammatory pain [27]. In addition, TGF-β1 also has been shown to prevent hippocampal neurons from manifold damages, including neurotoxins, as well as excitotoxic and hypoxia/ischemia damage [28–30]. A recent report demonstrated that TGF-β1 increased neurogenesis both in the hippocampal dentate gyrus of adrenalectomized rats and in neural stem cells cultures [31–33]. Increased expression of TGF-β1 has been reported in different models of brain ischemia experiments [34,35]. Our findings revealed that the transfection of TGF-β1 promoted the expressions of TGF-β1 and Smad3, playing a protective role in ischemic stroke, and this protective role was illustrated by reduced infarct size. On the other hand, the transfection of TGF-β1 inhibitor exhibited the opposite trends. Moreover, the transfection of TGF-β1 and TGF-β1 siRNA in OGD-induced BV2 cells had the same results. Our results are consistent with the results provided by Dobolyi et al., who also suggested that TGF-β1 had a significant role in protecting hippocampal neurons from cerebral ischemia [36].
Smad3, the main molecule located in the downstream of the TGF-β1 signaling pathway, regulates the transcription of specific target genes [37]. Smad3 is diametrically phosphorylated by the activated type I receptors, which allows the combination of common mediator Smads and stimulates their migrations to the nucleus, where they can supply both transcriptional co-sensitizers and co-inhibitors [37]. Some recent studies showed that p-Smad3 levels were negatively correlated with apoptosis in the ischemic region, indicating that Smad3 may regulate the neuroprotective effects of TGF-β1 [20,38]. Our data demonstrated that the transfection of Smad3 promoted the expression of Smad3, while the transfection of Smad3 siRNA had an opposite effect on OGD-induced BV2 cells. Moreover, the transfection of Smad3 and Smad3 siRNA had no significant effect on TGF-β1 expression in OGD-induced BV2 cells, suggesting that Smad3 may be the downstream molecule of TGF-β1.
Some recent studies showed that Smad3 protein is associated with the signal transduction of TGF-β1 in animals and humans, and the TGF-β1/Smad3 signaling pathway is closely correlated with extracellular matrix deposition and cell apoptosis [39,40]. Kouroumichakis et al. suggested that fenofibrate exerts a renoprotective effect at the cellular and molecular level by inhibiting PAI-1 and TGF-β1 in the renal cortex, contributing to fewer extracellular matrix deposits [41]. Li et al. also found that fenofibrate ameliorated diabetic renal damage by suppressing the TGF-β1/Smad3 and NF-κB signaling pathways, which further inhibits fibrosis and inflammation [42]. Annexin V-FITC/PI staining in OGD-induced BV2 cells enabled us to discover that OGD induced cell apoptosis, while the transfection of TGF-β1 or Smad3 decreased the apoptosis rate of cells. The present study demonstrates that the TGF-β1/Smad3 pathway may exert a protective effect on ischemic stroke and this protective effect was characterized by reduced apoptosis rates.
Bcl-2, an anti-apoptosis gene, can enhance cell survival by blocking apoptosis induced by various conditions, including growth factor withdrawal, gamma radiation, and chemotherapeutic medications [25]. Gao et al. demonstrated that the expression of Bcl-2 is decreased in vulnerable neurons of rats after ischemia or fluid percussion damage, suggesting that neuronal apoptosis may be related to the inhibited expression of Bcl-2 protein [43]. Ma et al. suggested that the increased expression of athanogene 3 (BAG3) induced by the up-regulation of Bcl-2 in an in vitro model of anoxia/reoxygenation injury presented protective effects [44]. These studies provide convincing evidence that Bcl-2 expression is a crucial factor for cell apoptosis and neurological phenotype in various types of brain injuries. In our study, we found that the expression of Bcl-2 was up-regulated in the TGF-β1 group of MCAO rats and in the TGF-β1 or Smad3 group of OGD-induced BV2 cells, while the expression of Bcl-2 was down-regulated in the TGF-β1 inhibitors group of MCAO rats and TGF-β1 siRNA or Smad3 siRNA group of OGD-induced BV2 cells. Our results suggest that the protective effect on the lesion process of ischemic stroke contributed by the TGF-β1/Smad3 pathway might be related to the activation of its downstream signaling pathway, which is triggered by the up-regulation of Bcl-2.
Nevertheless, we were unable to demonstrate how the downstream signaling pathway contained in the TGF-β1/Smad3 pathway affected the development of ischemic stroke, and this limitation should be addressed by future research.
Conclusions
Our study indicates that the TGF-β1/Smad3 signaling pathway is up-regulated after cerebral ischemic stroke, and the TGF-β1/Smad3 signaling pathway could play a protective role in ischemic stroke since it may elevate Bcl-2 to activate the corresponding downstream signaling pathways. These protective effects were characterized by decrease in infarct size and apoptosis rate of neurons.
Footnotes
Source of support: Departmental sources
References
- 1.Wiseman SJ, Ralston SH, Wardlaw JM. Cerebrovascular disease in rheumatic diseases: A systematic review and meta-analysis. Stroke. 2016;47:943–50. doi: 10.1161/STROKEAHA.115.012052. [DOI] [PubMed] [Google Scholar]
- 2.Drury-Stewart D, Song M, Mohamad O, et al. Highly efficient differentiation of neural precursors from human embryonic stem cells and benefits of transplantation after ischemic stroke in mice. Stem Cell Res Ther. 2013;4:93. doi: 10.1186/scrt292. [DOI] [PMC free article] [PubMed] [Google Scholar]
- 3.Gonzales-Portillo C, Ishikawa H. Two peas in a pod. Clin Neurol Neurosurg. 2016;142:145–47. doi: 10.1016/j.clineuro.2016.01.001. [DOI] [PubMed] [Google Scholar]
- 4.Wagner ML, Khoury JC, Alwell K, et al. Withdrawal of antithrombotic agents and the risk of stroke. J Stroke Cerebrovasc Dis. 2016;25:902–6. doi: 10.1016/j.jstrokecerebrovasdis.2016.01.006. [DOI] [PMC free article] [PubMed] [Google Scholar]
- 5.Laletin VS, Bykov YN. [General anesthetics as a factor of effective neuroprotection in ischemic stroke models]. Biomed Khim. 2015;61:440–48. doi: 10.18097/PBMC20156104440. [DOI] [PubMed] [Google Scholar]
- 6.Xu F, Liu C, Zhou D, Zhang L. TGF-beta/SMAD pathway and its regulation in hepatic fibrosis. J Histochem Cytochem. 2016;64:157–67. doi: 10.1369/0022155415627681. [DOI] [PMC free article] [PubMed] [Google Scholar]
- 7.Pal G, Lovas G, Dobolyi A. Induction of transforming growth factor beta receptors following focal ischemia in the rat brain. PLoS One. 2014;9:e106544. doi: 10.1371/journal.pone.0106544. [DOI] [PMC free article] [PubMed] [Google Scholar]
- 8.Recouvreux MV, Camilletti MA, Rifkin DB, Diaz-Torga G. The pituitary TGFbeta1 system as a novel target for the treatment of resistant prolactinomas. J Endocrinol. 2016;228:R73–83. doi: 10.1530/JOE-15-0451. [DOI] [PMC free article] [PubMed] [Google Scholar]
- 9.Hinz B. The extracellular matrix and transforming growth factor-beta1: Tale of a strained relationship. Matrix Biol. 2015;47:54–65. doi: 10.1016/j.matbio.2015.05.006. [DOI] [PubMed] [Google Scholar]
- 10.Li FB, Zhao H, Peng KR, et al. Expression of transforming growth factor-beta1 and connective tissue growth factor in congenital biliary atresia and neonatal hepatitis liver tissue. Genet Mol Res. 2016;15(1) doi: 10.4238/gmr.15017217. [DOI] [PubMed] [Google Scholar]
- 11.Okamura T, Morita K, Iwasaki Y, et al. Role of TGF-beta3 in the regulation of immune responses. Clin Exp Rheumatol. 2015;33:S63–69. [PubMed] [Google Scholar]
- 12.Keenan CR, Mok JS, Harris T, et al. Bronchial epithelial cells are rendered insensitive to glucocorticoid transactivation by transforming growth factor-beta1. Respir Res. 2014;15:55. doi: 10.1186/1465-9921-15-55. [DOI] [PMC free article] [PubMed] [Google Scholar]
- 13.Meng XM, Tang PM, Li J, Lan HY. TGF-beta/Smad signaling in renal fibrosis. Front Physiol. 2015;6:82. doi: 10.3389/fphys.2015.00082. [DOI] [PMC free article] [PubMed] [Google Scholar]
- 14.Xie WL, Jiang R, Shen XL, et al. Diosgenin attenuates hepatic stellate cell activation through transforming growth factor-beta/Smad signaling pathway. Int J Clin Exp Med. 2015;8:20323–29. [PMC free article] [PubMed] [Google Scholar]
- 15.Vasilaki E, Siderakis M, Papakosta P, et al. Novel regulation of Smad3 oligomerization and DNA binding by its linker domain. Biochemistry. 2009;48:8366–78. doi: 10.1021/bi9005489. [DOI] [PubMed] [Google Scholar]
- 16.Shi Y, Wang YF, Jayaraman L, Yang H, et al. Crystal structure of a Smad MH1 domain bound to DNA: Insights on DNA binding in TGF-beta signaling. Cell. 1998;94:585–94. doi: 10.1016/s0092-8674(00)81600-1. [DOI] [PubMed] [Google Scholar]
- 17.Frederick JP, Liberati NT, Waddell DS, et al. Transforming growth factor beta-mediated transcriptional repression of c-myc is dependent on direct binding of Smad3 to a novel repressive Smad binding element. Mol Cell Biol. 2004;24:2546–59. doi: 10.1128/MCB.24.6.2546-2559.2004. [DOI] [PMC free article] [PubMed] [Google Scholar]
- 18.Millet C, Zhang YE. Roles of Smad3 in TGF-beta signaling during carcinogenesis. Crit Rev Eukaryot Gene Expr. 2007;17:281–93. doi: 10.1615/critreveukargeneexpr.v17.i4.30. [DOI] [PMC free article] [PubMed] [Google Scholar]
- 19.Longa EZ, Weinstein PR, Carlson S, Cummins R. Reversible middle cerebral artery occlusion without craniectomy in rats. Stroke. 1989;20:84–91. doi: 10.1161/01.str.20.1.84. [DOI] [PubMed] [Google Scholar]
- 20.Wang S, Yin J, Ge M, et al. Transforming growth-beta 1 contributes to isoflurane postconditioning against cerebral ischemia-reperfusion injury by regulating the c-Jun N-terminal kinase signaling pathway. Biomed Pharmacother. 2016;78:280–90. doi: 10.1016/j.biopha.2016.01.030. [DOI] [PubMed] [Google Scholar]
- 21.Qian X, Dong H, Hu X, et al. Analysis of the interferences in quantitation of a site-specifically PEGylated exendin-4 analog by the Bradford method. Anal Biochem. 2014;465:50–52. doi: 10.1016/j.ab.2014.06.009. [DOI] [PubMed] [Google Scholar]
- 22.Mozaffarian D, Benjamin EJ, Go AS, et al. Heart disease and stroke statistics – 2016 update: A report from the American Heart Association. Circulation. 2016;133:e38–e360. doi: 10.1161/CIR.0000000000000350. [DOI] [PubMed] [Google Scholar]
- 23.Zhang P, Li W, Li L, et al. Treatment with edaravone attenuates ischemic brain injury and inhibits neurogenesis in the subventricular zone of adult rats after focal cerebral ischemia and reperfusion injury. Neuroscience. 2012;201:297–306. doi: 10.1016/j.neuroscience.2011.11.005. [DOI] [PubMed] [Google Scholar]
- 24.Macrez R, Ali C, Toutirais O, et al. Stroke and the immune system: From pathophysiology to new therapeutic strategies. Lancet Neurol. 2011;10:471–80. doi: 10.1016/S1474-4422(11)70066-7. [DOI] [PubMed] [Google Scholar]
- 25.Bakhshayesh M, Zaker F, Hashemi M, et al. TGF-beta1-mediated apoptosis associated with SMAD-dependent mitochondrial Bcl-2 expression. Clin Lymphoma Myeloma Leuk. 2012;12:138–43. doi: 10.1016/j.clml.2011.12.001. [DOI] [PubMed] [Google Scholar]
- 26.Hu CP, Dandapat A, Liu Y, et al. Blockade of hypoxia-reoxygenation-mediated collagen type I expression and MMP activity by overexpression of TGF-beta1 delivered by AAV in mouse cardiomyocytes. Am J Physiol Heart Circ Physiol. 2007;293:H1833–38. doi: 10.1152/ajpheart.00488.2007. [DOI] [PubMed] [Google Scholar]
- 27.Ronaldson PT, Demarco KM, Sanchez-Covarrubias L, et al. Transforming growth factor-beta signaling alters substrate permeability and tight junction protein expression at the blood-brain barrier during inflammatory pain. J Cereb Blood Flow Metab. 2009;29:1084–98. doi: 10.1038/jcbfm.2009.32. [DOI] [PMC free article] [PubMed] [Google Scholar]
- 28.Cho H, Joo Y, Kim S, et al. Plasminogen activator inhibitor-1 promotes synaptogenesis and protects against abeta(1–42)-induced neurotoxicity in primary cultured hippocampal neurons. Int J Neurosci. 2013;123:42–49. doi: 10.3109/00207454.2012.724127. [DOI] [PubMed] [Google Scholar]
- 29.Chacon PJ, Rodriguez-Tebar A. Increased expression of the homologue of enhancer-of-split 1 protects neurons from beta amyloid neurotoxicity and hints at an alternative role for transforming growth factor beta1 as a neuroprotector. Alzheimers Res Ther. 2012;4:31. doi: 10.1186/alzrt134. [DOI] [PMC free article] [PubMed] [Google Scholar]
- 30.Ma M, Ma Y, Yi X, et al. Intranasal delivery of transforming growth factor-beta1 in mice after stroke reduces infarct volume and increases neurogenesis in the subventricular zone. BMC Neurosci. 2008;9:117. doi: 10.1186/1471-2202-9-117. [DOI] [PMC free article] [PubMed] [Google Scholar]
- 31.Battista D, Ferrari CC, Gage FH, Pitossi FJ. Neurogenic niche modulation by activated microglia: Transforming growth factor beta increases neurogenesis in the adult dentate gyrus. Eur J Neurosci. 2006;23:83–93. doi: 10.1111/j.1460-9568.2005.04539.x. [DOI] [PubMed] [Google Scholar]
- 32.Buckwalter MS, Yamane M, Coleman BS, et al. Chronically increased transforming growth factor-beta1 strongly inhibits hippocampal neurogenesis in aged mice. Am J Pathol. 2006;169:154–64. doi: 10.2353/ajpath.2006.051272. [DOI] [PMC free article] [PubMed] [Google Scholar]
- 33.Wachs FP, Winner B, Couillard-Despres S, et al. Transforming growth factor-beta1 is a negative modulator of adult neurogenesis. J Neuropathol Exp Neurol. 2006;65:358–70. doi: 10.1097/01.jnen.0000218444.53405.f0. [DOI] [PubMed] [Google Scholar]
- 34.Vincze C, Pal G, Wappler EA, et al. Distribution of mRNAs encoding transforming growth factors-beta1, −2, and −3 in the intact rat brain and after experimentally induced focal ischemia. J Comp Neurol. 2010;518:3752–70. doi: 10.1002/cne.22422. [DOI] [PubMed] [Google Scholar]
- 35.Doyle KP, Cekanaviciute E, Mamer LE, Buckwalter MS. TGFbeta signaling in the brain increases with aging and signals to astrocytes and innate immune cells in the weeks after stroke. J Neuroinflammation. 2010;7:62. doi: 10.1186/1742-2094-7-62. [DOI] [PMC free article] [PubMed] [Google Scholar]
- 36.Dobolyi A, Vincze C, Pal G, Lovas G. The neuroprotective functions of transforming growth factor beta proteins. Int J Mol Sci. 2012;13:8219–58. doi: 10.3390/ijms13078219. [DOI] [PMC free article] [PubMed] [Google Scholar]
- 37.Brown KA, Pietenpol JA, Moses HL. A tale of two proteins: Differential roles and regulation of Smad2 and Smad3 in TGF-beta signaling. J Cell Biochem. 2007;101:9–33. doi: 10.1002/jcb.21255. [DOI] [PubMed] [Google Scholar]
- 38.Katsuno M, Adachi H, Banno H, et al. Transforming growth factor-beta signaling in motor neuron diseases. Curr Mol Med. 2011;11:48–56. doi: 10.2174/156652411794474356. [DOI] [PubMed] [Google Scholar]
- 39.Wang C, Song X, Li Y, et al. Low-dose paclitaxel ameliorates pulmonary fibrosis by suppressing TGF-beta1/Smad3 pathway via miR-140 upregulation. PLoS One. 2013;8:e70725. doi: 10.1371/journal.pone.0070725. [DOI] [PMC free article] [PubMed] [Google Scholar]
- 40.Soumyakrishnan S, Divya T, Kalayarasan S, et al. Daidzein exhibits anti-fibrotic effect by reducing the expressions of Proteinase activated receptor 2 and TGFbeta1/smad mediated inflammation and apoptosis in Bleomycin-induced experimental pulmonary fibrosis. Biochimie. 2014;103:23–36. doi: 10.1016/j.biochi.2014.04.005. [DOI] [PubMed] [Google Scholar]
- 41.Kouroumichakis I, Papanas N, Zarogoulidis P, et al. Fibrates: Therapeutic potential for diabetic nephropathy? Eur J Intern Med. 2012;23:309–16. doi: 10.1016/j.ejim.2011.12.007. [DOI] [PubMed] [Google Scholar]
- 42.Li L, Emmett N, Mann D, Zhao X. Fenofibrate attenuates tubulointerstitial fibrosis and inflammation through suppression of nuclear factor-kappaB and transforming growth factor-beta1/Smad3 in diabetic nephropathy. Exp Biol Med (Maywood) 2010;235:383–91. doi: 10.1258/ebm.2009.009218. [DOI] [PMC free article] [PubMed] [Google Scholar]
- 43.Gao CK, Liu H, Cui CJ, et al. Roles of MicroRNA-195 in cardiomyocyte apoptosis induced by myocardial ischemia-reperfusion injury. J Genet. 2016;95:99–108. doi: 10.1007/s12041-016-0616-3. [DOI] [PubMed] [Google Scholar]
- 44.Ma Y, Gai Y, Yan J, et al. Puerarin attenuates anoxia/reoxygenation injury through enhancing Bcl-2 associated athanogene 3 expression, a modulator of apoptosis and autophagy. Med Sci Monit. 2016;22:977–83. doi: 10.12659/MSM.897379. [DOI] [PMC free article] [PubMed] [Google Scholar]


