Abstract
The purpose of this study is to evaluate the repeatability and reproducibility (R&R) of quantitative ultrasound (QUS) estimates, specifically attenuation coefficient (AC) and backscattering coefficient (BSC), using the same Siemens 3000 clinical ultrasound scanner. Additionally, the purpose of this work is to detail the measurement and analysis methodology. Repeatability is closeness of agreement between measures obtained with the same method under same conditions (same sonographer and same transducer) and reproducibility is closeness of agreement between measures obtained with the same method under different conditions (different sonographers and/or different transducers). Calibrated phantoms were scanned by two sonographers using two transducers in each session for multiple sessions over a period of four months. The phantom scans occurred as part of a clinical QUS liver study in human research participants spanning a spectrum of obesity and liver disease severity. The scanner was adjusted in each participant to obtain the highest quality liver B-mode images prior to acquiring data from the phantoms for which no scanner adjustments were made. The R&R were analyzed and estimated using the unweighted sums of squares ANOVA approach by applying two random effect models. The measurement variance caused by repeatability and reproducibility is small (AC: 2.4–3.2×10⁻⁴ [dB/cm-MHz]2; 10log10BSC: 0.23–0.27 dB2). The reproducibility variance is statistically significantly lower than the repeatability variance. The total R&R was not influenced by phantom properties over a wide range representing those found in liver in vivo.
I. Introduction
The USA Food and Drug Administration defines “biomarker” as “a characteristic that is objectively measured and evaluated as an indicator of normal biological processes, pathogenic processes, or biological responses to a therapeutic intervention”[1]. Quantitative imaging biomarker was a term defined by the Quantitative Imaging Biomarker Alliance (QIBA) as “a numerical characteristic extracted from quantitative imaging and this numerical characteristic has properties of quantitative measurements.”[2]
QIBA has described standardized terminology, experimental study designs and statistical methods to evaluate technical performance of quantitative imaging biomarkers. Characterizing a biomarker requires an indication of its uncertainty, which may combine many components including both systematic and random effects. Repeatability of a quantitative imaging biomarker is derived from the same measurement procedure at a single clinical site with a single scanner and operator on the same patient or object over a short period of time. It represents the measurement precision under a set of conditions of measurement and is thus critical to ensure confidence and consistency in the results. Reproducibility is derived across clinical sites, operators, or scanners on the same patient or object and is important for establishing utility and general applicability of a biomarker for more widespread clinical application. Assessing repeatability and reproducibility (R&R) of a new quantitative biomarker is an essential first step in determining its technical performance as well as establishing confidence in its use for managing patients. The purpose of this study was to evaluate the R&R of quantitative ultrasound (QUS) biomarkers, specifically attenuation coefficient (AC) and backscattering coefficient (BSC), using the same Siemens 3000 clinical ultrasound scanner.
II. Scanning Protocol
This study reports fundamental R&R results in liver tissue-mimicking reference phantoms for a QUS method that is being developed to assess liver status in human subjects with suspected nonalcoholic fatty liver disease [3]. The phantom measurements were made during the execution of the research protocol in the same scanning session as the human liver in vivo examination but the results are of more general applicability to other QUS studies, not just those addressing liver disease. The IRB-approved, HIPPA compliant research study estimates the attenuation coefficient (AC) and backscatter coefficient (BSC) of human liver tissue in vivo using the reference phantom QUS method described below [4]. A clinical ultrasonic imaging system (Siemens S3000, Issaquah, WA) with an Ultrasound Research Interface (URI) is used for data acquisition [5]. The URI has been used in many research studies for a wide variety of ultrasound applications. In this case, it was modified to allow direct RF data acquisition during normal clinical use of the scanner by a single operator button press. The method utilizes a unique form of the spectral difference reference phantom method in which three separate phantoms are employed. The phantoms used in this study (CIRS, Inc., Norfolk, VA) have distinct and homogeneous acoustic properties calibrated a priori that represent the low, intermediate and high ranges of liver AC and BSC estimated from 204 patients in a previous research study [3], [6]. This range of liver values ensures that the R&R data are meaningful in the clinical context of the AC and BSC estimation procedure under investigation.
Two registered diagnostic medical sonographers (A, B), each with more than 15 years’ hospital experience, performed a research protocol for liver assessment using system settings that they optimized for each participant. Radiofrequency (RF) backscattered signals were acquired from the participant at the end of the imaging exam and then also immediately from the three reference phantoms without changing the settings (scan field of view, depth of focus, transmit/receiver gain, time-gain compensation). Following the steps in a programmed electronic protocol, the sonographer first utilized the 4C1 transducer (1–4 MHz nominal) followed by the 6C1HD (1.5–6 MHz nominal) in each session. Scan line density was set to maximum and transmit frequency was set to 4.0 MHz automatically using protocol presets in the system and thus these parameters were constant for every acquisition. Each sonographer performed the research protocol with two transducers twice allowing a short break between in which the participant left and was then repositioned on the scanning table.
III. QUS Methodologies
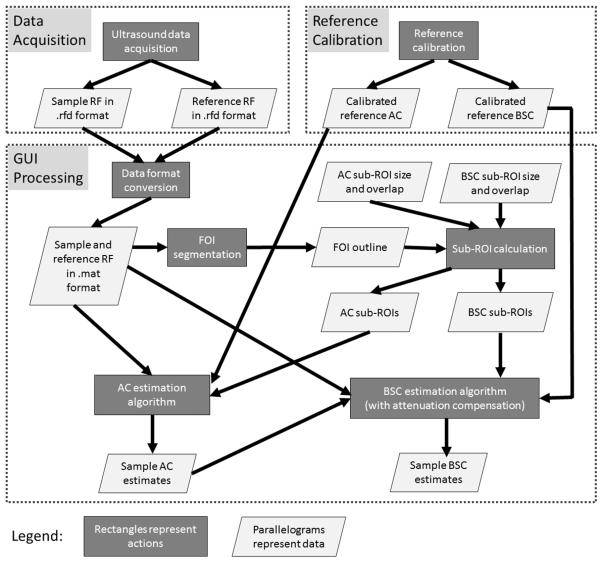
The RF raw data are initially recorded in .rfd format on the Siemens S3000 then are transferred to a PC for offline processing via the Ultrasound Research Interface. The .rfd format is converted into .mat format in MATLAB (The Math-Works, Natick, MA) to allow for further processing using a previously developed MATLAB-based graphical user interface (GUI) that incorporates and standardizes the routines for attenuation coefficient and backscatter coefficient estimation from RF data of the tissue and reference phantoms. The overall QUS processing methodologies are shown in the flow diagram in Figure 1.
Fig. 1.
Flow diagram of overall QUS methodologies
This paper concerns the R&R results for the phantoms. Instead of estimating the attenuation and backscatter coefficients of the liver, for this R&R study the attenuation and backscatter coefficients of each of the phantoms were estimated. Specifically, each of the three phantoms was in turn treated as the sample (the unknown), with one of the other two phantoms serving as the reference for purposes of estimating the attenuation and backscatter coefficients of the sample.
A. Attenuation Coefficient
The attenuation coefficient was estimated from the ultrasonic backscattered RF data using the spectral difference reference phantom method [4]. This frequency-domain method uses the difference in the spectral amplitude at increasing depths to estimate local attenuation from ultrasonic backscatter data. Assuming that the unknown sample within a small region of interest (denoted sub-ROI) is homogeneous and isotropic, the attenuation coefficient (denoted α in dB/cm; later AC will be used to denote the attenuation coefficient slope in dB/cm-MHz) of the unknown sample can be estimated at each frequency component from
| (1) |
where f is the frequency in MHz, the subscripts s and r represent the unknown sample and the reference phantom, respectively, and λ(f) is the slope of the straight line that fits the natural log ratio of sample power spectrum to the reference phantom power spectrum as a function of depth.
To implement the algorithm computationally, a field of interest (FOI) in the B-mode image of the unknown sample is manually segmented. The segmented area is analyzed to yield α and BSC estimates as described below. The FOI is subdivided into overlapping, rectangular sub-ROIs, each of which yields an estimate of αs(f). Each individual sub-ROI is subdivided into overlapping axial sections to obtain the power spectrum at different depths through the sub-ROI, a requirement of the spectral difference method. The size of the sub-ROI for αs(f) estimation was 20 mm × 40 A-lines (axial × lateral), and the length of the rectangular gating function was 7.0 mm. These dimensions yield sub-ROIs that are about 20 pulse lengths axially, as well as a gate length of about 7 pulse lengths. The size of the sub-ROI and the length of the axial sections were chosen according to previous findings using simulated RF echo data [7], [8]. The sub-ROI overlap was set to 50% in the axial and lateral directions [7], [8].
The power spectrum at each depth within each sub-ROI is calculated by gating with a rectangular window and computing a fast Fourier transform. Averaging the power spectra at a particular depth over all scan lines in the sub-ROI yields the power spectral estimate of the sample for that depth. The same algorithm is then repeated automatically on each portion of the reference phantom with the same depth as each corresponding axial section through each corresponding sub-ROI of the sample to obtain the power spectral estimate of the reference phantom. After the power spectra of the unknown sample and the reference phantom are estimated at each depth, αs(f) is estimated using Equation (1) for the sub-ROI. αs(f) estimates from all of the sub-ROIs are averaged together to obtain the mean αs(f) over the bandwidth 2.0–3.6 MHz, the intersection of the −6 dB bandwidths of the two transducers 4C1 and 6C1. Also, the mean αs(f) curve of the unknown sample is fit to the power law form to provide an α value for an arbitrary frequency for attenuation compensation during backscatter coefficient estimation.
B. Backscatter Coefficient
The BSC estimates were obtained using the reference phantom method [4]. The BSC of the unknown sample can be estimated from
| (2) |
where BSCs and BSCr are the BSCs of the unknown sample and reference phantom, respectively; Ss and Sr are the power spectra for the unknown sample and reference phantom, respectively; and z is the depth. The term 102z[αs(f)–αr(f)]/10 compensates for attenuation effects; note that αs and αr are in dB/cm for this form of compensation. The assumptions for Equation (2) are that the transducer surface contacts the unknown sample and reference phantom during scanning, and that α is homogenous in the sample and the reference phantom.
To implement the BSC estimation algorithm, the same FOI manually segmented for attenuation coefficient estimation in each image is used. The FOI is divided into 75%-overlapped sub-ROIs with dimensions 7.7 mm × 40 A-lines (axial × lateral; axial size equivalent to 15 wavelengths at 3 MHz). The power spectrum of each sub-ROI is calculated by gating with a Hanning window and computing a fast Fourier transform of each gated A-line in the sub-ROI. Averaging the power spectra over all A-lines in the sub-ROI yields the power spectral estimate of the sample for that sub-ROI. The same algorithm is repeated automatically on each portion of the reference phantom with the same depth as each corresponding sub-ROI of the sample to obtain the power spectral estimate of the reference phantom. With the estimated power spectra of both the sample and the reference phantom, the BSC of the sub-ROI can be estimated using Equation (2). BSC estimates from all the sub-ROIs are averaged together to obtain the mean BSC versus frequency over the bandwidth 2.0–3.6 MHz.
C. Reference Phantom Calibration
Calibration of the reference phantom acoustic properties (sound speed and attenuation; backscatter) were done in separate steps.
The sound speed and attenuation coefficient of the reference phantom materials were measured from small hockey-puck-shaped phantoms (~25 mm-thick) constructed with the same materials. The two flat surfaces of the hockey puck phantoms had full-diameter acoustic windows using a 25-μm-thick Saran layer, providing a configuration that allows for through-transmission measurements. The sound speed and attenuation were measured using a broadband through-transmission technique in the pulse-echo mode [9]. A 3.5-MHz single-element transducer (V382, Panametrics, Waltham, MA) was used for the measurements. The −10 dB bandwidth of the transducer was 1.6 – 4.9 MHz, the diameter was 1.27 cm, and the f-number was 4. The transducer was interfaced with a pulser/receiver (UTEX UT340, UTEX Scientific Instruments Inc., Mississauga, Ontario, Canada) that operated in the pulse echo mode. The received RF signals were acquired using a 200-MHz 14-bit A/D converter (PDA14-200 A/D converter, Signatec Inc., Newport Beach, CA) with a Daedal motion system (Parker-Hannifin Corporation, Irwin, PA) used for scanning.
For attenuation and sound speed calibration, a Plexiglas planar reflector was placed in the transducer focus (Figure 2). The RF echo signal generated from the water-Plexiglas interface was recorded. The power spectrum of this echo signal was calculated and denoted as S0(f) and the arrival time of the echo signal was denoted as t0. The hockey puck-shaped phantom was inserted into the acoustic path between the transducer surface and the Plexiglas without moving the transducer. The phantom sample was not allowed to contact the Plexiglas to allow for the separation of signals from the Plexiglas and the phantom bottom. The power spectrum of the echo signal from the Plexiglas surface was then calculated and denoted as S1(f). The transit times for the acoustic signal to travel from the transducer surface to the top surface of the sample, though the sample, and from the bottom surface of the sample to the Plexiglas were denoted as t1, t2, and t3, respectively (Figure 2). The sound speed of the sample at the scanned location was calculated using
| (3) |
where the sound speed in water cwater was calculated using the equation given by [10]:
| (4) |
where T represents the water temperature in degrees Celsius. The thickness of the sample was also calculated (d = Csamplet2). We did not directly measure the thickness of the sample using a caliper, because the hockey puck’s cylindrical wall is taller than the embedded phantom material. Also, the thickness of the material may be nonuniform. For these reasons, the thickness is more reliably estimated using the provided calculation. The attenuation coefficient (dB/cm) of the sample at the scanned location was then obtained using
| (5) |
where Tr(f) was the round trip acoustic pressure transmission coefficient of the water-Saran-sample layers, as given by Equation 3 of [11], and the attenuation coefficient of water was calculated using
| (6) |
where f is frequency in MHz [12].
Fig. 2.
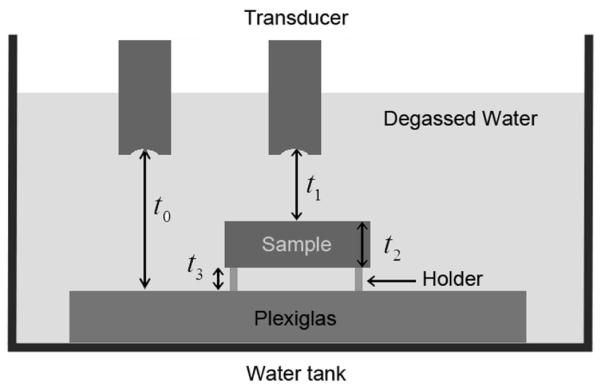
Diagram of experimental setup for sound speed and attenuation measurements
Three different locations of the phantom, separated by 2 mm (> 1 beamwidth) laterally, were each scanned to estimate the speed of sound and attenuation. The average results from the three locations are the final calibrated speed of sound and attenuation results for the sample.
The reference phantoms, rather than the hockey puck phantoms, were used for BSC calibration, because we strive to use the reference phantoms for calibration whenever feasible. It was not feasible to use the reference phantoms for the speed of sound and attenuation calibration using the through-transmission methods described above due to the hard enclosures of the phantoms. Hence the hockey-puck phantoms were used for speed and attenuation calibration. The BSC calibration procedure is as follows: First, a reference scan from the Plexiglas was acquired by recording the RF echo reflection from the water-Plexiglas interface at the set of axial positions that spanned the −6 dB depth of focus of the transducer with a step size of a half wavelength. Next, a raster scan of the sample was performed with a lateral step size of a focal beam width (= 1.02λf#). The transducer focus was positioned within the sample. The scan covered a sufficient length in both the axial and lateral directions so that sufficient number of sub-ROIs (6.6 × 6.6 mm, equivalent to 15 × 15 wavelengths at 3.5 MHz) could be acquired and processed from each scan. The dimensions are different from those in the descriptions above in Sections III-A&B because of slightly different center frequencies between the Siemens transducers and single-element transducers. Eleven independent scans were recorded for each sample. The BSC was estimated using the planar reference method described in [13], which was designed to remove equipment-dependent effects. To generate a BSC vs frequency curve, (i) a BSC estimate was made for each sub-ROI based on the gated RF echo data from that ROI, (ii) a mean BSC was estimated for each of the 11 scans by averaging the BSCs from all the ROIs within that scan, and then (iii) the 11 mean BSCs were averaged. The attenuation and transmission coefficient effects were compensated using the calibrated attenuation values and measured transmission coefficients of the cover layer reference phantoms.
IV. R&R METHODOLOGY
A. Overview
The design of the study was to assess the repeatability as well as transducer and operator reproducibility of AC and BSC measurements using physical phantoms of distinct and well calibrated AC and BSC properties. The input data to the R&R analysis were AC and log-transformed BSC values of the three phantoms (denoted P2, P4, and P6) estimated using the RF data acquired by two sonographers using two transducers (4C1 and 6C1HD) for multiple sessions on the Siemens S3000 clinical ultrasound scanner. The AC and BSC of P2, P4, and P6 were estimated using P4, P6, and P2 as references, respectively. The R&R analysis is not performed using AC or BSC versus frequency functions, but using single AC and BSC values that are computed as averages over the frequency band 2.8–3.0 MHz. This narrow bandwidth of frequencies was selected because it was around the center frequencies of the transducers. The R&R analysis of frequency functions is beyond the scope of this manuscript.
The R&R analysis was performed for each phantom separately, i.e., the phantom was not treated as a factor in the R&R models. Also, AC and BSC were analyzed separately. Single-phantom analysis is ideal for the purpose of obtaining an estimate of the measurement variance caused by repeatability and reproducibility. For each phantom, 60 AC and 60 BSC measurements were obtained in total. The 60 measurements are divided into 2 × 2 cells according to the transducer and sonographer factors (Table 1). Note that the machine settings may vary from measurement to measurement as well for the 60 measurements because the scans were acquired during multiple human participant scans for which the machine settings were individually adjusted. The machine setting changes are treated as repeatability rather than reproducibility in the R&R analysis because the machine setting is not a controllable factor whereas the sonographer and transducer are controllable factors.
TABLE I.
Two by two cells displaying the conditions of the 60 measurements with respect to transducers and sonographers.
| Transducer/ Sonographer | A | B |
|---|---|---|
| 4C1 | 11 data sets | 20 data sets |
| 6C1 | 10 data sets | 19 data sets |
An ANOVA approach was used for the R&R analysis. Sums of squares that are based on unweighted means are used because the ANOVA design was unbalanced. Unbalanced data sets occur frequently in the real world where a balanced model does not apply. Our approach is to develop analysis methods appropriate for the unbalanced data set, such that the applicability of the methods is broader (the methods that work for the unbalanced data set can be applied to the balanced data set as well). A random effect model with interaction was chosen for the statistical analysis. The random effect model assumes that the two sonographers (or transducers) are a sample from a large number of sonographers (or transducers). The purpose is to be able to extend the conclusions that are based on the sample of sonographers (or transducers) to all sonographers (or transducers). Depending whether there is sonographer-transducer interaction, two models (adapted from Ch7 of [14]) are introduced as follows.
B. Model 1: Unbalanced ANOVA with Interaction
The unbalanced two-factor random effect model with interaction is
| (7) |
where Yijk is the observation (either AC or logBSC) from a known phantom, μY is a constant, Ti, Sj, (T S)ij, and εijk are jointly independent normal random variables with means of zero and variances , , , and , respectively.
Ti, Sj , (T S)ij , and εijk represent transducer effect, sonographer effect, transducer-sonographer interaction, and the error term (repeatability effect), respectively. The term rij represents the number of replicates in cell (i, j), i.e., the number of times a phantom is measured by sonographer j using transducer i. The total number of observations is .
The repeatability and reproducibility are related to the model parameters in Table 2. A set of unweighted sums of squares (USS) estimators is used for the unbalanced Model 1. The USS ANOVA for Model 1 is shown in Table 3. Definitions for means and mean squares are shown in Table 4.
TABLE II.
R&R parameters and point estimators for Model 1.
| R&R parameter | Model 1 representation |
USS point estimator |
|---|---|---|
| Repeatability | ||
| Reproducibility of transducer | ||
| Reproducibility of sonographer |
||
| Reproducibility of T×S | ||
| Total reproducibility | ||
| Total variance |
TABLE III.
USS ANOVA for Model 1.
| Source of variation | Degrees of freedom |
Mean square | Expected mean square |
|---|---|---|---|
| Transducer (T) | nT −1 | ||
| Sonographer (S) | nS −1 | ||
| Transducer: Sonographer |
(nT −1)(nS −1) | ||
| Replicates | N – nTnS |
TABLE IV.
USS mean squares and means for Model 1.
| Statistic | Definition |
|---|---|
| rH |
C. Model 2: Unbalanced ANOVA with No Interaction
The unbalanced two-factor random effect model with no interaction is
| (8) |
where μY is a constant, Ti, Sj, and εijk are jointly independent normal random variables with means of zero and variances , , and , respectively.
The repeatability and reproducibility are related to the Model 2 parameters in Table 5. The USS ANOVA for Model 2 is shown in Table 6. Definitions for means and mean squares are the same as Model 1 (see Table 4), except that for Model 2.
TABLE V.
R&R parameters and point estimators for Model 2.
| R&R parameter | Model 2 representation |
USS point estimator |
|---|---|---|
| Repeatability | ||
| Reproducibility of transducer | ||
| Reproducibility of sonographer |
||
| Total reproducibility | ||
| Total variance |
TABLE VI.
USS ANOVA for Model 2.
| Source of variation | Degrees of freedom |
Mean square | Expected mean square |
|---|---|---|---|
| Transducer (T) | nT −1 | ||
| Sonographer (S) | nS −1 | ||
| Replicates | N−nT−nS+1 |
V. R&R Results
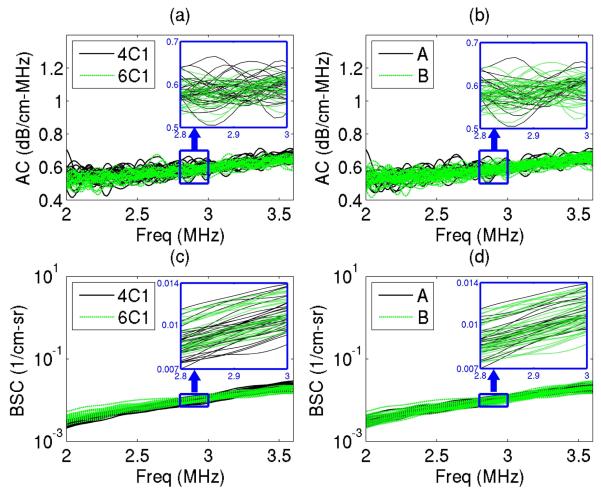
The estimated AC and BSC versus frequency curves for each phantom are consistent among the 60 measurements. Figure 3 shows the results of one of the phantoms (P6) as an example. There is good agreement between transducers and sonographers, with no apparent bias introduced by either variable as shown in Figure 3. Also, the variance of the measurements appears to be similar across the bandwidth 2.0–3.6 MHz, supporting the selection of a narrow bandwidth (2.8–3.0 MHz) to yield single averaged AC and BSC values for the R&R analysis.
Fig. 3.
An example of AC and BSC curves from 60 measurements of a physical phantom (P6), where the transducer and sonographer conditions are color coded, respectively: a) AC curves with transducers being color coded; b) AC curves with sonographers being color coded; c) BSC curves with transducers being color coded; and d) BSC curves with sonographers being color coded. Magnified plots are also shown for the narrow bandwidth 2.8–3 MHz.
The AC curves appear to be noisier than the BSC curves in Figure 3. AC is noisier than the BSC, mainly because the underlying mathematics for the AC and BSC signal processing procedures are different: The AC estimation requires the calculation of the ratio between power spectra at different depths to yield a slope estimation, whereas the BSC estimation does not require such a calculation. The additional calculation required by the AC estimation causes the AC estimates to be noisier than the BSC estimates.
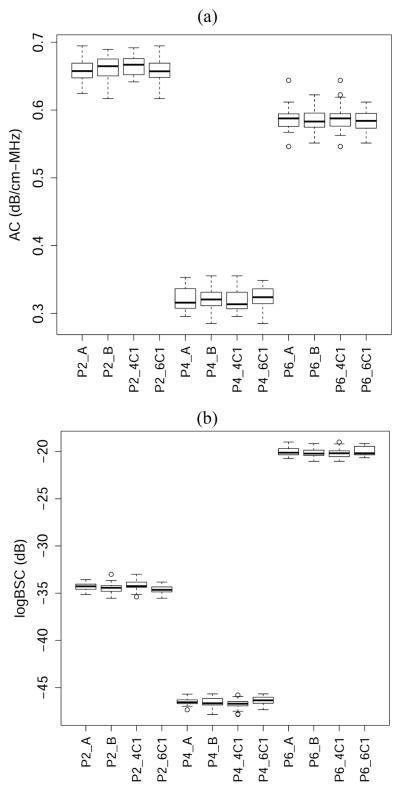
The boxplots of the (2.8–3.0 MHz) narrow-band AC and logBSC values are shown in Figure 4 for each phantom measured under various conditions. Similar to Figure 3, Figure 4 qualitatively shows good agreement between measurements at different conditions. Additionally, Figure 4 shows qualitatively that the variance of measurements within the same phantom is much smaller compared with the variance between phantoms. In addition, variance is comparable in each phantom over a wide range of BSC and AC values and, as was found in Figure 3, there is minimal bias associated with either the transducer or sonographer, therefore subtle bias will require more extensive investigation to determine.
Fig. 4.
Boxplots of (a) AC and (b) logBSC values for each phantom measured under various conditions.
To obtain quantitative results of the repeatability and reproducibility, Model 1 and Model 2 are applied, respectively, to the measured AC and logBSC values averaged in the bandwidth 2.8–3.0 MHz. Ideally, Model 2 should not be applied if Model 1 suggests significant transducer-sonographer interaction. However, it is not always clear what threshold p-value should be used to determine the significance of interaction, therefore, both models were applied here.
The R&R results obtained using Models 1 and 2 are shown in Tables 7 and 8, respectively. The repeatability, reproducibility and total R&R are presented in terms of variance. The two models yield equivalent results. The total absolute R&R values are small for the AC and logBSC. The repeatability variability is larger than reproducibility variability for all the cases. A zero reproducibility is seen for P6 in Tables 7 and 8. The R&R models may yield a zero reproducibility estimate because of the max operation appearing in Tables 2 and 5.
TABLE VII.
R&R results for all the phantoms estimated using Model 1 for an unbalanced data set (N=60 for each phantom)
| Phantom ID/R&R Parameters | P2 | P4 | P6 |
|---|---|---|---|
| Total AC R&R (dB/cm-MHz)2 | 2.91×10⁻⁴ | 2.51×10⁻⁴ | 3.15×l0−4 |
| AC Repeatability (dB/cm-MHz)2 | 2.49×10⁻⁴ | 2.39×10⁻⁴ | 3.15×l0−4 |
| AC Reproducibility (dB/cm-MHz)2 | 4.11×10⁻⁵ | 1.11×10⁻⁵ | 0 |
| Total logBSC R&R (dB)2 | 0.252 | 0.263 | 0.273 |
| logBSC Repeatability (dB)2 | 0.181 | 0.192 | 0.256 |
| logBSC Reproducibility (dB)2 | 0.070 | 0.072 | 0.017 |
TABLE VIII.
R&R results for all the phantoms estimated using Model 2 for an unbalanced data set (N=60 for each phantom)
| Phantom ID/R&R Parameters | P2 | P4 | P6 |
|---|---|---|---|
| Total AC R&R (dB/cm-MHz)2 | 2.69×10⁻⁴ | 2.44×10⁻⁴ | 3.14×10⁻⁴ |
| AC Repeatability (dB/cm-MHz)2 | 2.45×10⁻⁴ | 2.37×10⁻⁴ | 3.14×10⁻⁴ |
| AC Reproducibility (dB/cm-MHz)2 | 2.43×10⁻⁵ | 6.83×10⁻⁶ | 0 |
| Total logBSC R&R (dB)2 | 0.244 | 0.230 | 0.257 |
| logBSC Repeatability (dB)2 | 0.190 | 0.209 | 0.251 |
| logBSC Reproducibility (dB)2 | 0.054 | 0.021 | 0.006 |
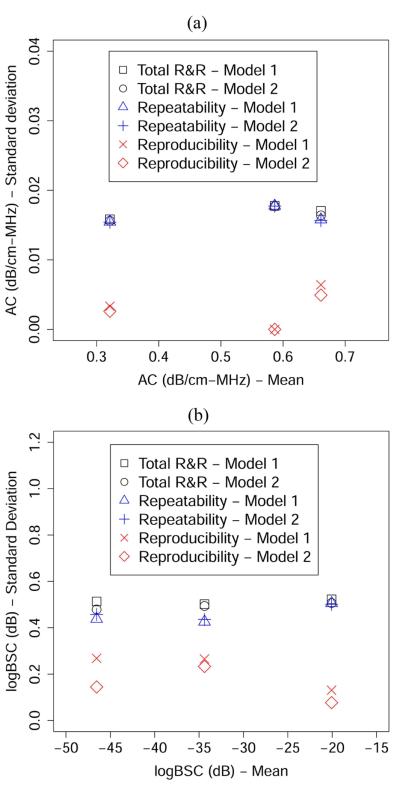
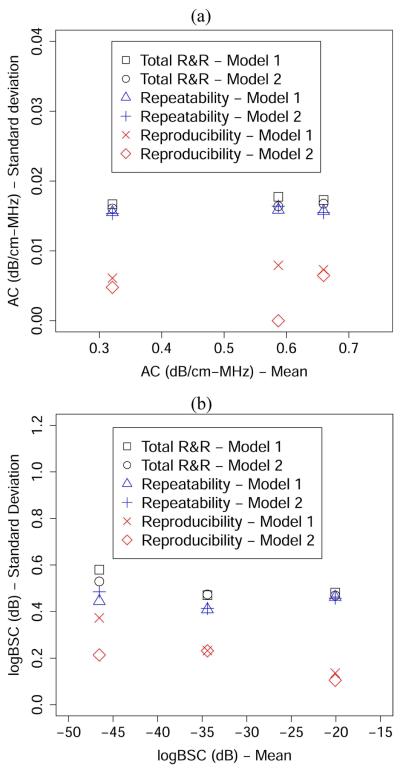
To further interpret the R&R results, we calculated the square roots of the numbers presented in Tables 7 and 8 to yield values that have the same unit as the mean AC or mean BSC. The square root version of the results, i.e., the R&R results presented in terms of the standard deviation, is shown in Figure 5. The standard deviations of R&R values are plotted against the unweighted mean (i.e., in Table 4) for each phantom. No noticeable correlation between the R&R results and the unweighted mean is observed in Figure 5. Rather, the total R&R values appear to be relatively constant with various mean values. Also, the total R&R values are significantly lower than the difference between the means of any two phantoms, indicating a high precision of the AC and BSC estimation procedures.
Fig. 5.
R&R (in terms of standard deviation) versus the unweighted mean for (a) AC and (b) logBSC using the unbalanced design.
The results presented in this section were all obtained from an unbalanced design. For completeness, a subset of data was randomly selected (using custom R script) from the 60 measurements with the constraint of forming a balanced data set (N = 40). The R&R results obtained using Models 1 and 2 for the balanced data set are shown in Appendix A. The results obtained using a balanced data set are not significantly different from the unbalanced data set (p = 0.93 based on a t-test of R&R parameters obtained using balanced versus unbalanced data).
VI. Discussion
A. Discussion on the Experimental Design
The analysis performed in this paper assesses the inherent variability associated with the AC/BSC measurement technique under clinical conditions. The phantom data define the baseline variability of this technology and is helpful for understanding future R&R results from human data, in which technology-dependent and patient-dependent factors both contribute to measurement variability. Importantly, machine settings were adjusted in research participants spanning clinically relevant spectrum of obesity and liver disease severity, thereby simulating clinical conditions. If machine settings were not allowed to vary, the phantom R&R analysis would provide an artificial but possibly best-case estimate of precision of the AC/BSC measurement procedure, although it may not be as relevant to real world applications. If patient data, rather than the phantom data, were used to perform the R&R analysis, we would be able to use the same R&R method to obtain the R&R of the QUS measurement procedure as well as to estimate the inter-patient variability. Future work will be pursued to apply the same R&R method on patient data.
An unbalanced design is used where the number of measurement sessions performed by different sonographers while using different transducers is not the same. Unbalanced data sets are very common in real clinical studies, therefore, performing an unbalanced phantom R&R study can help improve the applicability of the R&R methodology.
Appropriately, only two reproducibility factors are included in the study design: the transducer and the sonographer. These two factors are commonly varied for most clinical applications. However, other factors such as the scanner type or model are also important factors to be assessed in the future. Adding more factors to the study would also add complexity, but we intend to address these issues by a step-wise approach where the first step is to develop the analysis framework while maintaining the simplicity. Subsequent studies will incorporate more factors following the current analysis framework.
The number of repeated measurements in this paper is typical for R&R studies [15-20]. However, the numbers of transducer samples and sonographer samples are small: 2 transducers and 2 sonographers. The small number of transducer and sonographer samples could be a limitation of this study. However, the R&R result suggest that the transducer and sonographer reproducibility variability are both insignificant compared to the repeatability. This result may mitigate the negative impact of small number of transducers and sonographers.
B. Discussion on the R&R Methodology
There are several ways of performing R&R analyses. The ANOVA approach was chosen because it allows for rigorous statistical tests and powerful analysis. For the unbalanced design, we decided to use the unweighted approach rather than the weighted approach for the ANOVA analysis, because the fact that one transducer (sonographer) has more measurements than the other is incidental and cannot be generalized to other studies.
Random models are used in this study instead of mixed effect models. This choice has an important advantage: one may add more transducers and more sonographers in the study without violating the hypothesis of the model.
C. Discussion on the R&R Results
The total R&R variability is low for both AC and BSC measurements, suggesting the high precision of BSC/AC measurements. If we use three times the square root of total R&R variability (three sigma) to define the precision, then the AC and BSC have precisions of approximately 0.05 dB/cm-MHz and 1.5 dB, respectively, which are small compared to the ranges of the AC (0.32–0.66 dB/cm-MHz) and BSC (−46.9 – −20.1 dB) values of the phantoms. Note that high precision does not necessarily indicate high accuracy. Depending on the clinical application, accuracy may be as important or even more important than precision. However, there is no gold or international standard available to date that has been developed by a national or international standards body for assessing the accuracy of QUS measurements. It requires careful and thorough theoretical and experimental research work to fully investigate the accuracy of AC and BSC measures using the reference phantom technique. The accuracy of QUS measurements will be addressed in future work.
The repeatability variability has been shown to be significantly higher than the reproducibility variability (transducers and phantoms combined). This result is not surprising because the variability caused by using different machine settings was modeled as part of repeatability in the R&R analysis. The machine settings were changed not only within a given sonographer/transducer, but also between sonographers/transducers. In a clinical setting it is not feasible and possibly inappropriate to use the same machine settings for all the patients. Therefore, we allowed the sonographers to vary machine settings using their expertise to obtain the optimum B-mode image data, which allows us to gauge the precision of AC/BSC measurements on phantoms under realistic clinical conditions. Nevertheless, the finding that repeatability variance is significantly higher than reproducibility variance suggests a further study to analyze the phantom R&R under the condition of fixed machine settings. The R&R analysis methodology described here can be used directly for such a study.
Finally, we wish to comment on the intuitive interpretation of the repeatability, reproducibility, and total R&R as defined by Equations (7) and (8) and Tables 2 and 5. Intuitively, the repeatability is affected by the within-transducer within-sonographer variability. The reproducibity is affected by the between-transducer between-sonographer variability. The reproducibility defined in this paper should not be interpreted as the total variability that is affected by both the between-transducer between-sonographer variability and the within-transducer within-sonographer variability. Rather, the total variability is described by the total R&R. In our phantom study we found that repeatability was worse than reproducibility suggesting that in phantoms, within-sonographer within-transducer variability is greater than the between-sonographer between-transducer variability. Further research is needed to assess the sources of variability in quantifying QUS parameters in vivo in human liver.
VII. Conclusions
The R&R analysis methodology introduced in this paper was shown to be useful and applicable to yield the repeatability, reproducibility and total R&R for the AC and BSC measurements. The transducer and sonographer reproducibility variability was found to be negligible. The phantom total R&R results demonstrated the high precision of AC and BSC measurements using the reference phantom on clinical systems.
Acknowledgements
We are grateful for the dedicated contributions and expertise of the two sonographers who participated in this study, Lisa Deiranieh, BS, RDMS and Elise Housman, BS, RDMS, and the phantom calibration expertise of Jamie Kelly and Jake Berndt, without whom this work could not be completed.
This work was supported in part by the National Institutes of Health (R01DK106419) and by a grant from Siemens Medical Systems.
Biography
Aiguo Han (S’13 – M’15) was born in Jiangsu, China, in 1986. He received the B.S. degree in Acoustics from Nanjing University, Nanjing, China, in 2008, and the M.S. and Ph.D. degrees in Electrical and Computer Engineering from the University of Illinois at Urbana-Champaign, Urbana, IL, in 2011 and 2014, respectively.
Since 2015, he has been a Postdoctoral Research Associate in University of Illinois at Urbana-Champaign, Urbana, IL. His research interests include ultrasonic wave propagation in heterogeneous media, quantitative ultrasound imaging, signal processing, and computational methods.
Dr. Han is a member of the Institute of Electrical and Electronics Engineers, a member of the Acoustical Society of America, and a member of the American Institute of Ultrasound in Medicine. He was recipient of the New Investigator Basic Science Award of the 2016 AIUM Annual Convention.
Michael Andre is currently Professor of Radiology at the University of California, San Diego as well as Chief Physicist at the San Diego VA Healthcare System, positions he has held since 1981. Previously he worked as Radiation Physicist for the Los Angeles County Department of Health Services and Member of the Technical Staff at the Hughes Aircraft Company. He received his M.S. and Ph.D. degrees in Medical Physics from the University of California, Los Angeles. He is certified by the American Board of Radiology in Diagnostic Radiological Physics and was elected Fellow in the American Institute of Ultrasound in Medicine. His research interests are in quantitative medical applications of ultrasound and x-ray computed tomography, computer-aided diagnosis and ultrasound computed tomography for breast imaging.
Dr. Erdman is Emeritus Professor of Food Science and Human Nutrition at the University of Illinois at Urbana. He has authored over 200 original research articles and over 350 total publications (H-Index is 50). He is a Fellow of the American Society for Nutrition (ASN), the Institute of Food Technologists (IFT), and the American Heart Association (AHA). He is past President of the American Society for Nutritional Sciences (now ASN). He has served on over two dozen committees for the Institute of Medicine, National Academy of Sciences (NAS). He chaired the Standing Committee on the Scientific Evaluation of Dietary Reference Intakes (DRIs) and the Committee on Military Nutrition Research for NAS. He was elected as a Member of the Institute of Medicine (now National Academy of Medicine). He has received numerous honors for research, teaching and mentoring. His B.S., M.S., M.Phil. and Ph.D. are in Food Science from Rutgers University.
Rohit Loomba M.D., MHSc, is Professor of Medicine (with tenure), Director of Hepatology and Vice-Chief, Division of Gastroenterology, Department of Medicine, University of California at San Diego. He is an internationally recognized expert in translational research and innovative clinical trial design in nonalcoholic fatty liver disease (NAFLD) and steatohepatitis (NASH), and non-invasive assessment of steatosis and fibrosis using advanced imaging modalities. Dr. Loomba is the founding director of the UCSD NAFLD Research Center where his team is conducting cutting edge research in all aspects of NAFLD including noninvasive biomarkers, genetics, epidemiology, clinical trial design, imaging endpoints, and integrated OMICs using microbiome, metabolome and lipidome. This integrated approach has led to several innovative applications such as establishment of MRI-PDFF as a non-invasive biomarker of treatment response in early phase trials in NASH, and first prospective study of MRE in patients with biopsy-proven NAFLD, and MOZART Trial being the first trial in NASH with comprehensive MRI and 2D and 3D MRE assessment paired with liver biopsies in NASH. He follows one of the largest cohort of well-characterized patients with NAFLD and applies evidence-based medicine to answer clinically relevant questions to improve management of patients with chronic liver disease. He is the founder and principal investigator of the San Diego Integrated NAFLD Research Consortium (SINC). His research is funded by the National Institutes of Health including R01 and U01 grant mechanisms, American Gastroenterology Association, National Science Foundation as well as several investigator initiated research projects funded by the industry. He is the Principal Investigator for adult hepatology for the NIDDK-sponsored NASH Clinical Research Network (2009-19) and is a member of the American Association for the Study of Liver Diseases. Dr. Loomba is an elected member of the national board of directors of the American Liver Foundation. He serves on the editorial board of several leading journals including Gastroenterology, Gut and Journal of Hepatology, and serves as the Deputy Editor for Hepatology, the leading journal in the field of liver diseases.
Claude B. Sirlin , MD, is currently Professor and Vice Chair (Translational Research) of Radiology at the University of California, San Diego. He is an NIH-funded clinician scientist, whose research focuses on magnetic resonance imaging (MRI) and quantitative ultrasound of liver cancer and chronic liver disease. He has published more than 200 manuscripts, 30 book chapters, 200 scientific abstracts, and 100 educational exhibits. A dedicated teacher and mentor, Dr Sirlin has supervised over 150 undergraduates, medical students, residents, and fellows in clinical imaging research. He is the director of his department’s NIH-funded research residency training program
William D. O’Brien, Jr. (S’64 - M’70 - SM’79 - F’89 - LF’08) received the B.S., M.S., and Ph.D. degrees from the University of Illinois, Urbana-Champaign. From 1971 to 1975 he worked with the Bureau of Radiological Health (currently the Center for Devices and Radiological Health) of the U.S. Food and Drug Administration. In 1975, he joined the faculty at the University of Illinois. He is currently Research Professor of Electrical and Computer Engineering and Director of the Bioacoustics Research Laboratory. Prior to becoming a Research Professor, he was the Donald Biggar Willet Professor of Engineering. His research interests involve the many areas of ultrasound-tissue interaction, including biological effects and quantitative ultrasound imaging for which he has published 407 papers. Dr. O’Brien is a Life Fellow of the Institute of Electrical and Electronics Engineers, a Fellow of the Acoustical Society of America and a Fellow of the American Institute of Ultrasound in Medicine, and is a Founding Fellow of the American Institute of Medical and Biological Engineering. He was recipient of the IEEE Centennial Medal (1984), the AIUM Presidential Recognition Awards (1985 and 1992), the AIUM/WFUMB Pioneer Award (1988), the IEEE Outstanding Student Branch Counselor Award for Region 4 (1989), the AIUM Joseph H. Holmes Basic Science Pioneer Award (1993), the IEEE Ultrasonics, Ferroelectrics, and Frequency Control Society Distinguished Lecturer (1997-1998), the IEEE Ultrasonics, Ferroelectrics, and Frequency Control Society’s Achievement Award (1998), the IEEE Millennium Medal (2000) the IEEE Ultrasonics, Ferroelectrics, and Frequency Control Society’s Distinguished Service Award (2003), the AIUM William J. Fry Memorial Lecture Award (2007), and the IEEE Ultrasonics, Ferroelectrics, and Frequency Control Society’s Rayleigh Award (2008). He has served as President (1982-1983) of the IEEE Sonics and Ultrasonics Group (currently the IEEE Ultrasonics, Ferroelectrics, and Frequency Control Society), Editor-in-Chief (1984-2001) of the IEEE Transactions on Ultrasonics, Ferroelectrics, and Frequency Control, and President (1988-1991) of the American Institute of Ultrasound in Medicine.
Appendix A. R&R Results From A Balanced Data Set
A subset of data was chosen from the 60 measurements to form a balanced data set, where there were 10 measurements acquired under each transducer-sonographer combination. When the data set is balanced, Models 1 and 2 are reduced to balanced ANOVA models. Models 1 and 2 are applied on the balanced subset of data to estimate the R&R. The R&R results obtained using Models 1 and 2 on the balanced data are shown in Tables A1 and A2. The obtained R&R in terms of standard deviation was plotted against the unweighted mean in Figure A1. The results from balanced data are similar to those obtained from the unbalanced data.
Fig. A1.
R&R (in terms of standard deviation) versus the unweighted mean for (a) AC and (b) logBSC using the balanced design.
TABLE A1.
R&R results for all the phantoms estimated using Model 1 for a balanced data set (N=40 for each phantom)
| Phantom ID/R&R Parameters | P2 | P4 | P6 |
|---|---|---|---|
| Total AC R&R (dB/cm-MHz)2 | 2.99×10⁻⁴ | 2.79×10⁻⁴ | 3.15×10⁻⁴ |
| AC Repeatability (dB/cm-MHz)2 | 2.46×10⁻⁴ | 2.41×10⁻⁴ | 3.52×10⁻⁴ |
| AC Reproducibility (dB/cm-MHz)2 | 5.34×10⁻⁵ | 3.72×10⁻⁵ | 6.30×10⁻⁵ |
| Total logBSC R&R (dB)2 | 0.221 | 0.336 | 0.231 |
| logBSC Repeatability (dB)2 | 0.167 | 0.197 | 0.213 |
| logBSC Reproducibility (dB)2 | 0.054 | 0.139 | 0.018 |
TABLE A2.
R&R results for all the phantoms estimated using Model 2 for a balanced data set (N=40 for each phantom)
| Phantom ID/R&R Parameters | P2 | P4 | P6 |
|---|---|---|---|
| Total AC R&R (dB/cm-MHz)2 | 2.81×10⁻⁴ | 2.59×10⁻⁴ | 2.69×10⁻⁴ |
| AC Repeatability (dB/cm-MHz)2 | 2.39×10⁻⁴ | 2.36×10⁻⁴ | 2.69×10⁻⁴ |
| AC Reproducibility (dB/cm-MHz)2 | 4.21×10⁻⁵ | 2.28×10⁻⁵ | 0 |
| Total logBSC R&R (dB)2 | 0.224 | 0.281 | 0.220 |
| logBSC Repeatability (dB)2 | 0.171 | 0.235 | 0.209 |
| logBSC Reproducibility (dB)2 | 0.053 | 0.045 | 0.011 |
Appendix B. Phantom Calibration Results
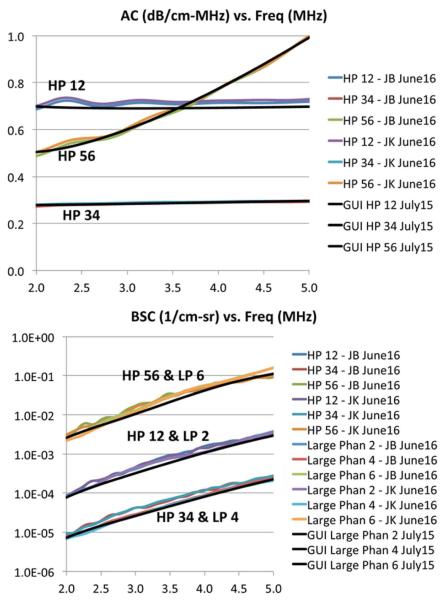
The phantoms are calibrated twice, initially in July 2015 before the start of the R&R phantom scans, and repeated in June 2016, several months after the R&R phantom scans. The calibration results are shown in Fig. A2. The July-2015 calibration results (average of results acquired by several individuals) were coded in the GUI for the data processing performed in this manuscript. The June-2016 calibration was performed subsequently by two individuals (JB and JK) to assess the stability of the phantom properties.
Fig. A2.
Calibrated AC (top) and BSC (bottom) versus frequency, initially acquired in July 2015 and repeated in June 2016. HP represents the hockey puck phantom, LP represents the large phantom, GUI represents values used in the GUI (calibrated in July 2015), and JB and JK represent the initials of two individuals who performed the calibration.
Contributor Information
Aiguo Han, Bioacoustics Research Laboratory, Department of Electrical and Computer Engineering, University of Illinois, Urbana, IL 61801..
Michael P. Andre, Liver Imaging Group in the Department of Radiology, University of California at San Diego, San Diego, CA and M. P. Andre is also with the San Diego VA Healthcare System, San Diego, CA.
John W. Erdman, Jr., Department of Food Science and Human Nutrition, University of Illinois at Urbana-Champaign, Urbana, IL.
Rohit Loomba, NAFLD Translational Research Unit, Division of Gastroenterology, and Division of Epidemiology, Department of Family and Preventive Medicine, University of California, San Diego, CA..
Claude B. Sirlin, Liver Imaging Group in the Department of Radiology, University of California at San Diego, San Diego, CA and M. P. Andre is also with the San Diego VA Healthcare System, San Diego, CA.
William D. O’Brien, Jr., Bioacoustics Research Laboratory, Department of Electrical and Computer Engineering, University of Illinois, Urbana, IL 61801 (wdo@uiuc.edu)..
REFERENCES
- [1]. http://www.fda.gov/Drugs/DevelopmentApprovalProcess/DrugDevelopmentToolsQualificationProgram/ucm284395.htm.
- [2].Kessler LG, Barnhart HX, Buckler AJ, Choudhury KR, Kondratovich MV, Toledano A, Guimaraes AR, Filice R, Zhang Z, Sullivan DC, QIBA Terminology Working Group The emerging science of quantitative imaging biomarkers terminology and definitions for scientific studies and regulatory submissions. Stat Methods Med Res. 2015;24(1):9–26. doi: 10.1177/0962280214537333. [DOI] [PubMed] [Google Scholar]
- [3].Lin SC, Heba E, Wolfson T, Ang B, Gamst A, Han A, Erdman JW, Jr., O’Brien WD, Jr., Andre MP, Sirlin CB, Loomba R. Noninvasive diagnosis of Nonalcoholic Fatty Liver Disease and quantification of liver fat using a new quantitative ultrasound technique. Clin. Gastro. Hepatol. 2015;13:1337–1345. doi: 10.1016/j.cgh.2014.11.027. [DOI] [PMC free article] [PubMed] [Google Scholar]
- [4].Yao LX, Zagzebski JA, Madsen EL. Backscatter coefficient measurements using a reference phantom to extract depth-dependent instrumentation factors. Ultrasonic Imaging. 1990;12:58–70. doi: 10.1177/016173469001200105. [DOI] [PubMed] [Google Scholar]
- [5].Brunke SS, Insana MF, Dahl JJ, Hansen C, Ashfaq M, Ermert H. An Ultrasound Research Interface for a Clinical System. IEEE Trans. Ultrason. Ferroelectr. Freq. Control. 2007;54(no. 1):198–210. doi: 10.1109/tuffc.2007.226. [DOI] [PubMed] [Google Scholar]
- [6].Andre MP, Han A, Heba E, Hooker J, Loomba R, Sirlin CB, Erdman JW, Jr., O’Brien WD., Jr. Accurate diagnosis of Nonalcoholic Fatty Liver Disease in human participants via Quantitative Ultrasound. IEEE Int Ultrason Symp Proc. 2014:2375–2377. [Google Scholar]
- [7].Labyed Y. PhD dissertation. Iowa State University; 2011. Optimization and application of ultrasound attenuation estimation algorithms. [Google Scholar]
- [8].Labyed Y, Bigelow TA, McFarlin BL. Estimate of the attenuation coefficient using a clinical array transducer for the detection of cervical ripening in human pregnancy. Ultrasonics. 2011;51:34–39. doi: 10.1016/j.ultras.2010.05.005. [DOI] [PMC free article] [PubMed] [Google Scholar]
- [9].Han A, Abuhabsah R, Miller RJ, Sarwate S, O’Brien WD., Jr. The measurement of ultrasound backscattering from cell pellet biophantoms and tumors ex vivo. J. Acoust. Soc. Am. 2013;134(no. 1):686–693. doi: 10.1121/1.4807576. [DOI] [PMC free article] [PubMed] [Google Scholar]
- [10].Bilaniuk N, Wong GSK. Speed of sound in pure water as a function of temperature. J. Acoust. Soc. Am. 1993;93(no. 3):1609–1612. [Google Scholar]
- [11].Wear KA, Stiles TA, Frank GR, Madsen EL, Cheng F, Feleppa EJ, Hall CS, Kim BS, Lee P, O’Brien WD, Jr., Oelze ML, Raju BI, Shung KK, Wilson TA, Yuan JR. Interlaboratory comparison of ultrasonic backscatter coefficient measurements from 2 to 9 MHz. Journal of Ultrasound in Medicine. 2005;24:1235–1250. doi: 10.7863/jum.2005.24.9.1235. [DOI] [PubMed] [Google Scholar]
- [12].Fisher FH, Simmons VP. Sound absorption in sea water. J. Acoust. Soc. Am. 1977;62(no. 3):558–564. [Google Scholar]
- [13].Chen X, Phillips D, Schwarz KQ, Mottley JG, Parker KJ. The measurement of backscatter coefficient from a broadband pulse-echo system: A new formulation. IEEE Trans. Ultrason. Ferroelectr. Freq. Control. 1997;44:515–525. doi: 10.1109/58.585136. [DOI] [PubMed] [Google Scholar]
- [14].Burdick RK, Borror CM, Montgomery DC. Design and Analysis of Gauge R&R Studies: Making Decisions with Confidence Intervals in Random and Mixed Effects Models. ASA-SIAM Sieres on Statistics and Applied Probability; Philadephia, PA: 2005. [Google Scholar]
- [15].Measurement System Analysis. Reference Manual. 4th Edition. Chrysler LLC, Ford Motor Co, General Motors Corp; Jun, 2010. Guidelines for Determining Repeatability and Reproducibility; p. 123. ISBN#: 978-1-60-534211-5. [Google Scholar]
- [16].Hudson JM, Milot L, Parry C, Williams R, Burns PN. Inter- and intra-operator reliability and repeatability of shear wave elastography in the liver: a study in healthy volunteers. Ultrasound In Med. & Biol. 2013;39(no. 6):950–955. doi: 10.1016/j.ultrasmedbio.2012.12.011. [DOI] [PubMed] [Google Scholar]
- [17].Ferraioli G, Tinelli C, Zicchetti M, Above E, Poma G, Di Gregorio M, Filice C. Reproducibility of real-time shear wave elastography in the evaluation of liver elasticity. European Journal of Radiology. 2012;81:3102–3106. doi: 10.1016/j.ejrad.2012.05.030. [DOI] [PubMed] [Google Scholar]
- [18].Strauss S, Gavish E, Gottlieb P, Katsnelson L. Interobserver and intraobserver variability in the sonographic assessment of fatty liver. Am. J. Roentgenol. 2007;189:W320–W323. doi: 10.2214/AJR.07.2123. [DOI] [PubMed] [Google Scholar]
- [19].Hall TJ, Milkowski A. RSNA/QIBA: Shear wave speed as a biomarker for liver fibrosis staging. IEEE International Ultrasonics Symposium. 2013:397–400. plus 54 more authors. [Google Scholar]
- [20].Bota S, Sporea I, Sirli R, Popescu A, Danila M, Costachescu D. Intra- and interoperator reproducibility of acoustic radiation force impulse (ARFI) elastography–preliminary results. Ultrasound in Med. & Biol. 2012;38(no. 7):1103–1108. doi: 10.1016/j.ultrasmedbio.2012.02.032. [DOI] [PubMed] [Google Scholar]


