

Abstract
MYC deregulation is common in human cancer and has a role in sustaining the aggressive cancer stem cell populations. MYC mediates a broad transcriptional response controlling normal biological programmes, but its activity is not clearly understood. We address MYC function in cancer stem cells through the inducible expression of Omomyc—a MYC‐derived polypeptide interfering with MYC activity—taking as model the most lethal brain tumour, glioblastoma. Omomyc bridles the key cancer stemlike cell features and affects the tumour microenvironment, inhibiting angiogenesis. This occurs because Omomyc interferes with proper MYC localization and itself associates with the genome, with a preference for sites occupied by MYC. This is accompanied by selective repression of master transcription factors for glioblastoma stemlike cell identity such as OLIG2, POU3F2, SOX2, upregulation of effectors of tumour suppression and differentiation such as ID4, MIAT, PTEN, and modulation of the expression of microRNAs that target molecules implicated in glioblastoma growth and invasion such as EGFR and ZEB1. Data support a novel view of MYC as a network stabilizer that strengthens the regulatory nodes of gene expression networks controlling cell phenotype and highlight Omomyc as model molecule for targeting cancer stem cells.
Keywords: gene networks, glioblastoma stem cells, MYC inhibition
Subject Categories: Cancer; Chromatin, Epigenetics, Genomics & Functional Genomics; Transcription
Introduction
MYC is a transcription factor (TF) that regulates a large number of protein‐coding and non‐coding genes and coordinates many biological processes. Its transcriptional signature is not constant among the different cell types. MYC is commonly deregulated in human cancer and is an organizer of cancer stem cells 1, 2. It represents a primary target for cancer treatment because its inhibition leads to cancer regression 1. MYC binds to E‐boxes—CACGTG consensus sequences—at thousands of genomic loci in complex with MAX and interacts with a number of proteins involved in the regulation of transcription and chromatin remodelling 3. MYC does not appear to induce new transcripts but supports transcript production from already active genes and promotes transcript elongation 4, 5. The upregulated targets include microRNAs (miRs) like those in the miR‐17‐92 cluster that suppress specific genes to sustain a neoplastic state 6, 7, 8, 9. MYC also downregulates an important set of genes. Repression may be either direct, through the association with TFs such as MIZ1 and EZH2 (catalytic component of the Polycomb repressive complex) or indirect, by increasing expression of repressors like SIN3B and EZH2 itself 3, 5. Obtaining a satisfying explanation of its molecular function has been made hard by the complexity of its action. Current views consider MYC as either a universal nonlinear amplifier or a gene‐specific modulator 3, 5, 10, 11, 12, 13.
As MYC supports the processes required for normal growth and homoeostasis, its ablation is less attractive than modulation of its expression or function. This view is supported by studies showing the potential therapeutic efficacy of drugs impairing MYC transcription 14, 15, 16 and of Omomyc, a ninety amino acid long polypeptide obtained by targeted mutations of c‐MYC bHLHZip domain 17. Omomyc affects MYC at the level of protein interactions and DNA binding and is effective in transgenic tumour models including glioma, while being well tolerated 18, 19, 20, 21, 22, 23. Further insights into its mechanism of action may contribute to elucidate the function of MYC and better indicate how to target it.
Glioblastoma multiforme is the most common and aggressive brain tumour 24. It harbours a population of glioblastoma stemlike cells (GSCs), which are multipotent, resistant to therapies and able to regenerate the tumour 25, 26. Since MYC is highly expressed in these cells and is required for maintaining their phenotype 27, they are a good model for addressing MYC function in cancer stem cells and the impact of its inhibition by Omomyc.
Results
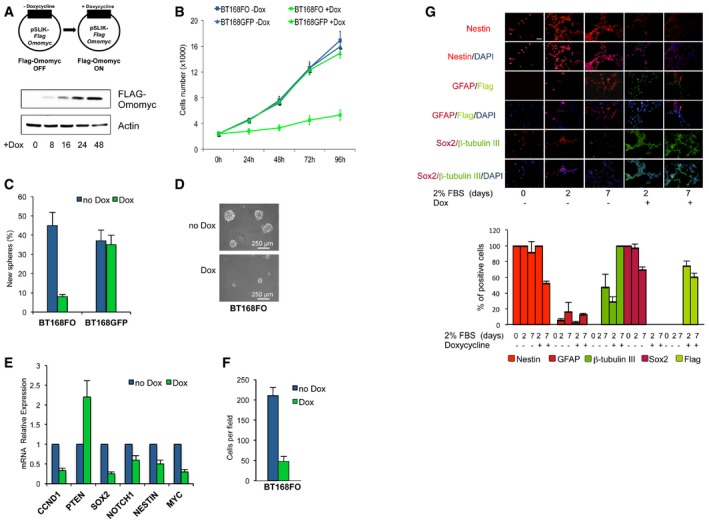
We employed inducible Omomyc in order to perturb MYC function. We stably transduced three patient‐derived GSCs (BT168, BT275 and BT308) 28 with the SLIK‐FO lentivirus driving doxycycline (Dox)‐dependent expression of a FlagOmomyc (FO) construct. Omomyc was first detectable at 4–8 h post‐Dox treatment, reaching maximal levels at 48 h (Fig 1A).
Figure 1. Omomyc inhibits GSC proliferation, self‐renewal and migration while promoting differentiation.
-
AScheme of the lentiviral vector with inducible FlagOmomyc (top) and immunoblotting (bottom) of FlagOmomyc and actin loading control upon Dox treatment of BT168FO cells for 0–48 h.
-
BProliferation curves of BT168FO and BT168GFP cells upon Dox treatment for 0–96 h (n = 3; mean ± SD). Viable cells were counted using a haemocytometer.
-
C, DSelf‐renewal assay upon Dox treatment. (C) Histograms showing the percentage of cells capable of re‐forming a neurosphere seven days after dissociation (n = 3; mean ± SD). (D) Representative micrographs of BT168FO cell neurospheres.
-
EqRT–PCR of proliferation, stem cell and differentiation markers (CCND1, PTEN, SOX2, NOTCH1, NESTIN, MYC) in BT168FO cells after 48 h of Dox treatment, compared to uninduced cells (n = 3; mean ± SD). Expression levels in non‐induced cells were set as 1.
-
FTranswell migration assay of BT168FO cells after 3 days with or without Dox (n = 3; mean ± SD). 10 fields were counted per assay.
-
GImmunofluorescence analyses of GSC differentiation. To stimulate differentiation, BT168FO were grown as a monolayer in the presence of serum and treated with doxycycline for up to 7 days. The upper panel displays immunofluorescence images of NESTIN, GFAP, βIII‐tubulin, SOX2 and FlagOmomyc expression. FlagOmomyc blunted SOX2 expression and decreased GFAP and NESTIN protein levels, while inducing the onset of βIII‐tubulin. The lower panel shows the percentage of positive cells for each cell marker evaluated (n = 4; mean ± SD). 16 fields for each assay were examined; scale bar = 100 μm.
Influence of MYC inhibition on glioblastoma stemlike cell behaviour
In vitro
Dox treatment reduced proliferation of GSCFO cells but not of cells expressing a Dox‐inducible green fluorescent protein (Figs 1B and EV1A). Likewise, it caused a strong decrease of GSC self‐renewal (from > 40 to ~7%) and neurosphere size (Figs 1C and D, and EV1B). This was mirrored (Figs 1E and EV1D) by the decreased expression of genes involved in neural stem cell self‐renewal and proliferation: SOX2, NOTCH1, CCND1 (cyclin D1) and NESTIN 29, 30, 31, 32. On the contrary, expression of PTEN—a tumour suppressor that inhibits cell renewal, enhances differentiation and is frequently lost in glioblastoma 33—increased. The migratory ability of GSCs, which accounts for their propensity to infiltrate the tumour and recur at distant sites 34, was strongly restrained (Figs 1F and EV1C).
Figure EV1. BT308FO and BT275FO GSCs: Omomyc inhibits cell proliferation, migration and self‐renewal, but promotes differentiation.
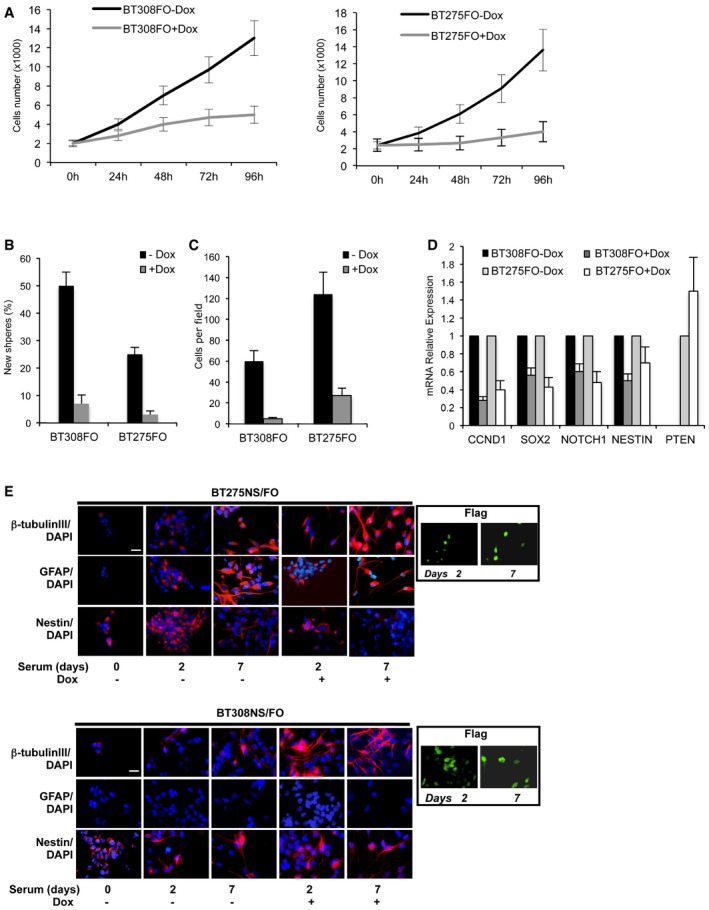
- Proliferation plot of BT308FO (left) and BT275FO (right), measured by proliferative kinetic analysis upon Dox treatment, 0–96 h. Viable cells were counted using a haemocytometer.
- Percentage of cells that were capable of forming new secondary neurospheres after 7 days in the presence or absence of Dox.
- Transwell migration assay of BT275FO and BT308FO cells after 3 days with or without Dox. 10 fields were counted per assay.
- qRT–PCR of relevant markers CCND1 (cyclin D1), SOX2, NOTCH1, NESTIN and PTEN in BT275FO and BT308FO after 48 h of induction with Dox compared to uninduced cells. PTEN was analysed only in BT275FO since it is not expressed in BT308FO cells. For each cell line, the expression level of each gene in non‐induced cells was set as 1, and relative expression was calculated by normalizing to GAPDH.
- Immunofluorescence images representative of three independent experiments, in which BT275FO and BT308FO cells grown for 2–7 days in differentiation conditions were fixed and analysed for the presence of βIII‐tubulin, GFAP and NESTIN markers. Nuclei were identified by DAPI staining and the expression of Omomyc in doxycycline‐induced cells was revealed by FLAG staining (insets). Scale bars = 100 μm.
We investigated whether Omomyc influenced GSC capacity to differentiate towards neural cell types when grown as monolayers in the presence of serum 28. Upon Dox treatment in the presence of serum, SOX2 and NESTIN expression was switched off and the neuronal marker βIII‐tubulin was induced faster and remained higher than control in BT168FO (Fig 1G), BT275FO and BT308FO (Fig EV1E). The astroglial marker GFAP was inhibited in BT168 cells only, suggesting that Omomyc may specifically enhance neuronal differentiation in these cells. In conclusion, Omomyc promoted differentiation in the presence of an appropriate stimulus.
In vivo
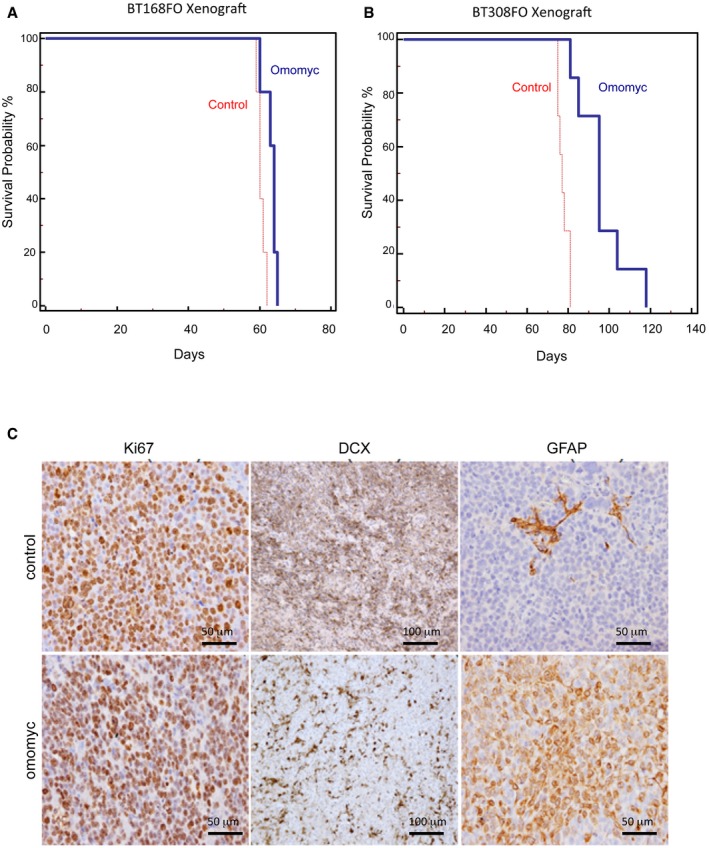
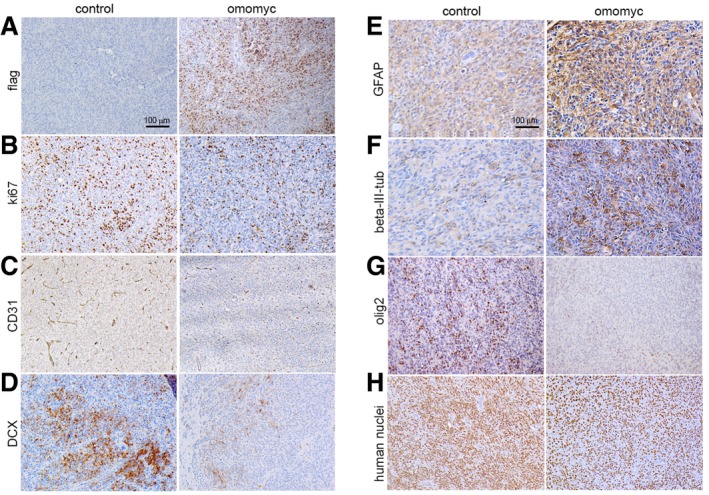
To investigate the consequences of MYC inhibition on GSC tumour‐forming ability, we stereotaxically implanted BT168 and BT308 cells harbouring or not the inducible FlagOmomyc (FO) into the nucleus caudatum of immune‐deficient mice. We induced Omomyc expression by Dox right after the xenograft and performed tumour engraftment and survival studies. Mice implanted with Omomyc‐producing GSCs survived longer than controls (Fig EV2A and B)—as recently reported 23—although the survival difference was moderate, as they finally showed neurological symptoms due to the presence of intracranial gliomas and were sacrificed. This is consistent with the observation that only a fraction of the engrafted cells were able to keep producing FlagOmomyc in vivo (Fig 2A), likely due to epigenetic silencing of the CMV promoter driving its expression. To better investigate the impact on tumour formation and expression of key glioblastoma features, we compared brain serial sections of control and Omomyc‐expressing xenografts of mice sacrificed before the onset of neurological symptoms. The fraction of proliferating cells in the Omomyc‐expressing xenografts was similar to controls (Ki67 staining in Figs 2B and EV2C) while the density of human cells was strongly reduced (Fig 2H), indicating that Omomyc‐expressing cells may have a slower cell cycle in vivo. The presence of Omomyc was correlated with the upregulation of GFAP and βIII‐tubulin and the downregulation of the GSC marker OLIG2 (Figs 2E–G and EV2C). The number of migrating cells—detected by immunostaining of the neuronal precursor migration marker DCX (doublecortin)—was significantly reduced (Figs 2D and EV2C). An extensive proliferation of blood vessels is a pathological feature of glioblastoma that distinguishes it from less aggressive gliomas. Omomyc strongly repressed vascularization of the tumour stroma (CD31 staining in Fig 2C). Therefore, MYC inhibition in GSCs suppresses their intrinsic tumorigenic features but also induces cell non‐autonomous changes on the tumour microenvironment that impair blood vessel formation.
Figure EV2. Omomyc expression in BT168 and BT308 GSC xenografts results in improved survival and decreased aggressiveness.
-
A, BCumulative survival curves constructed according to the Kaplan–Meier method show an increased survival of mice after implantation of Omomyc‐expressing GSCs compared to controls (n = 7/group/cell line; P = 0.01 for BT168; P = 0.0006 for BT308).
-
CImmunostaining of Ki67, DCX and GFAP on BT308 xenograft tumours derived from control and Omomyc‐expressing GSCs (n = 3/group/cell line).
Figure 2. Reduced migration and vascularization, and increased differentiation in xenografts of Omomyc‐expressing GSCs.
-
A–HImmunostaining of representative xenografts derived from naïve (control) and Omomyc‐expressing BT168FO cells. (A–D) Flag, Ki67, CD31 and DCX (doublecortin) immunostaining of adjacent sections in control and Omomyc xenografts. (E–G) Differentiation phenotype investigated by GFAP, βIII‐tubulin, and OLIG2 staining. (H) Immunostaining for anti‐human nuclei. Representative images are shown. Scale bar = 100 μm.
Impact on MYC genome occupancy
MYC binds DNA at E‐boxes in thousands of genomic loci 3. To assess the consequences of Omomyc expression on MYC DNA binding, we performed chromatin immunoprecipitation with a MYC antibody coupled with DNA sequencing (ChIP‐seq) in BT168FO cells treated or not with Dox for 24 h (Dataset EV1). Over 12,000 MYC peaks were detected in cells untreated with Dox: 36% localized at RNA polymerase II (Pol II) promoters, defined as –1,000 to +100 bp regions surrounding transcription start sites (TSSs), 37% intragenic, and 27% intergenic. A MYC enrichment area was present in about 21% of all RefSeq promoters. A similar distribution was found in the U87MG (U87) glioblastoma cell line that represents the bulk of tumour cells (not shown), concordant with published data 11. Less than half of the U87 peaks overlapped BT168 peaks, consistent with the view that many MYC targets are cell type specific 3. To verify that MYC binding was indeed associated with the presence of the E‐box, we conducted an enrichment analyses of transcription factor DNA‐binding motifs in the MYC‐bound regions (Table 1). In cells untreated with Dox (Table 1, left), E‐boxes were the most significantly enriched motifs, but we also found a strong over‐representation of binding sites of other TFs (SP1, E2Fs, EGR1 and 2, NRF1, KLF4) implicated in cell cycle progression, stemness, metabolism and response to extracellular signals.
Table 1.
Motif enrichment analysis of Myc‐ and Omomyc‐bound DNA sequences
| BT168FO no Dox | BT168FO +Dox | BT168FO +Dox | ||||||
|---|---|---|---|---|---|---|---|---|
| Myc‐bound motif | ID | G_P VALUE | Myc‐bound motif | ID | G_P VALUE | Omomyc‐bound motif | ID | G_P VALUE |
| Myc | MA0147.1 | 0 | TBP | MA0108.1 | 7.16E‐80 | ZEB1 | MA0103.1 | 4.82E‐189 |
| Mycn | MA0104.2 | 0 | MEF2A | MA0052.1 | 1.56E‐78 | ZNF263 | MA0528.1 | 2.34E‐91 |
| MYC::MAX | MA0059.1 | 0 | MEF2C | MA0497.1 | 3.21E‐78 | PLAG1 | MA0163.1 | 1.64E‐70 |
| USF1 | MA0093.1 | 0 | FOXL1 | MA0033.1 | 1.54E‐73 | Klf4 | MA0039.1 | 7.53E‐43 |
| Arnt | MA0004.1 | 0 | Foxd3 | MA0041.1 | 1.62E‐67 | Mycn | MA0104.1 | 2.03E‐41 |
| HIF1A::ARNT | MA0259.1 | 0 | ARID3A | MA0151.1 | 6.43E‐65 | MZF1_5‐13 | MA0057.1 | 8.20E‐35 |
| Arnt::Ahr | MA0006.1 | 0 | Lhx3 | MA0135.1 | 1.17E‐56 | YY1 | MA0095.1 | 8.62E‐35 |
| NRF1 | MA0506.1 | 0 | Prrx2 | MA0075.1 | 6.80E‐54 | NR2C2 | MA0504.1 | 3.39E‐34 |
| ZBTB33 | MA0527.1 | 0 | FOXP1 | MA0481.1 | 1.67E‐44 | E2F6 | MA0471.1 | 2.89E‐31 |
| EGR2 | MA0472.1 | 0 | CDX2 | MA0465.1 | 8.95E‐43 | SP1 | MA0079.2 | 1.05E‐29 |
| TFAP2A | MA0003.1 | 0 | Pax4 | MA0068.1 | 4.07E‐42 | Spz1 | MA0111.1 | 1.79E‐29 |
| E2F3 | MA0469.1 | 0 | Nkx2‐5 | MA0063.1 | 8.36E‐40 | Arnt | MA0004.1 | 1.63E‐28 |
| E2F1 | MA0024.2 | 0 | Mecom | MA0029.1 | 9.81E‐40 | Myc | MA0147.2 | 4.79E‐27 |
| PLAG1 | MA0163.1 | 0 | ZEB1 | MA0103.1 | 2.53E‐39 | EWSR1‐FLI1 | MA0149.1 | 6.62E‐27 |
| E2F4 | MA0470.1 | 0 | POU2F2 | MA0507.1 | 6.76E‐39 | Zfx | MA0146.2 | 7.16E‐24 |
| NFKB1 | MA0105.2 | 0 | FOXI1 | MA0042.1 | 1.39E‐38 | USF1 | MA0093.1 | 7.27E‐24 |
| Zfx | MA0146.2 | 0 | IRF1 | MA0050.2 | 1.24E‐36 | PPARG::RXRA | MA0065.2 | 5.81E‐22 |
| E2F6 | MA0471.1 | 0 | HNF1A | MA0046.1 | 1.16E‐34 | MAX | MA0058.2 | 6.88E‐22 |
| EGR1 | MA0162.2 | 0 | Pdx1 | MA0132.1 | 1.80E‐34 | MZF1_1‐4 | MA0056.1 | 1.21E‐19 |
| SP1 | MA0079.3 | 0 | SRY | MA0084.1 | 1.44E‐31 | SP2 | MA0516.1 | 1.27E‐18 |
| Klf4 | MA0039.2 | 0 | Pou5fl::Sox2 | MA0142.1 | 2.52E‐26 | PAX5 | MA0014.2 | 1.86E‐18 |
| SP2 | MA0516.1 | 0 | Foxq1 | MA0040.1 | 9.67E‐26 | E2F3 | MA0469.1 | 2.08E‐16 |
| KLF5 | MA0599.1 | 0 | Sox2 | MA0143.2 | 1.45E‐25 | Bhlhe40 | MA0464.1 | 1.50E‐15 |
Motif enrichment calculated by PscanChIP 64 from Myc and Omomyc ChIP‐seq data in BT168FO cells, treated or not with doxycycline for 24 h. Motif IDs are from Jaspar database (http://jaspar.binf.ku.dk/).
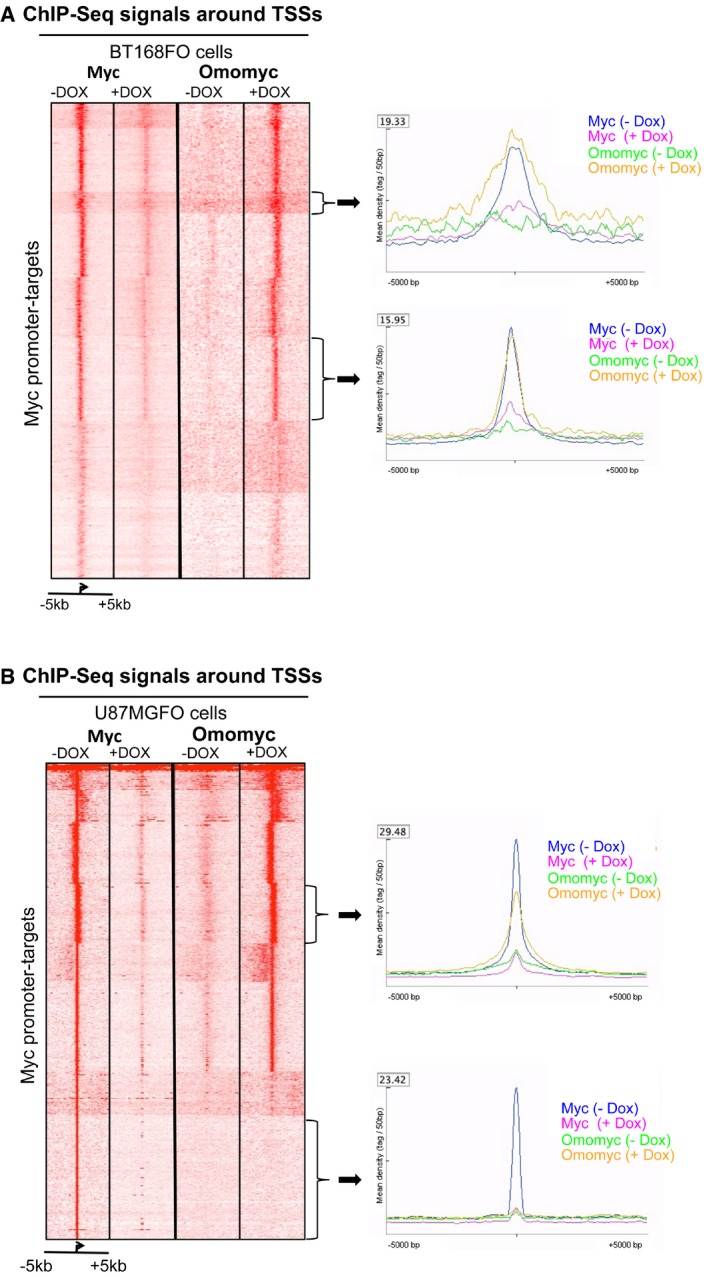
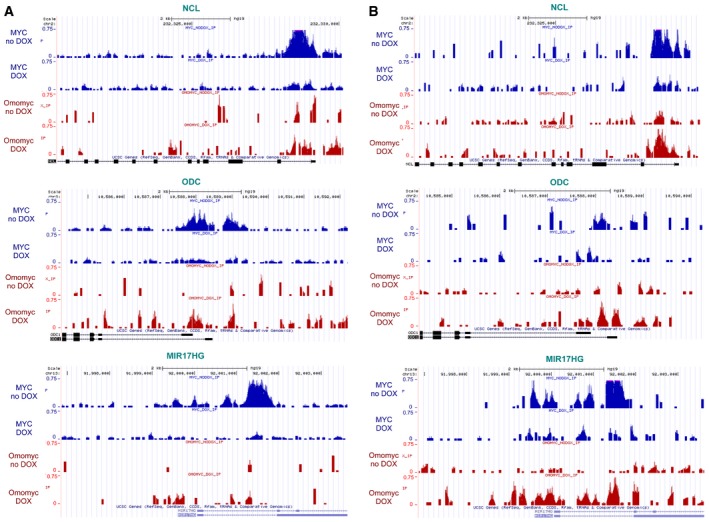
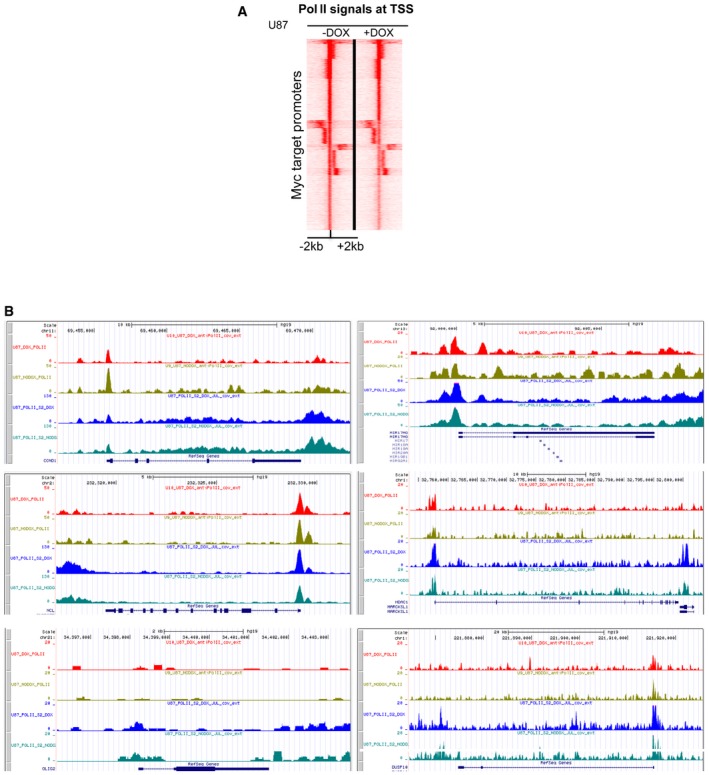
The presence of Omomyc led to a strong, genomewide attenuation of MYC signals at promoters in BT168FO (Fig 3A) and U87FO (Fig 3B) cells. The MYC molecules that were still bound to chromatin lost the preferential association with E‐boxes and the other motifs found in naïve cells and were mainly connected with AT‐rich regions and binding motifs of other TFs (MEF2A, MEF2C and FOX family factors) associated with neurogenesis and differentiation (Table 1, middle). Therefore, Omomyc appears to interfere with proper MYC localization on the genome. MYC signal depletion at promoters might be due to inhibition of MYC/MAX dimer formation 17 as well as to occupancy of MYC binding sites by Omomyc 17. To clarify this point, we performed ChIP‐seqs with Flag antibodies in cells treated or not with Dox for 24 h and compared them with MYC ChIP‐seqs in the same conditions (Fig 3A and B). As indicated by the motif enrichment analyses of Table 1, Dox treatment led to the appearance of Omomyc DNA binding signals, with a preference for sequence motifs—like the E‐boxes and other—also bound by MYC. The attenuation of MYC signals around TSSs observed in Dox‐treated cells was accompanied by the appearance of Omomyc signals in the same regions, as pointed out by heatmaps (left) and signal profiles of gene clusters (right) in Fig 3A and B. The appearance of Omomyc binding at promoters that lost MYC binding seemed to occur globally in BT168FO cells (3A), whereas a set of genes in U87FO cells—the bottom clusters in Fig 3B—did not appear to gain Omomyc signal upon MYC binding loss. The patterns of normalized MYC and Omomyc ChIP‐seq signals on three well‐established and widespread MYC target genes—NCL (nucleolin), ODC1 (ornithine decarboxylase) and MIR17HG (miR‐17‐92 microRNA cluster host gene)—in BT168FO (Fig EV3A) and U87FO (Fig EV3B) support the view that Omomyc is enriched at target promoter regions upon attenuation of MYC signals. It is however unclear whether Omomyc precisely replaces MYC because Omomyc peaks—like in one of the gene clusters of Fig 3A—have some tendency to be more diffuse than MYC ones and the signal enrichments are not always strong, possibly due to a limited efficiency of the Flag antibody in the Flag‐tagged Omomyc ChIP. The reciprocal DNA binding pattern of MYC and Omomyc observed in the ChIP‐seqs was validated through qChIP assays on single genes, including NCL and MIR17HG (Fig EV4). We also performed qChIP assays with MAX antibodies in order to answer the question whether Omomyc binds E‐boxes in partnership with MAX, with which it is able to dimerize 17. Omomyc inhibited MAX binding to DNA (Fig EV4), to indicate that Omomyc does not bind to DNA in a complex to MAX, but rather as homodimer, which is its most abundant state within cells 21.
Figure 3. Loss of MYC and appearance of Omomyc ChIP‐seq signals around TSSs of MYC promoter‐target genes.
-
A, BSeqminer heatmaps of MYC and Omomyc levels around TSSs of all MYC promoter‐target genes in BT168FO (A) and U87FO (B) cells, treated or not with Dox for 24 h. TSS regions are ranked by decreasing MYC occupancy in untreated cells. Each row shows the ± 5‐kb region centred on TSSs. Colour scaled intensities are in units of tags per 50 bp. The plots adjacent to each heatmap depict MYC and Omomyc binding patterns at genes in the two gene clusters denoted by arrows, in cells treated or not with Dox.
Figure EV3. MYC and Omomyc ChIP‐seq signals at select target genes.
-
A, BTracks of MYC (blue) and FlagOmomyc (red) binding enrichments at three select MYC target genes: NCL (nucleolin), MIR17HG (host gene of the miR‐17‐92 microRNA cluster), and ODC1 (ornithine decarboxylase) in BT168FO (A) and U87FO (B) cells treated or not with Dox. The x‐axis displays genomic position. The y‐axis shows normalized signal intensities in RPM (reads per million).
Figure EV4. Attenuation of MYC and MAX binding and concomitant Omomyc binding at NCL, miR‐17‐92, HDAC1 and DUSP10 promoters.
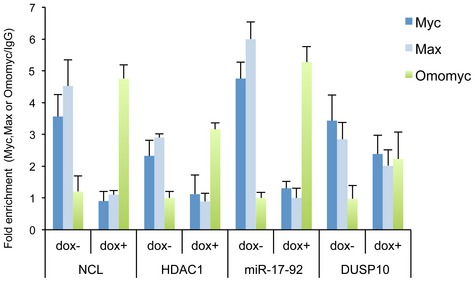
ChIP assay of chromatin isolated from BT168FO cells treated or not with Dox and immunoprecipitated by Flag, Myc, Max antibodies and control IgGs. qPCR analysis of immunoprecipitated chromatin was done with primers targeted to NCL (nucleolin), miR‐17‐92, HDAC1 and DUSP10 promoters (n = 3; mean ± SEM). The data show occupancy relative to control IgG.
Omomyc minimally—or not at all—influences RNA Pol II loading at promoters and transcript elongation and affects transcription in a subset of targets only
MYC is found at promoters of most transcriptionally active genes. High MYC levels cause transcriptional amplification producing increased level of transcripts, by promoting transcriptional pause release at all active promoters; this correlated with increased levels of elongation‐associated Ser2‐phosphorylated RNA Pol II (Pol II Ser2p) as compared with initiation‐associated Ser5‐phosphorylated RNA Pol II (Pol II Ser5p) 10, 11. We asked whether loss of MYC and gain of Omomyc binding would influence Pol II loading at promoters and transcriptional elongation, and globally affect mRNA production. To clarify this point, we performed Pol II ChIP‐seq experiments in BT168FO and U87FO cells treated or not with Dox for 24 h (Figs 4 and EV5), and compared the results with RNA‐sequencing data (Dataset EV2). We did not observe relevant global changes of Pol II loading around TSSs between cells expressing or not Omomyc; a similar conclusion regarding TTSs (Transcription Termination Sites) can be drawn from a Pol II Ser2p ChIP‐seq (Figs 4 and EV5). We tried different approaches, but only a negligible fraction of genes showed significant enrichment changes of either Pol II at TSSs (2% of all genes and 4% of MYC promoter‐target genes) or Pol II Ser2p at the TTSs (1% of all genes). Also, the changes were more or less equally split between genes with greater enrichment in −Dox and those with more enrichment in +Dox cells. We also performed validating qChIPs with Pol II Ser2p and Ser5p specific antibodies on single MYC target genes (Fig 4D). Although minor changes in Pol II Ser2p and Ser5p levels could be found in these genes, their relative ratios remained constant upon Omomyc expression (Fig 4D), suggesting that Omomyc does not significantly impact transcriptional pause release. To further clarify this point, we directly investigated pause release by measuring the RNA Polymerase II travelling ratio—defined as in 4—from the Pol II ChIP‐seqs, in the presence or absence of Omomyc. We found the same travelling ratio distribution reported by Rahl and co‐workers 4—which validates our data—but minimal changes upon Omomyc expression (Fig 4E). We think that all these data are sufficient to infer that Omomyc only marginally affects global Pol II loading at promoters, pause release and transcriptional elongation.
Figure 4. Transcription at some MYC target promoters is modulated by Omomyc.
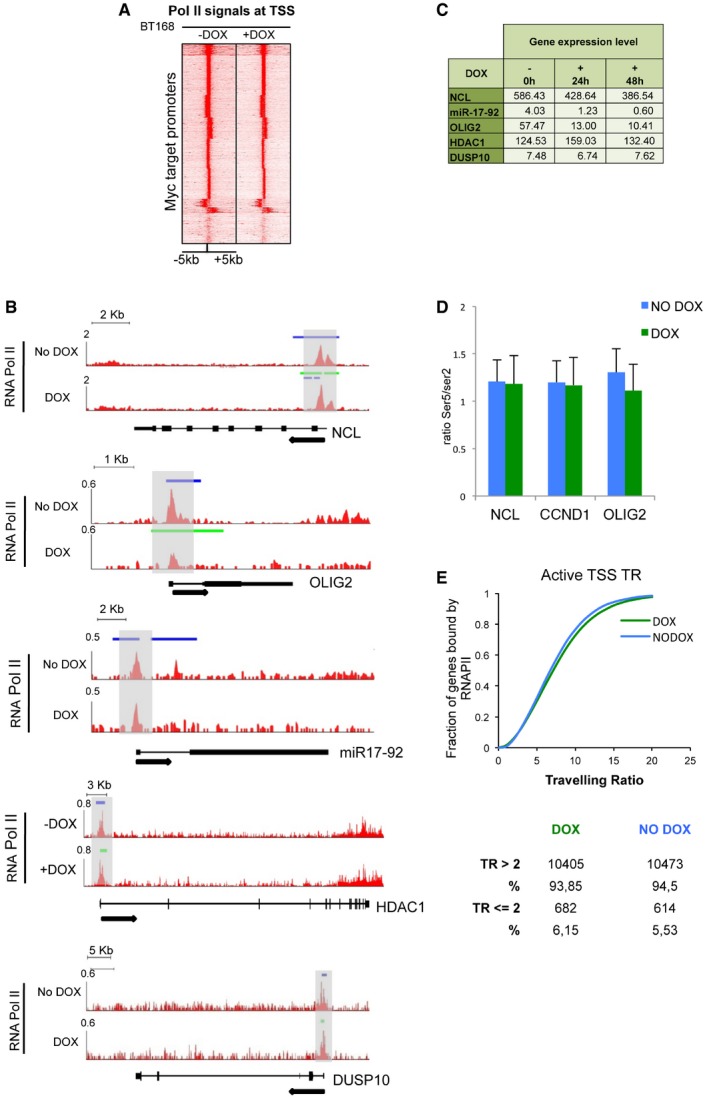
- Heatmap of RNA Pol II levels around TSSs of MYC promoter‐target genes in BT168FO cells, treated or not with Dox for 24 h. TSS regions are ranked by decreasing MYC occupancy in untreated cells. Each row shows the ± 5‐kb region centred on TSSs. Colour scaled intensities are in tags/50 bp.
- Tracks of Pol II binding signals (ChIP‐seq) at NCL, miR‐17‐92, OLIG2, HDAC1 and DUSP10 genes in BT168FO cells treated or not with Dox for 24 h. The y‐axis shows Pol II binding signals as tags/500 bp per million reads. The x‐axis displays genomic positions; introns as lines, exons as boxes. Arrowheads denote direction of transcription. Blue and green bars denote the presence of MYC or Omomyc peaks, respectively. Grey boxes are TSS regions.
- Transcript levels (FPKM from RNA‐seq data) in BT168FO cells of the genes shown in (B). Data are means of three independent biological replicates.
- Ratio between fold enrichments (specific antibody/IgG signal) derived from qChIPs of Pol II‐Ser2p and Pol II‐Ser5p (n = 3; mean ± SD).
- RNA Polymerase II travelling ratio distribution from the Pol II ChIP‐seqs, in the presence or absence of Dox.
Figure EV5. RNA Pol II and Pol II Ser2p loading is minimally affected by Omomyc.
- Seqminer heatmaps of Pol II levels around TSSs of MYC promoter‐target genes in U87FO cells, treated or not with Dox for 24 h. Each row shows the ± 2 kb regions centred on TSSs. Colour scaled intensities are in tags/50 bp.
- Gene tracks of RNA Pol II (top two tracks for each gene) and Pol II Ser2p (bottom two tracks) binding at CCND1, NCL, OLIG2, MIR17HG (miR‐17‐92), HDAC1 and DUSP10 genes in U87FO cells treated (DOX) or untreated (NODOX) with Dox for 24 h.
We did not detect a global correlation among loss of MYC binding, gain of Omomyc binding and decreased transcript levels. This correlation was detectable in a subset of genes only, as exemplified by the five genes in Fig 4: NCL, miR‐17‐92 (MIR17HG), OLIG2, HDAC1 and DUSP10. They all were expressed at good levels (FPKM > 4) in BT168FO cells and showed attenuation of MYC binding [blue] upon Dox treatment (Fig 4B and C). Attenuation or loss of MYC and gain of Omomyc signal (green) was accompanied by minimal changes of Pol II signals at promoters, gene bodies and termination regions, with the exception of OLIG2 (Fig 4B). NCL, miR‐17‐92 and OLIG2 displayed clearly decreased transcript levels (Fig 4C). NCL and miR‐17‐92 are known to be upregulated by MYC in a variety of cell contexts, whereas OLIG2 is a master controller of neural stem cell behaviour whose regulation by MYC was unknown. The correlation between decreased MYC binding and decreased transcript level was instead absent in HDAC1 and DUSP10 (Fig 4B and C), whose mRNA levels were unaffected or barely affected by the attenuation of MYC signals at their promoter regions (Fig 4C). Similar data were found in U87FO cells, in which the only significant difference from BT168FO concerned OLIG2, which was silenced in U87 cells and showed no MYC or Omomyc signal and no significant Pol II binding (Fig EV5). In some instances, loss of MYC binding was even associated with transcript upregulation. An example is PPP2R5A—encoding a regulatory subunit of protein phosphatase 2—which was upregulated about fourfold upon loss of MYC promoter binding (not shown). Thus, decreased MYC occupancy at promoters was not always associated with decreased transcription, and in many cases, the transcript levels were unaffected or even increased.
Impact on cancer stem cell transcriptome
The comparison between ChIP‐seq and RNA‐seq data of BT168FO cells (Datasets EV1 and EV2) showed that 94% of MYC promoter‐target genes were transcribed (FPKM > 0) in cells untreated with Dox; similar data were obtained in U87FO cells. Therefore, transcriptionally active promoters in glioblastoma cells had a strong preference for MYC, similarly to active promoters—as well as enhancers—in other cell types 5, 10, 11. Promoter occupancy by MYC increased together with transcript level (Fig 5A, black), confirming the correlation between increased transcription and increased MYC promoter occupancy 5, 11. Upon Dox treatment, promoter occupancy by MYC decreased (see also Fig 3) and no longer grew together with gene expression level (Fig 5A, blue). From RNA‐seq transcript levels (FPKM) in Dox‐treated and untreated cells, we computed the expression changes of MYC‐bound genes, subdivided into promoter‐targets presenting a MYC peak at their promoter, intragenic targets with a peak on gene body and intergenic targets with a peak within a 50‐kb range from the TSS compatible with the location of an enhancer or super‐enhancer influencing gene transcription (Fig 5B). The mean expression fold changes were low—about 20–30%—but similar at all transcript expression levels, and were comparable between up and downregulated transcripts (Fig 5B). A similar distribution was observed in non‐target genes as well (Fig 5C). Expression changes were clearly shifted towards negative values (downregulation) only in the most highly expressed MYC targets (Fig 5B). Transcripts not so highly expressed represented the large majority of the genes and were comparably distributed between up‐ and downregulated.
Figure 5. Omomyc‐dependent gene expression changes.
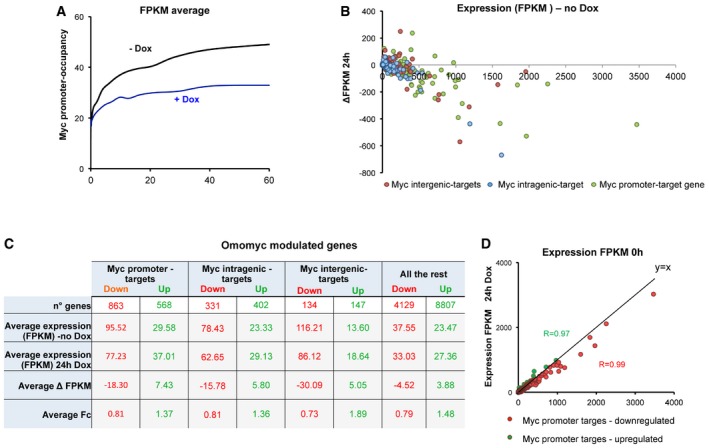
- Promoter occupancy by MYC correlates with transcript levels in cells untreated with doxycycline (black line). In doxycycline‐treated cells promoter occupancy by MYC is lower, and no longer increases together with transcript levels. The scatter plot displays MYC ChIP‐seq reads at promoters (−1,000, +100 regions with respect to TSS) in BT168FO cells: untreated (black) or upon 48 h of Dox treatment (blue) versus transcript levels (FPKM from RNA‐seq data).
- Distribution of transcript level differences (Δ FPKM) of single genes classified as promoter‐targets (green), intragenic‐targets (blue), intergenic‐targets (red) in Dox‐treated (24 h) versus untreated cells, plotted against expression in untreated cells (n = 3). Δ FPKM = FPKM_24 h Dox – FPKM_no Dox.
- The table first row shows the number of genes significantly up‐ or downregulated at 24 h of Dox treatment, subdivided into promoter‐, intragenic‐, intergenic‐targets (± 50 kbp from TSS) and the rest. The following rows depict—for each gene class—mean (average) values of FPKM in cells treated or not with Dox for 24 h and the corresponding Δ FPKM and fold change (FC). Data are from three independent biological replicates.
- Transcript level distribution of MYC promoter‐targets significantly down (red dots) or up (green dots) modulated in cells treated with Dox for 24 h versus untreated cells. Transcript levels, expressed as FPKM, represent averages of three independent experiments.
We focused on the transcripts most significantly modulated upon MYC inhibition. From RNA‐seq data for each time point of Dox treatment (4–48 h) versus untreated cells (Dataset EV2), we defined the significantly modulated transcripts through CuffDiff2, as well as by applying a fold change cut‐off (log2FC ≥ 0.25 or ≤ −0.25) and requiring a P‐value threshold. We also assessed the significantly modulated MYC targets by Gene Set Enrichment Analysis (GSEA, www.broadinstitute.org/gsea/). The outcomes of these approaches were coherent. The average fold changes of all classes of significantly modulated transcripts were similar (Fig 5C). The significantly modulated MYC promoter‐targets (Fig 5D) presented a strong linear correlation (R = 0.94–0.99) between expression in the presence of Omomyc (24 h Dox) and in untreated cells. Again, only the more highly expressed target transcripts were preferentially downregulated (Fig 5C and D). In conclusion, MYC inhibition influenced the expression level of several thousand transcripts, a relevant fraction of which displayed a MYC peak at promoter, gene body or intergenic region. Only the more highly expressed genes tended to be repressed upon MYC inhibition. The average transcript fold change was very similar for up‐ and downregulated transcripts.
To clarify the function of Omomyc‐modulated genes, we looked for overlaps between genes—both MYC targets and not—modulated by Omomyc in BT168FO cells at 4, 8, 16, 24 and 48 h of Dox treatment and the hallmark gene sets of the Molecular Signature Database (MSigDB, at Broadinstitute.org). We found highly significant overlaps with gene sets defining epithelial–mesenchymal transition, TNFA signalling via NF‐κB, hypoxia, oxidative phosphorylation, angiogenesis, inflammatory response, p53 signalling, beta‐catenin signalling, mitotic spindle, UV response, E2F targets, glycolysis, NOTCH signalling, MTORC1 signalling, DNA repair, KRAS signalling (Dataset EV3 and Appendix Fig S1). This suggests a broad role in regulating stemlike cell and cancer relevant pathways.
Impact on key controllers of tumorigenesis and glioblastoma stem cell identity
All this indicates that MYC influences the entire gene expression network but does not explain how the expression changes of thousands of genes may have a tumour suppression‐specific effect that hits practically all cancer stem cell features. This might be explained if MYC inhibition by Omomyc especially acted on the control points of gene expression programmes that determine cancer stem cell behaviour, because even small changes in master regulator expression may affect large gene sets and lead to strong phenotypic changes. To clarify this aspect, we investigated the expression of a set of genes selected for being related to such control points according to literature data. We took into account universal MYC targets mediating its tumorigenic properties, transcription factors and other molecules involved in tumorigenesis and tumour suppression in various tumours including glioblastoma, and cell‐specific factors that maintain the glioblastoma cancer stem cell phenotype. Among the universal MYC targets, we examined CCND1, CDK6 and NCL—which are implicated in cell proliferation and cell growth control and have a role in glioblastoma 35, 36, 37—and miR‐17‐92. They were all strongly downregulated by Omomyc (Fig 6A). miR‐17‐92 maintains a neoplastic state by suppressing the expression of chromatin regulatory genes like Sin3b (cellular senescence regulator), Hbp1 (neurogenesis modulator) and Btg1 (neuronal precursor regulator) 9. Omomyc also strongly repressed FOS, JUN and ID4 transcripts encoding oncogenic transcription factors that have a role in glioblastoma. On the contrary, it upregulated the tumour‐suppressive phosphatases PTEN and PPP2R5A (protein phosphatase A regulatory subunit), a controller of mitotic progression, and the long non‐coding RNA (lncRNA) MIAT/GOMAFU involved in neurogenic commitment and differentiation 38. All these genes were more strongly regulated than average; PPP2R5A and MIAT were among the most strongly upregulated transcripts. We also considered a set of genes—the dual specificity protein kinase phosphatases (DUSPs), which control MAP kinase signalling—chosen with no bias regarding literature data. Omomyc can affect components of this family in either direction (Fig 6A). Notably, Omomyc strongly affected the expression of DUSPs 4, 5, 6, which have been implicated in GBM 39.
Figure 6. Omomyc resets gene expression programmes of glioblastoma stemlike cells.
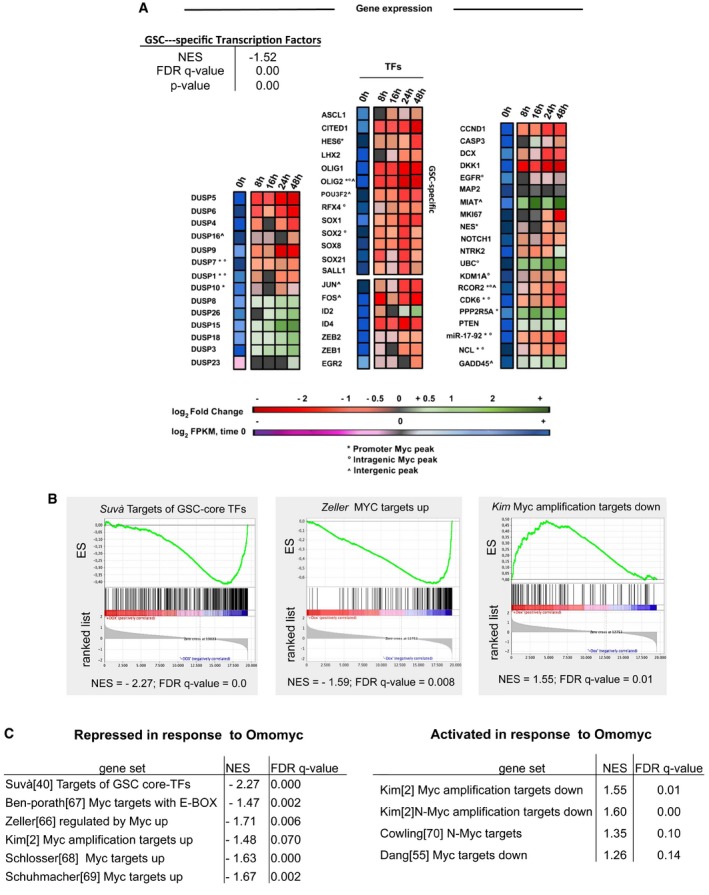
- RNA‐seq expression values of select genes in BT168FO GSCs along a 48‐h time course of Omomyc induction (n = 3 independent biological replicates). The block on the left represents DUSP (dual specificity phosphatase) family genes. The middle block contains transcription factors (TFs): the upper thirteen (ASCL1–SALL1) are GSC‐specific and the remaining ones are oncogenic. The right block contains genes, including well‐known MYC targets, with functions in proliferation, neurodifferentiation and gliomagenesis. The first column of each block represents the average expression (log2FPKM) in untreated cells (0 h) in the colour scale illustrated by the lower bar: violet indicates low and blue high expression. The other columns depict relative expression versus untreated cells (average log2FC) at different times (8–48 h) of Dox treatment, according to the scale shown by the upper bar: red indicating low and green high expression. The table in the upper left summarizes the GSEA score of the set 19 GSC‐specific transcription factors 40, showing a significant downregulation by Omomyc.
- Enrichment plots obtained by GSEA (Gene Set Enrichment Analysis) of RNA‐seq data from BT168FO cells. (Left) Genes downregulated by Omomyc in BT168FO identify the set of genes targeted by the GSC core TFs 40. (Middle) Omomyc‐downregulated genes identify a gene set upregulated by MYC in cancer cells 66. (Right) Genes upregulated by Omomyc identify genes downregulated in small cell lung cancers carrying MYC amplification 2.
- The tables show enrichment analyses of various examples of MYC‐regulated gene sets 67, 68, 69, 70 present in MSigDB (http://www.broadinstitute.org/gsea/msigdb) and of the gene set targeted by the GSC core TFs 40, versus genes repressed (left table) or induced (right table) by Omomyc in the RNA‐seq data set.
The gene regulatory programmes responsible for cell identity are controlled by a limited set of master transcription factors that vary among the different cell types. GSCs present a set of 19 TFs that are specifically active and include a core subset of only four of them that are sufficient for maintaining GSC phenotypes in vitro and in vivo; the four core TFs target a set of 325 genes 40. By Gene Set Enrichment Analysis, we found that the set of 19 GSC‐specific TFs was significantly associated with repression in response to Omomyc (Fig 6A). Notably, three of the four core TFs—POU3F2, SOX2 and OLIG2—were MYC targets and were scored downregulated by GSEA (Fig 6A; Datasets EV1 and EV2). Consistently, Omomyc repressed both components of the KDM1A (LSD1) lysine‐specific histone demethylase/RCOR2 complex, which is a key OLIG2 effector in GSCs 40, 41 (Fig 6A); both genes were MYC targets as well. Finally, the set of 325 targets of the core TFs was associated with repression by Omomyc (Fig 6B and C). In conclusion, MYC inhibition strongly influenced the transcript levels of key TFs responsible of GSC identity, of their targets and of chromatin modifiers involved in their activity.
Moreover, by interrogating the Molecular Signature Database we observed that Omomyc expression was negatively correlated with the proneural gene expression signature that is associated with resistance to current therapies for glioblastoma [42; not shown]. We asked whether MYC‐modulated gene signatures obtained in other cell types were significantly enriched among the transcripts modulated by Omomyc in GSCs. By GSEA software, we found that several signatures of MYC‐upregulated genes present in MSigDB hallmark gene sets were associated with downregulation by Omomyc in GSCs, while the opposite was true for the MYC‐downregulated signatures (Fig 6B and C, Dataset EV3 and Appendix Fig S1). Therefore, Omomyc affected genes commonly modulated by MYC in other contexts.
microRNAs modulated upon MYC inhibition affect basic features of glioblastoma cells
Some microRNAs are known to mediate MYC function and to be involved in glioblastoma 43, 44, 45. To identify those responding to MYC inhibition, we analysed through qRT–PCR arrays the miR expression profiles of two GSC cell types, BT168FO and BT275FO. We selected miRs that were either upregulated ≥ 1.5‐fold or downregulated ≤ 0.5‐fold in both: 21 miRs were downregulated and 41 upregulated (Table 2; Dataset EV4). One third of the downregulated miRs were members of the miR‐17‐92 cluster and the cognate cluster on chromosome X. The upregulated ones included the tumour‐suppressive microRNAs miR‐15a and miR‐16, as well as miR‐23a—an inhibitor of glutaminase, which restrains glutamate consumption as energy source, encoded by two clusters repressed by MYC 6, 46, 47. We performed pathway analysis of presumptive targets of the Omomyc‐modulated miRs by means of DIANA‐miRPath 48 (Fig 7A). The highest ranking pathways (pathways in cancer, cell cycle, glioma and others) were consistent with the notion that Omomyc may influence GSC properties via miRs. Notably, targets of upregulated miRs had a strong correlation with terms such as DNA replication, Ribosome, Wnt signalling, indicative of a role in repressing glioblastoma cell growth 49. The downregulated miRs affected focal adhesion, suggesting that their downregulation may contribute to restrain cancer stem cell migration. We then interrogated the TCGA (The Cancer Genome Atlas; cancergenome.nih.gov) database in order to assess the potential role of miRs modulated by Omomyc in clinical cases of glioblastoma. We asked whether they presented expression differences between human glioblastoma and normal brain samples. Nine of the Omomyc‐downregulated miRs were enriched in the set of miRs overexpressed in GBM (Table EV1); two (miR‐299‐5p and miR‐107) showed the opposite behaviour, and the others were not modulated in the TCGA data set. Among the Omomyc‐induced miRs, seven were underexpressed in GBM versus normal brain, whereas twelve were overexpressed, suggesting that the latter may have a different role in GSCs as compared with the bulk of the tumour mass. Thus, a large fraction of the miRs repressed by Omomyc in GSCs and a smaller part of the induced ones may be controlled by MYC and relevant for glioblastoma.
Table 2.
Omomyc‐modulated microRNAs
| Upregulated | Downregulated | |
|---|---|---|
| miR‐125a‐5p | miR‐23a‐3p | miR‐107 |
| miR‐126 | miR‐24‐1‐5p # | miR‐18a‐5p; miR‐19a‐3p; miR‐19b‐3p; miR‐20a‐5p # |
| miR‐132; miR‐212 | miR‐28‐3p | miR‐18b‐5p; miR‐20b‐5p; miR‐363‐3p |
| miR‐138 | miR‐331‐3p | miR‐193a‐5p |
| miR‐139‐5p | miR‐320 | miR‐199b‐3p |
| miR‐140‐3p | miR‐339‐3p | miR‐299‐5p; miR‐494‐3p |
| miR‐146b‐5p | miR‐342‐3p | miR‐337‐5p |
| miR‐150‐5p | miR‐345 | miR‐34a‐5p |
| miR‐152 | miR‐449b‐5p | miR‐367 |
| miR‐15a‐5p; miR‐16‐5p | miR‐450a‐5p | miR‐519a‐3p |
| miR‐182‐5p; miR‐183‐5p | miR‐454‐3p | miR‐542‐3p |
| miR‐186‐5p | miR‐483‐5p | miR‐597‐3p |
| miR‐191‐5p | miR‐484 | miR‐618 |
| miR‐192‐5p; miR‐194‐5p | miR‐545‐3p | miR‐629‐5p |
| miR‐193b‐3p | miR‐574‐3p | miR‐652‐3p |
| miR‐196b‐5p # | miR‐616‐3p | |
| miR‐200a‐3p; miR‐429 # | miR‐628‐5p | |
| miR‐210 | miR‐708‐5p |
Results of qRT–PCR array of microRNA expression upon Dox treatment of BT275FO and BT168FO glioblastoma stem cells. Only those microRNAs that were consistently modulated in both are shown. Upregulated: ≥ 1.5‐fold compared to uninduced control. Downregulated: ≤ 0.5‐fold versus control. MicroRNAs known to be clustered in the genome and consistently modulated are indicated together. The symbol # indicates microRNAs or microRNA clusters whose precursors were found consistently modulated in our RNA‐seq data.
Figure 7. Omomyc‐modulated microRNAs in glioblastoma stemlike cells.
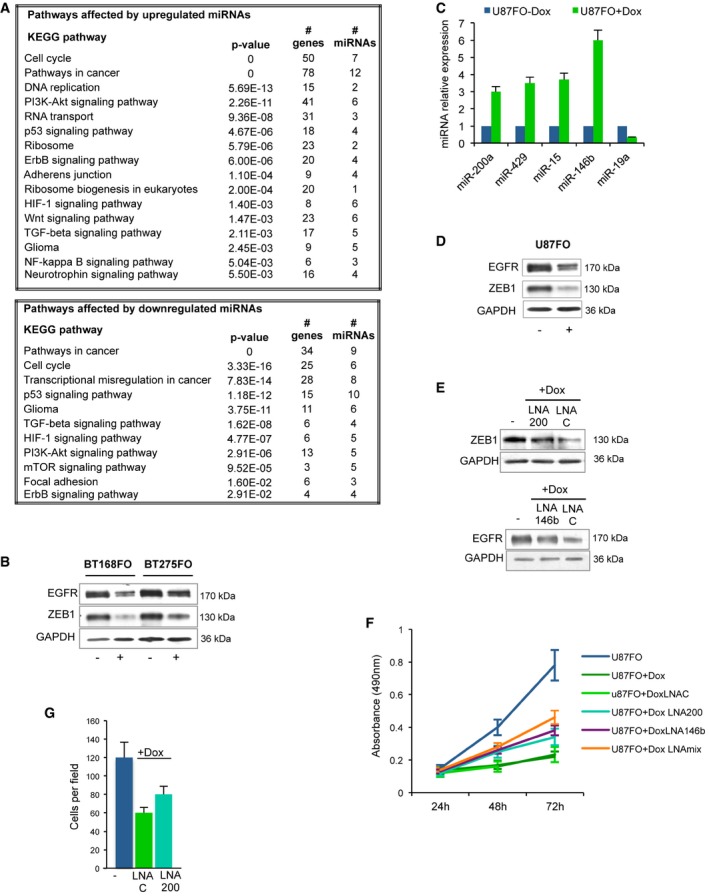
- List of KEGG pathways significantly enriched in the genes targeted by miRs up‐ or downregulated upon Omomyc induction (Table 2). The number of affected genes and the number of miRs targeting them are indicated for each pathway together with merged P‐values computed as in 48, denoting the probability that the examined pathway is not enriched with gene targets of at least one selected microRNA.
- Immunoblots of EGFR, ZEB1 and GAPDH loading control expression in BT168FO and BT275FO after 2 days with (+) or without (−) Dox. Representative images are shown.
- qRT–PCR expression analysis of selected miRs in U87FO cells grown 48 h in the presence (+) or absence (−) of Dox (n = 3; mean ± SD). Expression levels were normalized using U6 RNA as control. Expression levels in non‐induced cells were set as 1.
- EGFR, ZEB1 and GAPDH immunoblots in the same cells as in panel (C). Representative images are shown.
- EGFR, ZEB1 and GAPDH immunoblots in uninduced U87FO cells (−) and in cells transfected with LNA oligos targeting miR‐200a‐200b‐429 (LNA 200) and miR‐146b (LNA 146b), or with a non‐targeting LNA (LNA C), and induced with Dox for 48 h (+Dox). Representative images are shown.
- MTS cell proliferation assay of uninduced or Dox‐induced U87FO cells, transfected with either a non‐targeting LNA (LNA C), or LNA oligos targeting the miR‐200a‐200b‐429 cluster (LNA 200), miR‐146b (LNA 146b), or both (LNAmix) and analysed at 24, 48 and 72 h (n = 3; mean ± SD).
- Migration assay of U87FO cells transfected with non‐targeting control LNA oligos (LNA C) or with LNA oligos targeting miR‐200a‐200b‐429 (LNA 200); cells were either untreated (−) or treated with Dox for 24 h (+Dox); (n = 3; mean ± SD).
Among the upregulated miRs, we focused on miR‐146b and the miR‐200a‐200b‐429 cluster because the latter can target ZEB1 50—a controller of the epithelial to mesenchymal transition (EMT) and a promoter of invasion and therapy resistance in glioblastoma 51—while miR‐146b can target the EGF receptor (EGFR), whose overexpression is a hallmark of glioblastoma 52. ZEB1 and EGFR decreased upon Omomyc induction in GSCs (Fig 7B), indicating that they may be inhibited by these miRs. To prove this, we transfected U87FO cells with LNA oligos targeting miR‐200a‐200b‐429 and miR‐146b. Expression of miR‐146b and the miR‐200 cluster rose upon Omomyc induction in untransfected cells, EGFR and ZEB1 amounts were reduced, and cell growth dropped (Fig 7C, D, and F). The presence of the LNA oligos attenuated the decrease of EGFR and ZEB1 (Fig 7E) and partly rescued the growth inhibition (Fig 7F). The strongest effect was obtained by combining anti‐miR‐200 and anti‐miR‐146b. As ZEB1 is involved in the migratory potential of glioblastoma cells 51, we performed transwell migration assays (Fig 7G) and found that Omomyc induction nearly halved the migrating cell number; consistently, miR‐200a‐200b‐429 depletion led to partial recovery of the migratory potential. These data suggest that at least part of the anti‐migratory and anti‐proliferative effects of Omomyc may be exerted post‐transcriptionally, through the increased expression of miR‐146b and the miR‐200 cluster.
In conclusion, Omomyc especially affected the expression of key regulators of tumorigenic features and cancer stem cell properties by repressing genes and non‐coding RNAs positively correlated with tumorigenic properties and cancer stem cell identity, whereas the contrary was true for genes promoting differentiation or tumour suppression. This supports the hypothesis that MYC may act on the gene expression programme control nodes.
Discussion
We report the broad impact of the MYC inhibitor Omomyc on glioblastoma stem cell behaviour in vitro and in vivo (Figs 1 and 2). This appears to relate to changes in MYC binding to DNA. MYC binds to E‐boxes at regions around the transcription start sites of thousands of genes in GSCs (Fig 3). The MYC‐bound regions are also enriched in binding sites for other transcription factors such as E2F, EGR1, NRF1 and KLF4 (Table 1), suggesting that MYC may cooperate with these proteins—particularly with E2F as indicated by Appendix Fig S1 and Dataset EV3—to regulate subsets of genes involved in different aspects of GSC behaviour. Omomyc clearly disrupts proper MYC localization on the genome and binds to the MYC‐bound regions, presumably as homodimer (Figs 3, EV3 and EV4). In cells expressing Omomyc, there is less MYC and more Omomyc around TSSs (Fig 3), suggesting that Omomyc may replace MYC at promoters. However, this is not yet certain, as Omomyc peaks tend to be more diffuse and noisy.
The E‐boxes bound by MYC/MAX complexes are also targets of the extended MYC network complexes: complexes between MAX or MLX, and MXDs, ChREBP, and MONDOA 53. By occupying such E‐boxes (Table 1 and Figs EV3 and EV4), Omomyc may affect the whole network and influence differentiation and metabolic processes important for cancer cells 53. Moreover, it might prevent a strong downregulation of MYC target genes, by inhibiting MXD transcriptional repressor DNA binding. Consistent with this possibility, the transcripts modulated by Omomyc are on the average only weakly repressed (Fig 5).
It is well known that a deregulated MYC alters the levels of many transcripts, by either upregulation or downregulation 3. MYC overexpression leads to increased promoter and enhancer occupancy and transcriptional amplification 5, 10, 11, 12. Accordingly, genes more highly expressed tend to have more MYC at promoters (Fig 5A). Surprisingly, loss of MYC binding at promoters minimally affected Pol II binding (Figs 4 and EV5) and led to decreased transcript amounts in a subset of targets only (Figs 4 and 5). While Omomyc attenuated a large number of transcripts—as expected for a MYC inhibitor—it also enhanced a similar number, the average extents of up‐ and downregulation being comparable (Fig 5B–D). The finding that the more highly expressed targets clearly tend to be downregulated by Omomyc (Fig 5) is in good accordance with the model viewing MYC as an exponential‐type, rather than linear, amplifier that operates better on highly expressed versus weakly expressed transcripts 5, 54. While a nonlinear transcriptional amplification of the cancer cell expression programme caused by elevated MYC levels may elucidate tumorigenicity by MYC 10, 11, 54, it is still debated whether it represents its key oncogenic feature. It is also unclear that a deregulated MYC necessarily needs to be strongly overexpressed in order to be tumorigenic 1, 3, 5. This attractive model came out difficult to either prove or disprove in the absence of a better definition of the MYC‐amplifier transfer function 5. If MYC simply amplifies already expressed genes, it becomes difficult to account for groups of genes repressed by MYC 55: repression is thus believed to be only apparent, due a change in the relative ratio of amplified transcripts 5. It is uncertain that strongly increasing MYC would affect and reveal targets that were already repressed at low or moderate MYC levels since they would presumably continue to be repressed, with little change of their transcript levels. The levels of repressed targets are instead expected to increase upon MYC inhibition. We find that transcripts of many genes have an enhanced expression upon loss or attenuation of MYC binding to their promoters (Fig 5B–D) and that known MYC targets do not seem to respond to MYC inhibition by Omomyc more strongly when their transcript levels are higher (Fig 4C), as would be expected according to a strict amplification model 5. So, while the amplifier model is important and has high heuristic value, it is still undetermined whether it may give a full picture of MYC role in gene expression and cancer. The transcriptional outcome of MYC action might thus involve additional players such as lncRNAs or chromatin modifiers like the MYC‐associated methylosome (histone arginine methylase complex) and the modifications it triggers 56. Omomyc might influence composition and activity of MYC effector‐complexes associated with chromatin and participate itself in such complexes. Its action appears to involve as well effects different from those caused by the simple MYC inhibition—for example, the histone modification H4R3me2s, enhanced by both MYC and Omomyc 56, the inhibition of DNA binding by MAX and partners, and possibly other.
The relative levels of MYC‐modulated transcripts appear to be rebalanced in the presence of Omomyc, as indicated by known target gene signatures: those commonly enhanced by MYC are repressed, and vice versa (Fig 6, Appendix Fig S1, Dataset EV3). Consistently with this concept, mRNAs of genes promoting stemness and proliferation are downregulated, while those inhibiting growth, migration, angiogenesis or promoting differentiation are upregulated. This conclusion is confirmed by the microRNA expression profile: MYC‐upregulated miRs (miR‐17‐92 and miR‐106a/363 clusters) are decreased upon MYC inhibition whereas MYC‐downregulated miRs (miR‐15a, ‐16, ‐23a and ‐150) are increased (Table 2 and Dataset EV4). Omomyc inhibits the expression of miRs known to be pro‐oncogenic in glioblastoma, while increasing expression of tumour‐suppressive ones (Tables 2 and EV1, Fig 7). ZEB1 repression by miRs upregulated by Omomyc (miR‐200a/‐429) is accompanied by a reduction in cell proliferation and migration (Fig 7), and it is particularly interesting since ZEB1 is a key mediator of mesenchymal transdifferentiation in glioblastoma, associated with tumour invasion 57. Notably, MYC inhibition leads to repression of core transcription factors sufficient to determine GSC identity 40. These findings indicate that MYC may largely rule the cancer stem cell phenotype simply by controlling the levels of a small set of transcripts like those encoding the core transcription factors and non‐coding RNAs such as miR‐200, miR‐23a and miR‐17‐92 that maintain a neoplastic state. It is a possibility deserving further investigation.
Our data cannot be fully explained by either of the two current models depicting MYC as a universal, nonlinear amplifier or a target gene‐specific modulator 5, 55. The highly pleiotropic action and endless number of MYC‐regulated genes in different tissues, together with the finding that coding genes and non‐coding RNAs defining cancer phenotype and stem cell identity are among the most significantly affected by MYC inhibition, suggest to us a somewhat different view that may include both models. In both normal and cancerous cells, MYC might function to stabilize the nodes of the active gene expression programmes, established by master transcription factors (activators or repressors) that are different from MYC and control large sets of genes. Such programmes may be active in a variety of cell types if they control basic functions such as metabolism and protein synthesis, or may be cell type specific like those involved in stem cell reprogramming and cell identity control. The programmes that determine cell identity are controlled by chromatin structures like super‐enhancers and super‐enhancer domains that drive the expression of core TFs and their target genes 58, 59. This suggests the possibility that MYC may directly target—via protein‐ and RNA‐mediated interactions—such structures involved in maintaining the cellular status quo. MYC needs to be finely regulated to allow cell flexibility. The deregulated or overexpressed MYC present in cancer cells would tighten the nodes controlling their phenotype and make it hard to escape the tumorigenic condition. Inhibition of MYC expression or function, for example through Omomyc, may loosen such nodes and promote expression changes of master genes responsible of cancer cell behaviour. This may facilitate a switch of programme, by enhancing the response to stimuli promoting differentiation and restraining tumorigenic features such as migration and vascularization. Consistently, MYC inhibition by Omomyc enables GSCs to better differentiate in vitro, provided that an appropriate stimulus—like serum in the culture medium—is present.
Our in vivo data indicate that MYC is required for tumour formation by glioblastoma stemlike cells, but did not address whether it is also required for GBM maintenance. The in vitro data point at some effector mechanisms that may represent vulnerability points in the glioblastoma stem cell control circuit. One is MYC binding to E‐boxes, which might be targeted by sequence‐specific inhibitors, possibly reproducing much of the Omomyc action. Others include microRNAs such as miR ‐17/92, ‐200a/‐429, ‐146b and ‐23a 46, the lncRNA MIAT, ZEB1, chromatin regulators like SIN3B and the histone demethylase LSD1/RCOR2 complex 41, the phosphatase PPP2R5A, the core TFs and the machinery that sustains their expression. It remains to be determined whether—as it seems likely—the pervasive oncosuppressive effect of MYC inhibition on GSCs may be generalized to cancer stem cells from other tumours. It is improbable that the broad impact of MYC inhibition may be fully reproduced by targeting other molecules. This increases the interest of Omomyc as potential therapeutic agent. It may be interesting to assess direct MYC inhibition by Omomyc and these other opportunities in clinical cases.
Materials and Methods
Cell culture and treatments
Our GSC model was previously described 28. GSCs were grown as neurospheres in serum‐free medium, except for differentiation assays. Cell proliferation was estimated by seeding GSCs in six‐well plates (2 × 10⁴ cells/well) and counting cells daily: the cell suspension was thoroughly homogenized with a micropipette and aliquots of 10 μl were used for counting on a haemocytometer (Bright‐Line; Hausser Scientific, Horsham, PA) in combination with the trypan blue dye. Team of two individuals counted triplicate samples from three identical sample sets. For self‐renewal, GSCs were seeded in 96‐well plates at 100 cells/well. The neurosphere number was counted after 7 days and plotted against the number of cells seeded; team of two individuals counted triplicate samples from three identical sample sets. In vitro migration was assayed by Transwell‐96 system (BD Bioscience). After 24 h, migrated cells were stained with crystal violet solubilized with 10% acetic acid and 10 fields were counted per assay. For differentiation, cells were cultured and treated as described 28.
The human glioblastoma U87MG cell line was purchased from ATCC and checked for being mycoplasma‐free; cells were cultured in DMEM supplemented with 10% foetal bovine serum. Cell growth rate was determined by Promega CellTiter Aqueous assay with MTS tetrazolium 60. We performed transfections by Lipofectamine 2000 [Invitrogen], using LNA oligos (Exiqon) as recommended by the manufacturer.
Cells harbouring a doxycycline‐inducible FlagOmomyc were obtained by lentiviral infection. They were treated with 0.25 μg/ml doxycycline (Sigma) to induce Omomyc.
Viral vectors and infections
The lentiviral plasmid pSLIK‐FO was constructed by Gateway cloning (Life Technologies). A FlagOmomyc insert was amplified by PCR with primers introducing 5′KpnI and 3′XhoI restriction sites. The KpnI–XhoI fragment was purified and cloned in the entry vector pEN_TTmcs (courtesy of Debbie Burkhart) downstream of TRE‐tight promoter. The TRE‐tight promoter/FlagOmomyc construct was subcloned into pSLIK‐Hygro (Addgene #25737) co‐expressing a hygromycin resistance gene and Tet‐transactivator rtTA3. Lentiviruses were prepared by co‐transfecting HEK293T cells with pSLIK‐FlagOmomyc and packaging plasmids PLP1, PLP2 and pMD VSV‐G. Viral particles were purified by centrifugation and used for infection in the presence of 4 μg/ml polybrene. Cells were selected with 50–200 μg/ml hygromycin B (Sigma).
Tumorigenicity assays
Neurospheres were injected into mouse brain after mechanical dissociation to single cells. Two randomly selected groups of 6‐week‐old female nude mice (CD‐1® Nude Mouse; Crl:CD1‐Foxn1 nu, Charles River) were injected with 100,000 control or Omomyc neurospheres in 2 μl PBS (n = 7/group/cell line for survival, n = 3/group/cell line for histological studies). The coordinates, with respect to the bregma, were 0.7 mm post, 3 mm left lateral, 3.5 mm deep and within the nucleus caudatum. Omomyc expression was induced by administering to mice 625 mg/kg Dox‐containing food pellets. Cumulative survival curves were constructed by the Kaplan–Meier method (MedCalc 12.7).
Ethical statement for animal studies
All animal studies were performed in accordance with ARRIVE guidelines and following the three Rs rule of Replacement, Reduction and Refinement principles. Mice were monitored every day and euthanized when suffering, in accordance with the current directives of the Campus animal IFOM‐IEO house facility and the Italian Ministry of Health. Animal experiments were performed in accordance with the Italian Principle of Laboratory Animal Care (D. Lgs. 26/2014) and European Communities Council Directives (86/609/EEC and 2010/63/UE).
Immunofluorescence, histological analysis and immunohistochemistry
For immunofluorescence, cells were processed as described 21 with GFAP (04‐1031; Millipore), Nestin (ABD69; Millipore), SOX2 (MAB4343; Millipore), βIII‐tubulin (18207; Abcam) and Flag (Sigma #F1804) antibodies. Images were captured with an Axioplan microscope (Zeiss) and analysed by RSImage (Photometrics). Secondary antibodies were rabbit Alexa Fluor 555 (#A‐21428) and mouse Alexa Fluor 488 (#A‐11001; Life Technologies). For histology and immunohistochemistry of xenografts, brains were carefully removed, post‐fixed in 4% paraformaldehyde and embedded in paraffin. 4 μm‐thick sections were dissected using a microtome. The paraffin was removed using xylene, and the sections were rehydrated in graded alcohol. Antigen retrieval was carried out with preheated target retrieval solution (pH 6.0), and the primary antibodies were incubated overnight. Ki67 (1:50; BD Bioscience), DCX (1:100; Abcam), Flag (1:500, Sigma), GFAP (1:100, DAKO), βIII‐tubulin (1:100, Abcam), human nuclei (1:150, Millipore), OLIG2 (1:100, Proteintech) antibodies were used. Bright field microscopy combined with immunostaining was performed by rat‐on‐mouse HRP‐Polymer Kit (Biocare Medical). Tumour sections were stained with haematoxylin and eosin to assess tumour growth. Tumour slides were read independently by two different investigators operating blindly.
RNA isolation, qRT–PCR and miR profiling
Total RNA was isolated by TRIzol (Invitrogen). For microRNA profiling, RNA was reverse‐transcribed by using Megaplex™ RT primers, cDNA products were loaded onto TaqMan® OpenArray® MicroRNA Panels, and PCR was carried out using the manufacturer's instructions (Life Technologies). Results were analysed by RQ Manager 1.2.1 (Applied Biosystems). MiRs were subjected to qPCR by TaqMan miR probes (Life Technologies) as described 61. For single mRNA analysis, RNA was reverse‐transcribed by M‐MLV RT (Invitrogen); qPCR was performed using the SYBR Green select master mix (Life Technologies). Primers: CCND1: FW gaagatcgtcgccacctg, REV gacctcctcctcgcacttct; SOX2: FW atgggttcggtggtcaagt, REV ggaggaagaggtaaccacagg; PTEN: FW cagccgttcggaggattat, REV ttctcctcagcagccagag; NESTIN: FW gaggtggccacgtacaggacc, REV ctgaaagctgagggaagtcttgga; NOTCH1: FW gctccttccggctgatttat, REV cttaaccaggcttggcaca.
Western blots
GSC and U87 cell lysates were analysed by immunoblotting as described 21, with ZEB1 (HPA027524; Sigma), EGFR (HPA018530; Sigma), actin (A2066; Sigma), Flag (F3165; Sigma), GAPDH (MAB374; Millipore) antibodies. Membranes were incubated with Pierce ECL substrate (Thermo Scientific) and chemiluminescent images collected by a BioRad ChemiDoc.
ChIP, ChIP‐seq and RNA‐seq
Samples for ChIP and ChIP‐seq assays were prepared and analysed according to Myers Lab ChIP‐seq Protocol v041610 (http://myers.hudsonalpha.org/documents/) and MAGnify Chromatin Immunoprecipitation System protocol (Invitrogen). The following antibodies were used: Myc (sc‐764X, Santa Cruz Biotech), Max (c‐197X, Santa Cruz), RNA Pol II (sc‐899X, Santa Cruz), RNA Pol II phospho Ser5 (ab5131, Abcam), RNA Pol II phospho Ser2 (ab24758, Abcam and 3E19, Active Motif), Flag (F1804, Sigma). Oligonucleotides used to amplify chromatin region immunoprecipitated by different antibodies are described in Dataset EV5. Each single ChIP‐seq was performed at least twice independently. For RNA‐seq, 2 μg total RNA purified by PureLinkRNA Mini Kit (Life Technologies) was used. ChIP‐seq and RNA‐seq libraries were prepared by Emanuela Aleo at Istituto di Genomica Applicata (IGA; www.appliedgenomics.org/) according to Illumina TruSeq DNA and TruSeq RNA Sample Preparation Guides. Samples were sequenced through Illumina HiSeq 2000 and 2500.
Seq‐Data analysis
ChIP‐seq
50‐bp reads were mapped to hg19 human reference genome (UCSC Genome Browser) using Bowtie 62 version 0.12.7 allowing three mismatches; reads with multiple best matches were discarded. Peak calling was through MACS 63 1.4.2 with 10−4 P‐value cut‐off. The RefSeq transcript annotation of hg19 was used for computing intersections between peaks and promoters. Binding enrichment to promoters was calculated by the normalized number of ChIP‐seq reads as Reads Per Million (RPM). In case of multiple TSSs, those with the highest enrichment were chosen. Motif enrichment analysis was through Pscan‐ChIP 64.
RNA‐seq
The RAP 65 RNA‐Seq pipeline Tophat v13 (https://bioinformatics.cineca.it/rap/)—including quality controls, adaptor trimming and masking of low‐quality sequences, tophat2, bowtie and CuffLinks 2.2—was used to reconstruct the transcriptome (hg19 reference) and calculate expression values as FPKM. Differential expression was assessed by CuffDiff2, as well as by Fold‐Change thresholds, and Gene Set Enrichment Analysis (GSEA: www.broadinstitute.org/gsea/) subdividing MYC targets in groups of 500 genes.
Accession codes
ChIP‐seq and DNA‐seq records of data utilized in this study are accessible via Gene Expression Omnibus (GEO http://www.ncbi.nlm.nih.gov/geo/), at accession GSE86519.
Author contributions
SN and SAC contributed to overall design and supervision. DA, MAA and SN helped in lentivector construction. MS, MAA and DA contributed to generation of Omomyc‐expressing cell. SG, MS, BI and SB contributed to in vitro characterization. In vivo assays were performed by SP, FP, and supervised by GF. MiR experiments and data analysis were carried out by SG, EO and AM, and supervised by SAC and MGF. DNA‐seq and RNA‐seq experiments were performed by MS, FS and RAF. ChIP‐seq data analysis was carried out by FZ, MS and GP. RNA‐seq data analysis was carried out by FS, FZ, CA, SN and GP. Manuscript preparation was done by SAC and SN.
Conflict of interest
The authors declare that they have no conflict of interest.
Supporting information
Appendix
Expanded View Figures PDF
Table EV1
Dataset EV1
Dataset EV2
Dataset EV3
Dataset EV4
Dataset EV5
Review Process File
Acknowledgements
We thank Emanuela Aleo for outstanding and generous support on ChIP‐ and RNA‐seqs, Debbie Burkhart for lentiviral vectors, Monica Ballarino for advice on ChIPs, Andrea Levi for discussions, Gianfranco Ferrè, Antony Holmes, Ivano Legnini, Alessandro Fatica and the CINECA bioinformatics team for support and advice. This work was supported by Consiglio Nazionale delle Ricerche‐Ministero dell'Istruzione, Università e Ricerca Epigen project, Fondazione Umberto Veronesi and Associazione Italiana per la Ricerca sul Cancro (grant 15927).
EMBO Reports (2016) 17: 1872–1889
Contributor Information
Silvia Anna Ciafrè, Email: ciafre@uniroma2.it.
Sergio Nasi, Email: sergio.nasi@uniroma1.it.
References
- 1. Gabay M, Li Y, Felsher DW (2014) MYC activation is a hallmark of cancer initiation and maintenance. Cold Spring Harb Perspect Med 4: a014241 [DOI] [PMC free article] [PubMed] [Google Scholar]
- 2. Kim J, Woo AJ, Chu J, Snow JW, Fujiwara Y, Kim CG, Cantor AB, Orkin SH (2010) A MYC network accounts for similarities between embryonic stem and cancer cell transcription programs. Cell 143: 313–324 [DOI] [PMC free article] [PubMed] [Google Scholar]
- 3. Conacci‐Sorrell M, McFerrin L, Eisenman RN (2014) An overview of MYC and its interactome. Cold Spring Harb Perspect 4: a014357 [DOI] [PMC free article] [PubMed] [Google Scholar]
- 4. Rahl P, Young RA (2014) MYC and transcription elongation. Cold Spring Harb Perspect Med 4: a020990 [DOI] [PMC free article] [PubMed] [Google Scholar]
- 5. Wolf E, Lin CY, Eilers M, Levens D (2015) Taming of the beast: shaping MYC‐dependent amplification. Trends Cell Biol 25: 241–248 [DOI] [PMC free article] [PubMed] [Google Scholar]
- 6. O'Donnell KA, Wentzel EA, Zeller K, Dang CV, Mendell JT (2005) c‐MYC‐regulated microRNAs modulate E2F1 expression. Nature 435: 839–843 [DOI] [PubMed] [Google Scholar]
- 7. He L, Thomson JM, Hemann MT, Hernando‐Monge E, Mu D, Goodson S, Powers S, Cordon‐Cardo C, Lowe SW, Hannon GJ et al (2005) A microRNA polycistron as a potential human oncogene. Nature 435: 828–833 [DOI] [PMC free article] [PubMed] [Google Scholar]
- 8. Zhang X, Zhao X, Fiskus W, Lin J, Lwin T, Rao R, Zhang Y, Chan JC, Fu K, Marquez VE et al (2012) Coordinated silencing of MYC‐mediated miR‐29 by HDAC3 and EZH2 as a therapeutic target of histone modification in aggressive B‐Cell lymphomas. Cancer Cell 22: 506–523 [DOI] [PMC free article] [PubMed] [Google Scholar] [Retracted]
- 9. Li Y, Choi PS, Casey SC, Dill DL, Felsher DW (2014) MYC through miR‐17‐92 suppresses specific target genes to maintain survival, autonomous proliferation, and a neoplastic state. Cancer Cell 26: 262–272 [DOI] [PMC free article] [PubMed] [Google Scholar]
- 10. Nie Z, Hu G, Wei G, Cui K, Yamane A, Resch W, Wang R, Green DR, Tessarollo L, Casellas R et al (2012) c‐Myc is a universal amplifier of expressed genes in lymphocytes and embryonic stem cells. Cell 151: 68–79 [DOI] [PMC free article] [PubMed] [Google Scholar]
- 11. Lin CY, Lovén J, Rahl PB, Paranal RM, Burge CB, Bradner JE, Lee TI, Young RA (2012) Transcriptional amplification in tumor cells with elevated c‐MYC. Cell 51: 56–67 [DOI] [PMC free article] [PubMed] [Google Scholar]
- 12. Sabò A, Kress TR, Pelizzola M, de Pretis S, Gorski MM, Tesi A, Morelli MJ, Bora P, Doni M, Verrecchia A et al (2014) Selective transcriptional regulation by Myc in cellular growth control and lymphomagenesis. Nature 511: 488–492 [DOI] [PMC free article] [PubMed] [Google Scholar]
- 13. Walz S, Lorenzin F, Morton J, Wiese KE, von Eyss B, Herold S, Rycak L, Dumay‐Odelot H, Karim S, Bartkuhn M et al (2014) Activation and repression by oncogenic MYC shape tumour‐specific gene expression profiles. Nature 511: 483–487 [DOI] [PMC free article] [PubMed] [Google Scholar]
- 14. Dawson MA, Prinjha RK, Dittmann A, Giotopoulos G, Bantscheff M, Chan WI, Robson SC, Chung CW, Hopf C, Savitski MM et al (2011) Inhibition of BET recruitment to chromatin as an effective treatment for MLL‐fusion leukaemia. Nature 478: 529–533 [DOI] [PMC free article] [PubMed] [Google Scholar]
- 15. Delmore JE, Issa GC, Lemieux ME, Rahl PB, Shi J, Jacobs HM, Kastritis E, Gilpatrick T, Paranal RM, Qi J et al (2011) BET bromodomain inhibition as a therapeutic strategy to target c‐MYC. Cell 146: 904–917 [DOI] [PMC free article] [PubMed] [Google Scholar]
- 16. Zuber J, Shi J, Wang E, Rappaport AR, Herrmann H, Sison EA, Magoon D, Qi J, Blatt K, Wunderlich M et al (2011) RNAi screen identifies Brd4 as a therapeutic target in acute myeloid leukaemia. Nature 478: 524–528 [DOI] [PMC free article] [PubMed] [Google Scholar]
- 17. Soucek L, Helmer‐Citterich M, Sacco A, Jucker R, Cesareni G, Nasi S (1998) Design and properties of a MYC derivative that efficiently homodimerizes. Oncogene 17: 2463–2472 [DOI] [PubMed] [Google Scholar]
- 18. Soucek L, Jucker R, Panacchia L, Ricordy R, Tatò F, Nasi S (2002) Omomyc, a potential MYC dominant negative, enhances MYC‐induced apoptosis. Cancer Res 62: 3507–3510 [PubMed] [Google Scholar]
- 19. Soucek L, Nasi S, Evan GI (2004) Omomyc expression in skin prevents MYC‐induced papillomatosis. Cell Death Differ 11: 1038–1045 [DOI] [PubMed] [Google Scholar]
- 20. Soucek L, Whitfield J, Martins CP, Finch AJ, Murphy DJ, Sodir NM, Karnezis AN, Swigart LB, Nasi S, Evan GI (2008) Modelling MYC inhibition as a cancer therapy. Nature 455: 679–683 [DOI] [PMC free article] [PubMed] [Google Scholar]
- 21. Savino M, Annibali D, Carucci N, Favuzzi E, Cole MD, Evan GI, Soucek L, Nasi S (2011) The action mechanism of the MYC inhibitor termed Omomyc may give clues on how to target MYC for cancer therapy. PLoS One 6: e22284 [DOI] [PMC free article] [PubMed] [Google Scholar]
- 22. Sodir NM, Swigart LB, Karnezis AN, Hanahan D, Evan GI, Soucek L (2011) Endogenous MYC maintains the tumor microenvironment. Genes Dev 25: 907–916 [DOI] [PMC free article] [PubMed] [Google Scholar]
- 23. Annibali D, Whitfield JR, Favuzzi E, Jauset T, Serrano E, Cuartas I, Redondo‐Campos S, Folch G, Gonzàlez‐Juncà A, Sodir NM et al (2014) MYC inhibition is effective against glioma and reveals a role for MYC in proficient mitosis. Nat Commun 5: 4632 [DOI] [PMC free article] [PubMed] [Google Scholar]
- 24. Jansen M, Yip S, Louis DN (2010) Molecular pathology in adult gliomas: diagnostic, prognostic, and predictive markers. Lancet 9: 717–726 [DOI] [PMC free article] [PubMed] [Google Scholar]
- 25. Lee J, Kotliarova S, Kotliarov Y, Li A, Su Q, Donin NM, Pastorino S, Purow BW, Christopher N, Zhang W et al (2006) Tumor stem cells derived from glioblastomas cultured in bFGF and EGF more closely mirror the phenotype and genotype of primary tumors than do serum‐cultured cell lines. Cancer Cell 9: 391–403 [DOI] [PubMed] [Google Scholar]
- 26. Bao S, Wu Q, McLendon RE, Hao Y, Shi Q, Hjelmeland AB, Dewhirst MW, Bigner DD, Rich JN (2006) Glioma stem cells promote radioresistance by preferential activation of the DNA damage response. Nature 444: 756–760 [DOI] [PubMed] [Google Scholar]
- 27. Wang J, Wang H, Li Z, Wu Q, Lathia JD, McLendon RE, Hjelmeland AB, Rich JN (2008) c‐MYC is required for maintenance of glioma cancer stem cells. PLoS One 3: e3769 [DOI] [PMC free article] [PubMed] [Google Scholar]
- 28. De Bacco F, Casanova E, Medico E, Pellegatta S, Orzan F, Albano R, Luraghi P, Reato G, D'Ambrosio A, Porrati P et al (2012) The MET oncogene is a functional marker of a glioblastoma stem cell subtype. Cancer Res 72: 4537–4550 [DOI] [PubMed] [Google Scholar]
- 29. Gangemi RM, Griffero F, Marubbi D, Perera M, Capra MC, Malatesta P, Ravetti GL, Zona GL, Daga A, Corte G (2009) SOX2 silencing in glioblastoma tumor‐initiating cells causes stop of proliferation and loss of tumorigenicity. Stem Cells 27: 40–48 [DOI] [PubMed] [Google Scholar]
- 30. Wang J, Wang Q, Cui Y, Liu ZY, Zhao W, Wang CL, Dong Y, Hou L, Hu G, Luo C et al (2012) Knockdown of cyclin D1 inhibits proliferation, induces apoptosis, and attenuates the invasive capacity of human glioblastoma cells. J Neurooncol 106: 473–484 [DOI] [PubMed] [Google Scholar]
- 31. Piccin D, Yu F, Morshead CM (2013) Notch signaling imparts and preserves neural stem characteristics in the adult brain. Stem Cells Dev 22: 1541–1550 [DOI] [PubMed] [Google Scholar]
- 32. Matsuda Y, Ishiwata T, Yoshimura H, Hagio M, Arai T (2015) Inhibition of nestin suppresses stem cell phenotype of glioblastomas through the alteration of post‐translational modification of heat shock protein HSPA8/HSC71. Cancer Lett 357: 602–611 [DOI] [PubMed] [Google Scholar]
- 33. Zheng H, Ying H, Yan H, Kimmelman AC, Hiller DJ, Chen AJ, Perry SR, Tonon G, Chu GC, Ding Z et al (2008) p53 and Pten control neural and glioma stem/progenitor cell renewal and differentiation. Nature 455: 1129–1133 [DOI] [PMC free article] [PubMed] [Google Scholar]
- 34. Chen J, Li Y, Yu TS, McKay RM, Burns DK, Kernie SG, Parada LF (2012) A restricted cell population propagates glioblastoma growth after chemotherapy. Nature 488: 522–526 [DOI] [PMC free article] [PubMed] [Google Scholar]
- 35. Daniel P, Filiz G, Brown DV, Hollande F, Gonzales M, D'Abaco G, Papalexis N, Phillips WA, Malaterre J, Ramsay RG et al (2014) Selective CREB‐dependent cyclin expression mediated by the PI3K and MAPK pathways supports glioma cell proliferation. Oncogenesis 3: e108 [DOI] [PMC free article] [PubMed] [Google Scholar]
- 36. Bellail AC, Olson JJ, Hao C (2014) SUMO1 modification stabilizes CDK6 protein and drives the cell cycle and glioblastoma progression. Nat Commun 5: 4234 [DOI] [PMC free article] [PubMed] [Google Scholar]
- 37. Goldshmit Y, Trangle SS, Kloog Y, Pinkas‐Kramarski R (2014) Interfering with the interaction between ErbB1, nucleolin and Ras as a potential treatment for glioblastoma. Oncotarget 5: 8602–8613 [DOI] [PMC free article] [PubMed] [Google Scholar]
- 38. Aprea J, Prenninger S, Dori M, Ghosh T, Monasor LS, Wessendorf E, Zocher S, Massalini S, Alexopoulou D, Lesche M et al (2013) Transcriptome sequencing during mouse brain development identifies long non‐coding RNAs functionally involved in neurogenic commitment. EMBO J 32: 3145–3160 [DOI] [PMC free article] [PubMed] [Google Scholar]
- 39. Prabhakar S, Asuthkar S, Lee W, Chigurupati S, Zakharian E, Tsung AJ, Velpula KK (2014) Targeting DUSPs in glioblastomas ‐ wielding a double‐edged sword? Cell Biol Int 38: 145–153 [DOI] [PubMed] [Google Scholar]
- 40. Suvà ML, Rheinbay E, Gillespie SM, Patel AP, Wakimoto H, Rabkin SD, Riggi N, Chi AS, Cahill DP, Nahed BV et al (2014) Reconstructing and reprogramming the tumor‐propagating potential of glioblastoma stem‐like cells. Cell 157: 580–594 [DOI] [PMC free article] [PubMed] [Google Scholar]
- 41. Yang P, Wang Y, Che J, Li H, Kang L, Zhang Y, Chen S, Zhu B, Gao S (2011) RCOR2 is a subunit of the LSD1 complex that regulates ESC property and substitutes for SOX2 in reprogramming somatic cells to pluripotency. Stem Cells 29: 791–801 [DOI] [PubMed] [Google Scholar]
- 42. Verhaak RG, Hoadley KA, Purdom E, Wang V, Qi Y, Wilkerson MD, Miller CR, Ding L, Golub T, Mesirov JP et al (2010) Integrated genomic analysis identifies clinically relevant subtypes of glioblastoma characterized by abnormalities in PDGFRA, IDH1, EGFR, and NF1. Cancer Cell 17: 98–110 [DOI] [PMC free article] [PubMed] [Google Scholar]
- 43. Jackstadt R, Hermeking H (2015) MicroRNAs as regulators and mediators of c‐MYC function. Biochim Biophys Acta 1849: 544–553 [DOI] [PubMed] [Google Scholar]
- 44. Karsy M, Arslan E, Moy F (2013) Current Progress on Understanding MicroRNAs in Glioblastoma Multiforme. Genes Cancer 3: 3–15 [DOI] [PMC free article] [PubMed] [Google Scholar]
- 45. Psathas JN, Thomas‐Tikhonenko A (2014) MYC and the art of MicroRNA maintenance. Cold Spring Harb Perspect Med 4: a014175 [DOI] [PMC free article] [PubMed] [Google Scholar]
- 46. Gao P, Tchernyshyov I, Chang TC, Lee YS, Kita K, Ochi T, Zeller KI, De Marzo AM, Van Eyk JE, Mendell JT et al (2009) c‐MYC suppression of miR‐23a/b enhances mitochondrial glutaminase expression and glutamine metabolism. Nature 458: 62–65 [DOI] [PMC free article] [PubMed] [Google Scholar]
- 47. Lovat F, Fassan M, Gasparini P, Rizzotto L, Cascione L, Pizzi M, Vicentini C, Balatti V, Palmieri D, Costinean S et al (2015) miR‐15b/16‐2 deletion promotes B‐cell malignancies. Proc Natl Acad Sci USA 112: 11636–11641 [DOI] [PMC free article] [PubMed] [Google Scholar]
- 48. Vlachos IS, Kostoulas N, Vergoulis T, Georgakilas G, Reczko M, Maragkakis M, Paraskevopoulou MD, Prionidis K, Dalamagas T, Hatzigeorgiou AG (2012) DIANA miRPath v. 2.0: investigating the combinatorial effect of microRNAs in pathways. Nucleic Acids Res 40: W498–W504 [DOI] [PMC free article] [PubMed] [Google Scholar]
- 49. Rheinbay E, Suvà ML, Gillespie SM, Wakimoto H, Patel AP, Shahid M, Oksuz O, Rabkin SD, Martuza RL, Rivera MN et al (2013) An aberrant transcription factor network essential for Wnt signaling and stem cell maintenance in glioblastoma. Cell Rep 3: 1567–1579 [DOI] [PMC free article] [PubMed] [Google Scholar]
- 50. Gregory PA, Bert AG, Paterson EL, Barry SC, Tsykin A, Farshid G, Vadas MA, Khew‐Goodall Y, Goodall GJ (2013) The miR‐200 family and miR‐205 regulate epithelial to mesenchymal transition by targeting ZEB1 and SIP1. Nat Cell Biol 10: 593–601 [DOI] [PubMed] [Google Scholar]
- 51. Siebzehnrubl FA, Silver DJ, Tugertimur B, Deleyrolle LP, Siebzehnrubl D, Sarkisian MR, Devers KG, Yachnis AT, Kupper MD, Neal D et al (2012) The ZEB1 pathway links glioblastoma initiation, invasion and chemoresistance. EMBO Mol Med 5: 1196–1212 [DOI] [PMC free article] [PubMed] [Google Scholar]
- 52. Katakowski M, Zheng X, Jiang F, Rogers T, Szalad A, Chopp M (2010) MiR‐146b‐5p suppresses EGFR expression and reduces in vitro migration and invasion of glioma. Cancer Invest 28: 1024–1030 [DOI] [PMC free article] [PubMed] [Google Scholar]
- 53. Carroll PA, Diolaiti D, McFerrin L, Gu H, Djukovic D, Du J, Cheng PF, Anderson S, Ulrich M, Hurley JB et al (2015) Deregulated MYC requires MondoA/Mlx for metabolic reprogramming and tumorigenesis. Cancer Cell 27: 271–285 [DOI] [PMC free article] [PubMed] [Google Scholar]
- 54. Levens D (2013) Cellular MYCro economics: balancing MYC function with MYC expression. Cold Spring Harb Perspect Med 3: a022483 [DOI] [PMC free article] [PubMed] [Google Scholar]
- 55. Dang CV (2013) MYC, metabolism, cell growth, and tumorigenesis. Cold Spring Harb Perspect Med 3: a014217 [DOI] [PMC free article] [PubMed] [Google Scholar]
- 56. Mongiardi MP, Savino M, Bartoli L, Beji S, Nanni S, Scagnoli F, Falchetti ML, Favia A, Farsetti A, Levi A et al (2015) Myc and Omomyc functionally associate with the Protein Arginine Methyltransferase 5 (PRMT5) in glioblastoma cells. Sci Rep 5: 15494 [DOI] [PMC free article] [PubMed] [Google Scholar]
- 57. Joseph JV, Conroy S, Tomar T, Eggens‐Meijer E, Bhat K, Copray S, Walenkamp AM, Boddeke E, Balasubramanyian V, Wagemakers M et al (2014) TGF‐β is an inducer of ZEB1‐dependent mesenchymal transdifferentiation in glioblastoma that is associated with tumor invasion. Cell Death Dis 5: e1443 [DOI] [PMC free article] [PubMed] [Google Scholar]
- 58. Hnisz D, Schuijers J, Lin CY, Weintraub AS, Abraham BJ, Lee TI, Bradner JE, Young RA (2015) Convergence of developmental and oncogenic signaling pathways at transcriptional super‐enhancers. Mol Cell 58: 362–370 [DOI] [PMC free article] [PubMed] [Google Scholar]
- 59. Dowen JM, Fan ZP, Hnisz D, Ren G, Abraham BJ, Zhang LN, Weintraub AS, Schuijers J, Lee TI, Zhao K et al (2014) Control of cell identity genes occurs in insulated neighbourhoods in mammalian chromosomes. Cell 159: 74–87 [DOI] [PMC free article] [PubMed] [Google Scholar]
- 60. Galardi S, Mercatelli N, Giorda E, Massalini S, Frajese GV, Ciafrè SA, Farace MG (2007) miR‐221 and miR‐222 expression affects the proliferation potential of human prostate carcinoma cell lines by targeting p27Kip1. J Biol Chem 282: 23716–23724 [DOI] [PubMed] [Google Scholar]
- 61. Orecchini E, Doria M, Michienzi A, Giuliani E, Vassena L, Ciafrè SA, Farace MG, Galardi S (2014) The HIV‐1 Tat protein modulates CD4 expression in human T cells through the induction of miR‐222. RNA Biol 11: 334–338 [DOI] [PMC free article] [PubMed] [Google Scholar]
- 62. Langmead B, Trapnell C, Pop M, Salzberg SL (2009) Ultrafast and memory‐efficient alignment of short DNA sequences to the human genome. Genome Biol 10: R25 [DOI] [PMC free article] [PubMed] [Google Scholar]
- 63. Zhang Y, Liu T, Meyer CA, Eeckhoute J, Johnson DS, Bernstein BE, Nusbaum C, Myers RM, Brown M, Li W et al (2008) Model‐based analysis of ChIP‐Seq (MACS). Genome Biol 9: R137 [DOI] [PMC free article] [PubMed] [Google Scholar]
- 64. Zambelli F, Pesole G, Pavesi G (2013) PscanChIP: finding over‐represented transcription factor‐binding site motifs and their correlations in sequences from ChIP‐Seq experiments. Nucleic Acids Res 41: W535–W543 [DOI] [PMC free article] [PubMed] [Google Scholar]
- 65. D'Antonio M, D'Onorio De Meo P, Pallocca M, Picardi E, D'Erchia AM, Calogero RA, Castrignanò T, Pesole G (2015) RAP: RNA‐Seq Analysis Pipeline, a new cloud‐based NGS web application. BMC Genom 16: S3 [DOI] [PMC free article] [PubMed] [Google Scholar]
- 66. Zeller KI, Jegga AG, Aronow BJ, O'Donnell KA, Dang CV (2003) An integrated database of genes responsive to the Myc oncogenic transcription factor: identification of direct genomic targets. Genome Biol 4: R69 [DOI] [PMC free article] [PubMed] [Google Scholar]
- 67. Ben‐Porath I, Thomson MW, Carey VJ, Ge R, Bell GW, Regev A, Weinberg RA (2008) An embryonic stem cell‐like gene expression signature in poorly differentiated aggressive human tumors. Nat Genet 40: 499–507 [DOI] [PMC free article] [PubMed] [Google Scholar]
- 68. Schlosser I, Hölzel M, Hoffmann R, Burtscher H, Kohlhuber F, Schuhmacher M, Chapman R, Weidle UH, Eick D (2005) Dissection of transcriptional programmes in response to serum and c‐Myc in a human B‐cell line. Oncogene 24: 520–524 [DOI] [PubMed] [Google Scholar]
- 69. Schuhmacher M, Kohlhuber F, Hölzel M, Kaiser C, Burtscher H, Jarsch M, Bornkamm GW, Laux G, Polack A, Weidle UH et al (2001) The transcriptional program of a human B cell line in response to Myc. Nucleic Acids Res 29: 397–406 [DOI] [PMC free article] [PubMed] [Google Scholar]
- 70. Cowling VH, Cole MD (2008) An N‐Myc truncation analogous to c‐Myc‐S induces cell proliferation independently of transactivation but dependent on Myc homology box II. Oncogene 27: 1327–1332 [DOI] [PubMed] [Google Scholar]
Associated Data
This section collects any data citations, data availability statements, or supplementary materials included in this article.
Supplementary Materials
Appendix
Expanded View Figures PDF
Table EV1
Dataset EV1
Dataset EV2
Dataset EV3
Dataset EV4
Dataset EV5
Review Process File