

ABSTRACT
Tumors are infiltrated by cells of the immune system that interact through complex regulatory networks. Although tumor-specific CD8+ T cells can be found in peripheral blood and tumor samples from cancer patients, their function is inhibited by immunosuppressive cells such as regulatory T cells, tumor-associated macrophages, and myeloid-derived suppressor cells (MDSC). Recent clinical successes have demonstrated that alleviating immunosuppression and T cell exhaustion translates into long-term clinical benefits. Although tremendous progress has been achieved, tools that afford unbiased approaches and screenings to uncover new potential inhibitors or gene targets are lacking. In this study, we describe a system based on immortalized progenitors that allows straightforward investigation of myeloid cells. We show that bone marrow progenitors immortalized through the transduction of NUP98-HOXB4 transgene can be differentiated into CD11b+Gr-1+ MDSC that express Arginase-1 and PD-L1, produce reactive oxygen and nitrogen species, and suppress T cell function in vitro. To uncover chemical probes that interfere with MDSC biology, we performed a chemical phenotypic screening and identified 3-deazaneplanocin A as a novel modulator of MDSC functions. We characterized and compared the effect of 3-deazaneplanocin-A and all-trans retinoic acid, a well-known modulator of MDSC activity, on the expression of effector molecules and immunosuppressive functions of MDSC. Altogether, this proof-of-principle opens new possibilities for the identification of drugs targeting myeloid cells with immunosuppressive activities.
KEYWORDS: 3-Deazaneplanocin A, immunosuppression, MDSC, retinoic acid
Abbreviations
- DZNep
3-Deazaneplanocin A
- MDSC
myeloid-derived suppressor cells
- RA
retinoic acid
- ROS
reactive oxygen species
- RNS
reactive nitrogen species
Introduction
Solid tumors are infiltrated by CD8+ T cells that are specific for mutated or overexpressed (germline) self-antigens presented by cancer cells.1-3 Tumor-specific T cells can be engaged for therapeutic purposes through autologous transfer,4,5 engineering,6-8 vaccination,9,10 or administration of antibodies directed against negative immune check point molecules such as cytotoxic T-lymphocyte-associated protein-4 (CTLA-4),11 programmed cell death protein-1 (PD-1)12 or programmed death-ligand 1 (PD-L1).13 Accumulating data suggest that a critical determinant of therapeutic success is to overcome tumor-dependent immunosuppression.14-17 Tumor-infiltrating T cells not only encounter a hostile microenvironment characterized by low oxygen and glucose conditions18,19 but also active suppression by cells like regulatory T cells, tumor-associated macrophages or myeloid-derived suppressor cells (MDSC).20,21
MDSC are a heterogeneous population of immature myeloid cells inhibiting antitumor reactivity of T and NK cells.14,22 MDSC are absent under physiological conditions but are increased in tumor lesions and lymphoid organs of tumor-bearing mice or cancer patients.23 Interestingly, increase in MDSC frequencies correlates with the disease stage.1,23,24 In mice, MDSC can be phenotypically identified by CD11b and Gr-1 expression, and subdivided in polymorphonuclear (PMN) and monocytic cells that are Ly6G+Ly6Clow and Ly6G−Ly6Chigh, respectively.25 Functionally, MDSC are characterized by increased arginase activity, PD-L1 expression, NADPH-oxidase and inducible nitric oxide synthase activity (iNOS/Nos2) along with an increased production of reactive oxygen/nitrogen species (ROS/RNS),25-27 all of which have been shown to contribute to their ability to suppress T cells.20 The development of functional MDSC has been shown to require the activity of several transcription factors, including C/EBPβ,27,28 signal transducer, and activator of transcription (STAT)20,29-32 as well as hypoxia-inducible factor 1-α (HIF1-α).20,33 Importantly, numerous studies in mice have shown that the depletion of MDSC or interference with their immunosuppressive activity improves antitumor response and delays tumor growth.20,21,34-36 Nevertheless, although several compounds have been shown to decrease MDSC frequencies in the peripheral blood and to restore T cell functions measured ex vivo,37,38 only marginal clinical benefit if any has been observed.
The discovery of drugs or target genes to alleviate immunosuppression will benefit from the use of unbiased approaches such as chemical or genetic screenings. Although mouse and human myeloid cell lines can be cultured and manipulated readily, they lack differentiation potential and only poorly reproduce the function of primary cells. MDSC and related suppressive cells can be differentiated from bone marrow precursor in vitro using GM-CSF and IL-627 or isolated from cancer patients or tumor-bearing mice.32 However, only limited number of these cells can be isolated ex vivo; they are highly heterogeneous and cannot be easily manipulated genetically or kept in culture. Interestingly, several studies have reported that immortalized hematopoietic progenitors could be cultivated in vitro, while retaining differentiation potential both in vitro and in vivo.39,40 The use of immortalized progenitors should facilitate the investigation of myeloid cell development through chemical or genetic screenings.
In this study, we show that hematopoietic progenitors immortalized using a NUP98/HOXB4 transgene (referred to as “NUP” cells hereafter)39 can be differentiated into immunosuppressive MDSC and compare their phenotype and function to MDSC differentiated from freshly isolated bone marrow.27 Through a phenotypic screening, we identified 3-deazaneplanocin A (DZNep) as a novel inhibitor of MDSC development and function. We characterized and compared the effect of DZNep as well as all-trans retinoic acid (RA)38,41 on MDSC development and function. We demonstrate that both compounds interfere differently with the expression of key transcription factors and effector molecules, thereby, inhibiting MDSC functions in a qualitatively different manner.
Results
NUP98/HOXB4 transduced murine progenitor cells can be differentiated into fully functional MDSC
It was previously shown that hematopoietic progenitors transduced with NUP98/HOXB4 fusion product could be kept in culture while retaining in vitro and in vivo differentiation potential.39 To investigate whether NUP cells could be differentiated into MDSC, we monitored cells differentiation in the presence of GM-CSF and IL-6 compared with bone marrow cells.27 We analyzed expression of markers for MDSC (CD11b, Gr-1, Ly6C, and Ly6G)25 as well as for dendritic cells (DCs) (MHCII and CD11c) (Fig. 1A). At day 0, only a minority of NUP cells expressed MDSC markers in contrast to bone marrow cells, which already contained a significant proportion of CD11b+Gr-1+ granulocytic cells. After 4 d, a similar proportion of differentiating NUP and bone marrow cells expressed CD11b and Gr-1, although fewer NUP cells expressed Ly6G compared with bone marrow cells (10.6% vs. 23.2%) (Fig. 1A, middle panels). After 7 d of differentiation, the percentage of CD11b+Gr-1+ cells decreased, whereas the proportion of mature DCs increased (Fig. 1A, lower panels). A hallmark of MDSC differentiation is the upregulation of IL-4Rα, STAT signaling as well as the downregulation of IRF8.25,32 STAT signaling occurred in both NUP and bone marrow cells as shown by STAT3 and STAT5 phosphorylation (Fig. 1B). Similarly, we observed an increase in IL-4Rα expression (Fig. 1C) as well as a downregulation of IRF8 compared with DCs (Fig. 1D). Furthermore, upon differentiation, NUP and bone marrow cells produced increasing amount of ROS and RNS (Fig. 1E) and upregulated arginase activity (Fig. 1F). Differentiated NUP and bone marrow cells expressed MDSC-associated molecules S100A8/S100A9 and secreted VEGF (Fig. 1G and H) albeit in different amount or kinetic. Neither IL-10 nor TGFβ could be detected in the supernatant of differentiated NUP or bone marrow cells (data not shown). To investigate whether MDSC differentiated from NUP cells were able to suppress T cell proliferation and cytokine production, we stimulated CD8+ T cells in the presence or absence of undifferentiated NUP cells or cells differentiated for 4 d with GM-CSF/IL-6 at different cell to cell ratios and analyzed T cell proliferation as well as IFNγ and TNFα production (Fig. 2). Stimulated T cells did proliferate extensively and secreted IFNγ and TNFα, whereas unstimulated T cells did not. NUP cells did not impair T cell proliferation or cytokine production, whereas addition of NUP-derived MDSC at a 1:1 ratio led to a strong suppression of T cell proliferation (Fig. 2A) and a significant reduction in IFNγ and TNFα secretion (Fig. 2B) despite a clear increase in cell size suggesting stimulation-induced blasting (Fig. 2A). Increasing T cell to MDSC ratios led to a progressive loss of T cell suppression.
Figure 1.
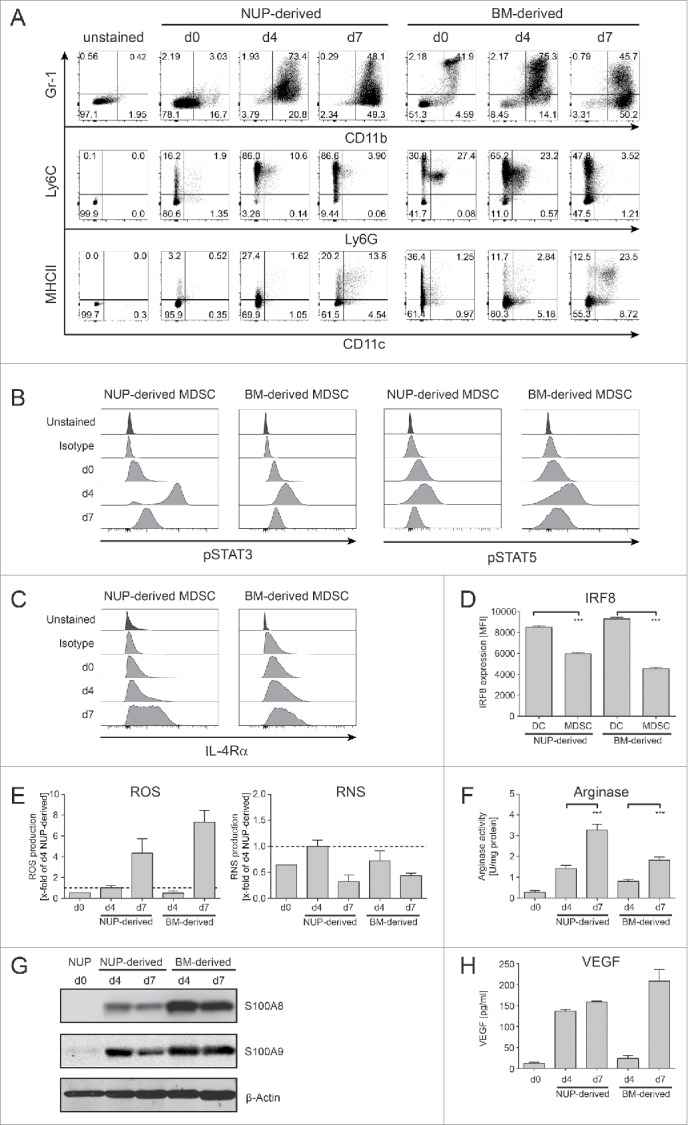
NUP cells can be differentiated into MDSC. NUP cells or freshly isolated BM cells were incubated for 0, 4, or 7 d with 20 ng/mL GM-CSF and 20 ng/mL IL-6. (A) Phenotypic characterization of the NUP- and BM-cell differentiation process for Gr-1 vs. CD11b, MHCII vs. CD11c and Ly6C vs. Ly6G. FACS dot plots are shown for NUP cells or freshly isolated BM cells (day 0) and cells differentiated for 4 or 7 d, respectively. Day 4 NUP-derived cells were used for the unstained control dot plot. One representative experiment out of four independent experiments is presented. (B) Histograms are showing the amount of phosphorylated STAT3 or STAT5 for NUP- or BM-derived MDSCs on days 0, 4, and 7. One representative experiment out of four independent experiments is presented. (C) Histograms are showing the expression of IL-4Rα for NUP- or BM-derived MDSCs on days 0, 4, and 7. One representative experiment out of four independent experiments is presented. (D) IRF8 expression of NUP- or BM-derived DC (CD11c+MHCII+) and MDSC (Gr-1+CD11b+) was detected by FACS staining. The bar diagram represents the mean of mean fluorescent intensity ± SD of four independent experiments. (E) ROS/RNS production by NUP- or BM-derived cells differentiated for 0, 4, and 7 d. The bars are expressed as x-fold of day 4 NUP-derived MDSC and represent mean of mean fluorescent intensity ± SD of four independent replicates. (F) Arginase activity was measured in protein lysates of NUP- or BM-derived cells differentiated for 0, 4, and 7 d. The enzymatic activity was normalized to protein content (U/mg protein). (G) S100A8 and S100A9 protein levels were analyzed in protein lysates of NUP- or BM-derived cells differentiated for 0, 4, and 7 d by Western blot analysis. A representative experiment out of 4 independent experiments is presented. (H) VEGF protein levels were analyzed in supernatant of NUP- or BM-derived cells differentiated for 4 d with ELISA. The bar diagram represents the mean ± SD of four independent experiments in pg/mL. Asterisks represent statistical significance (two-tailed t-test with Welch's correction) with ns: not significant, *p < 0.05; **p < 0.01; ***p < 0.001.
Figure 2.
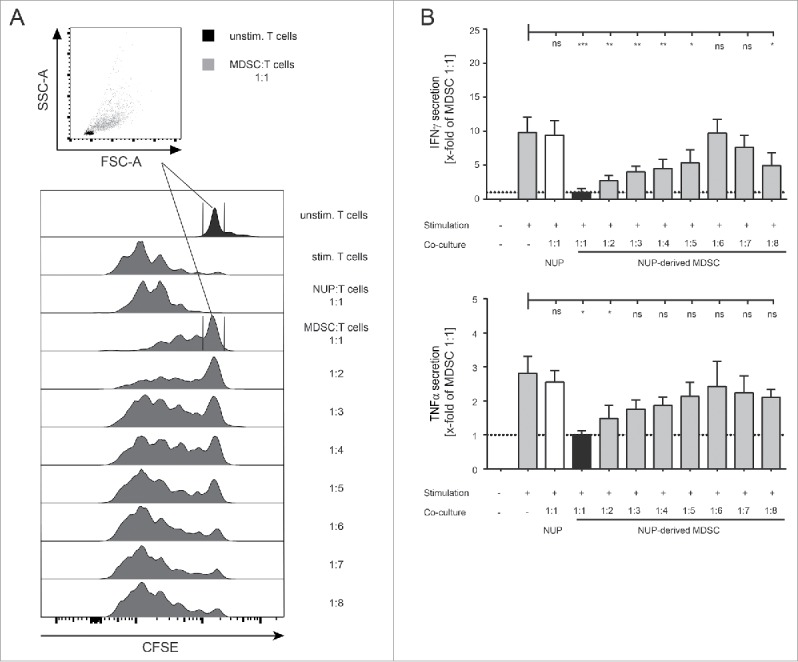
NUP-MDSCs suppress T cell proliferation and cytokine production. (A) CFSE-histograms are shown for unstimulated and stimulated CD8+ T cells that were incubated for 3 d with or without NUP cells or MDSC at indicated ratios. Dot plots show FSC-A vs. SSC-A gated on CD8+ T cells that did not proliferate based on CFSE staining (unstimulated T cells: black, T cells co-cultured with MDSC at a 1:1 ratio: gray). The histograms are representative of four independent experiments. (B) IFNγ and TNFα concentrations in the supernatant of unstimulated and stimulated CD8+ T cells, incubated with or without NUP cells or NUP-MDSC for 3 d, were analyzed by ELISA. Results were normalized to 1:1 (T:MDSC) ratio as indicated by the black bar and the dotted line. Asterisks represent statistical significance (two-tailed t-test with Welch's correction) with ns: not significant, *p < 0.05; **p < 0.01; ***p < 0.001.
Altogether, the differentiation of NUP cells with GM-CSF and IL-6 for 4 d led to differentiation of Gr-1+CD11b+ MDSC-like cells (referred to as “NUP-MDSC” hereafter), which phenotype and function very closely resemble MDSC differentiated from bone marrow cells (“BM-MDSC” hereafter).27
A phenotypic chemical screening identifies epigenetic compounds that interfere with MDSC development
Several compounds have been shown to interfere with MDSC development or suppressive function including RA,38,41 25-hydroxyvitamin D3,42 tyrosine-kinase inhibitor sunitinib37 or phosphodiesterase-5 inhibitors.43,44 A vast majority of these compounds have been identified through hypothesis-driven approaches; nevertheless, the use of scalable unbiased strategies would accelerate the identification of potential drugs that modulate MDSC function. We explored the possibility of using the differentiation of NUP cells into MDSC as a phenotypic screening platform for the identification of potential drugs that modulate MDSC function. To investigate whether functional changes correlate with phenotypic ones, we characterized NUP-MDSC phenotype upon differentiation in the presence of RA that is known to interfere with MDSC development.38,41 Since treatment with RA led to clear alterations of the expression of Gr-1 (Fig. 3A), we hypothesized that new inhibitors of MDSC biology could be identified based on their ability to alter MDSC phenotype. Therefore, we studied the differentiation of NUP cells into MDSC in the presence of DMSO, RA or 95 compounds that target epigenetic regulators (Table S1), postulating that interfering with epigenetic changes might lead to more drastic alterations during cell differentiation. A majority of these compounds target class I and II histone deacetylases (HDAC) or enzymes mediating other DNA-modifications (methylation and acetylation) (Fig. 3B). At 1 μM, 14 compounds showed high, 2 medium, and 6 low toxicity, whereas the other 73 were not toxic (Fig. 3C). To investigate if the phenotype of NUP-MDSC was altered by the treatment with the compounds, we monitored the expression of Gr-1, CD11b, F4/80, and MHCII as well as forward scatter (FSC) and side scatter (SSC) parameters (Fig. 3D). Based on changes in the expression of Gr-1, CD11b, F4/80 and MHCII, we selected 15 compounds (Fig. 3E) for additional analysis. Some compounds altered NUP-MDSC phenotype only moderately, whereas others (Neplanocin A, DZNep, SAHA, and Sod.-4-P.) significantly changed Gr-1 expression (Figs. 3E and S1). We next analyzed the effect of these selected compounds on arginase activity (Fig. 4A). As compared with DMSO, RA treatment induced a strong increase (3.2-fold) in its activity, whereas six compounds (2-PCPA, DZNep, M344, SAHA, Scriptaid, and Sod.-4-P.) showed a significant reduction by 40–80%. To investigate if the selected compounds interfered with the inhibition of T cell stimulation, we compared suppressive activity of NUP-MDSC differentiated in the presence of DMSO, RA or indicated compounds. As shown in Fig. 3B, differentiation of NUP-MDSC in the presence of RA or DZNep interfered with the ability of cells to suppress IFNγ secretion by stimulated T cells, whereas other compounds had moderate (Neplanocin A and Sod.-4-P.) or no effect (Fig. 4B). However, none of the tested compounds altered MDSC-mediated suppression of TNFα secretion by T cells (Fig. 4C). Finally, RA-treated NUP-MDSC did not inhibit T cell proliferation, whereas DZNep-treated NUP-MDSC only partially suppressed T cell proliferation (Fig. 4D). To exclude that this newly identified compound inhibits the differentiation of NUP-MDSC only, we investigated the effect of DZNep on BM-MDSC differentiation. Our results demonstrate that DZNep affected BM-MDSC differentiation, as shown by changes in Gr-1 expression and an increase in the percentage of CD11b−Gr-1−cell (Fig. 5A). Importantly, DZNep reduced the ability of BM-MDSC to suppress T cell proliferation (Fig. 5B) and IFNγ secretion (Fig. 5C). Moreover, DZNep decreased the proliferation of NUP- and BM-cells during the differentiation in a similar fashion (Fig. 5D).
Figure 3.
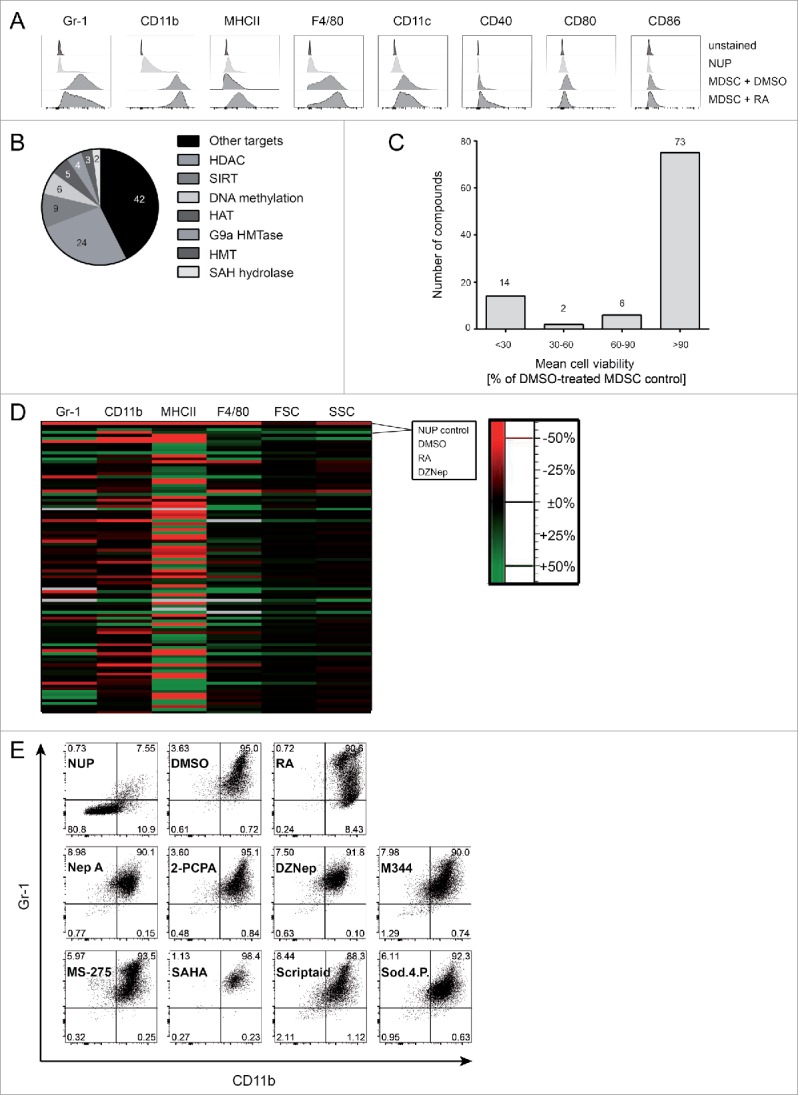
A NUP cell-based phenotypical screening identifies several epigenetic compounds that interfere with MDSC development. (A) NUP cells and NUP-MDSC incubated with DMSO or retinoic acid (RA) for 4 d were characterized by FACS for surface expression of Gr-1, CD11b, MHCII, F4/80, CD11c, CD40, CD80, and CD86. Day 4 cells were used for the unstained control. The histograms are representative of six independent experiments. (B) Pie chart of the main target classes of the used compounds. (C, D) NUP cells were incubated for 4 d with 20 ng/mL GM-CSF and 20 ng/mL IL-6 in the presence of 0.1% DMSO or compounds at 1 μM. (C) Living cells counts were measured upon control (DMSO) or compound treatment after 4 d. Data are normalized to DMSO control (n = 6). Histogram shows number of compounds (indicated above) showing high (< 30%), medium (30–60%), low (60–90%), or no toxicity (> 90%). (D) The mean fluorescence intensity values for Gr-1, CD11b, MHCII, F4/80, and FSC/SSC were analyzed for NUP cells and day 4 NUP-MDSC, incubated with DMSO, RA, or tested compounds (Table S1), and normalized to DMSO-treated NUP-MDSC. The heatmap shows the impact of compound on indicated readout (% to control, decreased: red, increased: green). Mean of six values from two independent experiments. (E) NUP cells without treatment (NUP) or NUP cells, incubated with 20 ng/mL GM-CSF, 20 ng/mL IL-6 and 0.1% DMSO, 1 μM RA or indicated compounds (2-PCPA, M344, SAHA, Scriptaid, Sodium-4-Phenylbutyrate: 1 μM, Neplanocin-A, DZNep, MS-275: 0.1 μM) for 4 d were characterized by FACS for surface expression of Gr-1 and CD11b. The dot plots are representative of six independent experiments.
Figure 4.
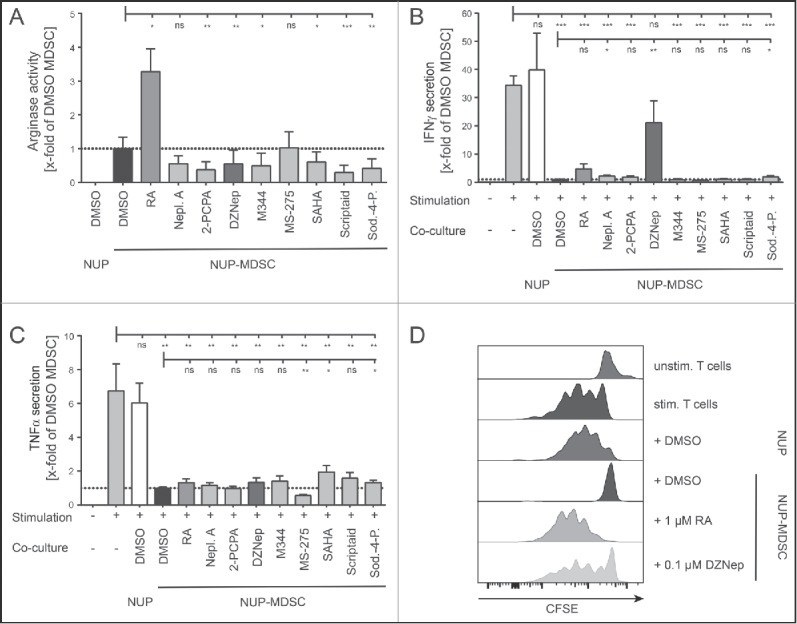
3-Deazaneplanocin A and RA interfere with MDSC suppressive activity. (A) Arginase activity measured in lysate of NUP cells or NUP-MDSC differentiated in the presence of DMSO, 1 μM RA, or indicated compounds (2-PCPA, M344, SAHA, Scriptaid, Sodium-4-Phenylbutyrate: 1 μM, Neplanocin-A, DZNep, MS-275: 0.1 μM) for 4 d. Arginase activity was normalized to DMSO-treated NUP-MDSC (dotted line). (B) IFNγ and (C) TNFα concentrations in the supernatant of unstimulated and stimulated CD8+ T cells, incubated with or without NUP cells or NUP-MDSC for 3 d, were analyzed by ELISA. NUP-MDSC were differentiated by adding 20 ng/mL GM-CSF, 20 ng/mL IL-6 and DMSO or the indicated compounds to NUP cells for 4 d. Results were normalized to DMSO-treated NUP-MDSC (dotted line). (D) CFSE-histograms are shown for unstimulated and stimulated CD8+ T cells that were incubated for 3 d with or without NUP cells or NUP-MDSC as indicated. NUP-MDSC were treated with DMSO, 1 μM RA, or 0.1 μM DZNep for 4 d prior to T cell co-culture. Histograms are representative of six independent experiments. Asterisks represent statistical significance (two-tailed t-test with Welch's correction) with ns: not significant, *p < 0.05; **p < 0.01; ***p < 0.001.
Figure 5.
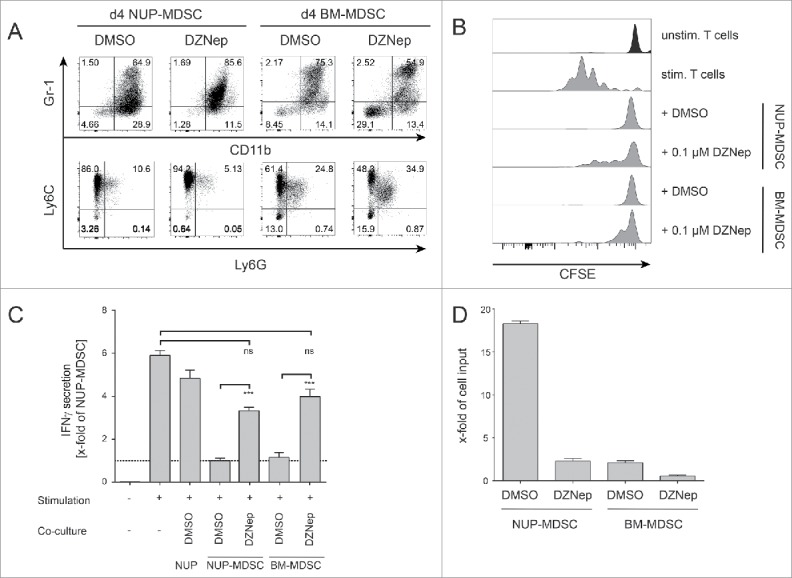
DZNep interferes with BM-MDSC suppressive functions. (A) Phenotypic characterization of NUP- and BM-cells incubated for 4 d with 0.1% DMSO or 0.1 μM DZNep. FACS dot plots are shown for Gr-1 vs. CD11b and Ly6C vs. Ly6G. One representative experiment out of four independent experiments is shown. (B) CFSE-histograms are shown for unstimulated and stimulated CD8+ T cells that were incubated for 3 d with or without NUP cells, NUP-MDSC or BM-MDSC as indicated. Histograms are representative of four independent experiments. (C) IFNγ concentrations in the supernatant of unstimulated and stimulated CD8+ T cells, incubated with or without NUP cells, NUP-MDSC or BM-MDSC for 3 d, were analyzed by ELISA. Results were normalized to DMSO-treated NUP-MDSC (dotted line). (D) The impact of DZNep on the proliferation of NUP-MDSC and BM-MDSC was analyzed by counting the number of cells after the 4-d differentiation process normalized to the input. The bar diagram shows the mean ± SD of four independent experiments. Asterisks represent statistical significance (two-tailed t-test with Welch's correction) with ns: not significant, *p < 0.05; **p < 0.01; ***p < 0.001.
Overall, the phenotypic screening presented here uncovered newly identified compounds that alter MDSC phenotype as well as arginase function. Importantly, DZNep inhibited the ability of MDSC to suppress IFNγ production by activated T cells.
DZNep and RA interfere with the expression of suppressive molecules in MDSC in a different manner
RA is a metabolite of vitamin A that plays an important role in development and cell differentiation. DZNep inhibits S-adenosyl-L-homocysteine hydrolase.45 It induces accumulation of S-adenosyl-L-homocysteine, a by-product of S-adenosyl methionine (SAM)-dependent methylation, thereby, inhibiting methyltransferases.45,46 It has also been shown to deplete EZH2 levels, thereby, inhibiting trimethylation of lysine 27 on histone H3 by blocking the polycomb-repressive-complex 2 in primary AML cells in a dose-dependent manner (0.2–1 μM).47,48 Although both RA and DZNep inhibit MDSC suppressive functions, they did so in a qualitative and quantitative different manner (Fig. 4B and D). It has been proposed that RA inhibits suppressive activity of myeloid cells by inducing their maturation into cells that sustain T cell activation such as DCs.38,41 To test this hypothesis, we compared the suppressive activity of NUP-MDSC differentiated in the presence of DMSO or RA for 4 or 7 d. The incubation of NUP cells with GM-CSF and IL-6 in the presence of RA did not induce the differentiation of a higher proportion of mature CD11c+MHCII+ DCs compared with DMSO (Fig. 6A). Although cells treated for 4 d with RA partially lost suppressive activity, control cells differentiated for 7 d, which contained mature DCs, suppressed T cell proliferation (Fig. 6B). These results suggest that RA does not alter suppressive functions by inducing the maturation of immature myeloid cells into DCs. In order to investigate how RA and DZNep interfered with MDSC properties, we monitored the expression of inhibitory effector molecules as well as ROS and RNS. The differentiation of NUP cells into MDSC led to progressive upregulation of Cd274 (PD-L1) at RNA and protein levels (Fig. 6C). Although PD-L1 expression was unaffected by RA or DZNep treatment during the first 4 d of differentiation (Fig. 6C), RA- and DZNep-treated NUP-MDSC expressed 2- to 5-fold less PD-L1 on their surface at day 7. Analysis of Cd274 mRNA expression by real-time (RT)-PCR (Fig. 6C) supported this finding. RNS and ROS production of DMSO-treated NUP-MDSC increased over time (Fig. 6D and E) but the differentiation of NUP cells into MDSC in the presence of RA and DZNep led to a decrease in RNS and ROS production. To investigate how RA and DZNep affected the intracellular ROS concentration, we analyzed the expression of proteins of the NADPH-oxidase complex involved in ROS production49 and enzymes regulating the ROS clearance. Neither P47phox nor Gp91phox or Sod expression was altered by RA or DZNep (data not shown), but the transcripts for thioredoxin (Txn) and thioredoxin-interacting-protein (Txnip) were significantly increased and decreased respectively in DZNep-treated cells (Fig. 6F), indicating an increased ROS-clearance. As the RNS-levels were reduced in RA- and DZNep-treated NUP-MDSC we also investigated the production of NO, which in MDSC, is mainly produced by iNOS (Nos2). Nos2 was strongly induced during NUP-MDSC development when incubated with DMSO (100-fold), whereas RA-treated NUP-MDSC already showed reduced onset of mRNA expression (48-fold) (Fig. 6F). DZNep treatment completely blocked Nos2 mRNA upregulation, supporting the observed reduced RNS production in DZNep-treated NUP-MDSC. MDSC have been shown to inhibit T cell proliferation by depleting nutrients from the extracellular environment including amino acids, a process that requires import of amino acids and their sequestration and/or enzymatic degradation.50-52 In fact, the ability of MDSC to deplete arginine and suppress T cells has been shown to be critically dependent on the expression of the cationic amino acid transporter CAT2 (Slc7a2).53 Likewise, MDSC have been shown to deplete cysteine by importing cystine through system Xc− transporter,54,55 composed of 4F2hc and xCT (Slc7a11).56 The expression of both Slc7a2 and Slc7a11 increased upon NUP-MDSC differentiation (Fig. 7A and B). RA treatment did not affect Slc7a2 expression (Fig. 7A) but induced a strong decrease in Slc7a11 expression (Fig. 7B). In contrast, differentiation of NUP-MDSC together with DZNep had a moderate impact on Slc7a2 expression (Fig. 7A) and no effect on Slc7a11 expression (Fig. 7B). To investigate whether arginine and/or cysteine/cystine depletion by NUP-MDSC inhibited T cell activation, we incubated CD8+ T cells together with NUP-MDSC and medium supplemented with extra arginine or cysteine. Only the addition of cysteine rescued T cell proliferation (Fig. 7C) while supplementation with neither of the amino acids rescued IFNγ secretion (Fig. 7 D). In summary, RA and DZNep affect the expression of NUP-MDSC effector molecules in a different manner, including transporter and enzymes involved in amino acid metabolism, and therefore impact NUP-MDSC suppressive activity in a contrasting fashion.
Figure 6.
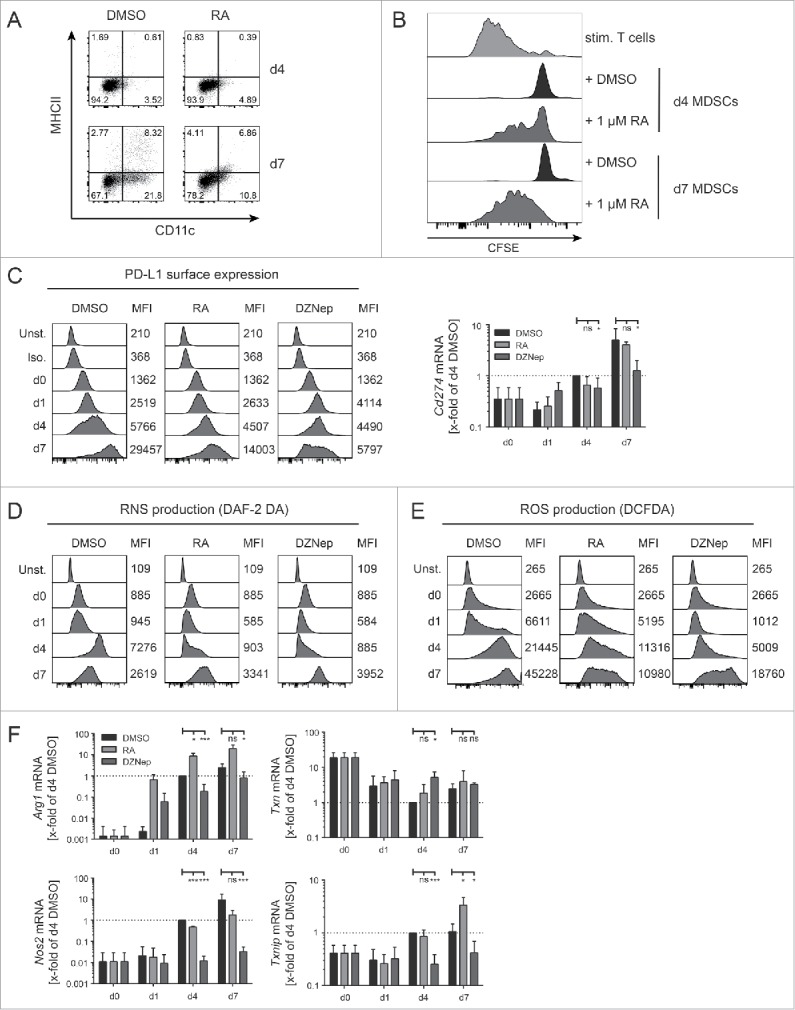
Effect of 3-Deazaneplanocin A and RA on PD-L1 expression, ROS/RNS production, and amino acid metabolism and transport. (A) NUP cells, incubated with 20 ng/mL GM-CSF, 20 ng/mL IL-6 and 0.1% DMSO or 1 μM RA for 4 or 7 d were characterized by FACS for surface expression of MHCII and CD11c. Dot plots are representative of three independent experiments. (B) The CFSE-histograms represent T cell proliferation of stimulated CD8+ T cells that were incubated for 3 d with or without NUP-MDSC as indicated. NUP-MDSC were treated during differentiation with 0.1% DMSO or 1 μM RA during the 4 or 7 d prior to - cell co-culture. Histograms are representative of three independent experiments. (C-F) NUP cells were incubated for 0, 1, 4 or 7 d with 20 ng/mL GM-CSF, 20 ng/mL IL-6 and DMSO, 1 μM RA or 0.1 μM DZNep. (C) PD-L1 expression upon differentiation and treatment. Numbers indicate the mean fluorescence intensity (MFI) of the adjacent histogram. Histograms are representative of 3–4 independent experiments. Corresponding Cd274 mRNA expression was measured by RT-PCR and normalized to 18s rRNA transcript level and expression level in day 4 DMSO-treated NUP-MDSC. (D) RNS and (E) ROS production upon differentiation and treatment. Numbers indicate the mean fluorescence intensity (MFI) of the adjacent histogram. The histograms are representative of 3–4 independent experiments. (F) Expression of Arg1, Txn, Nos2, and Txnip measured by RT-PCR and normalized to 18s rRNA transcript level and expression level in day 4 DMSO-treated NUP-MDSC. Values are expressed as x-fold of day 4 DMSO and represent mean ± SD of 3–4 independent replicates. Asterisks represent statistical significance (two-tailed t-test with Welch's correction) with ns: not significant, *p < 0.05; **p < 0.01; ***p < 0.001.
Figure 7.

RA and DZNep alter the expression of solute carrier that transport cystine and arginine. Expression of Slc7a2 (A) or Slc7a11 (B) was measured by RT-PCR in NUP cells incubated for 0, 1, 4, or 7 d with 20 ng/mL GM-CSF, 20 ng/mL IL-6 and DMSO, 1 μM RA or 0.1 μM DZNep. Results were normalized to 18s rRNA transcript level and expression level in day 4 DMSO-treated NUP-MDSC. Values are expressed as x-fold of day 4 DMSO and represent mean ± SD of 3–4 independent replicates. (C) Proliferation and (D) IFNγ secretion of CD8+ T cells that were incubated for 3 d with or without NUP-MDSC as indicated. NUP-MDSC were treated with 0.1% DMSO, 1 μM RA, or 0.1 μM DZNep during 4-d differentiation prior to T cell co-culture. During the 3 d of the suppression assay 0.5 mM L-cysteine or L-arginine were added to DMSO-treated NUP-MDSC. Data is representative of three independent experiments. Asterisks represent statistical significance (two-tailed t-test with Welch's correction) with ns: not significant, *p < 0.05; **p < 0.01; ***p < 0.001.
DZNep alters expression of MDSC master regulators
MDSC differentiation and suppressive function have been shown to be dependent on C/EBPβ27,28, HIF1-α,33,57 and STAT29-32 transcription factors. Indeed, cells deficient for either of these genes lack suppressive activity. Similarly, enforced expression of IRF8 was shown to inhibit MDSC functions.32 We hypothesized that deregulation of MDSC effector molecules and suppressive functions might be due to alteration of the expression of key transcription regulators. Our results show that C/EBPβ expression was decreased upon DZNep treatment whereas RA had no effect (Fig. 8A). Furthermore, DZNep treatment led to a decrease in Hif1a transcription (Fig. 8B, left). HIF1-α protein is regulated in a post-translational manner. It is kept at low levels at normoxia through degradation and accumulates during hypoxia.33,57 To investigate whether decrease in the Hif1a transcript would affect protein accumulation during hypoxia, we differentiated NUP cells into MDSC for 3 d in the presence or absence of RA or DZNep and kept cells at normoxia or hypoxia for additional 20 h. Our results demonstrate that the level of HIF1-α in DMSO- and RA-treated NUP-MDSC increased upon hypoxia (Fig. 8B, right). In contrast, DZNep-treated cells failed to upregulate HIF1-α level (Fig. 8B, right). Nevertheless, DZNep did not inhibit hypoxia-mediated upregulation of HIF1-α in B16 or LLC cells suggesting cell-specific inhibition (data not shown). Finally, DZNep had no significant effect on STAT3 phosphorylation but increased the level of STAT5 phosphorylation and slightly downregulated IRF8 expression (Fig. 8C and D). Altogether, DZNep treatment decreased the expression of MDSC master regulators C/EBPβ and HIF1-α but not proximal STAT signaling.
Figure 8.
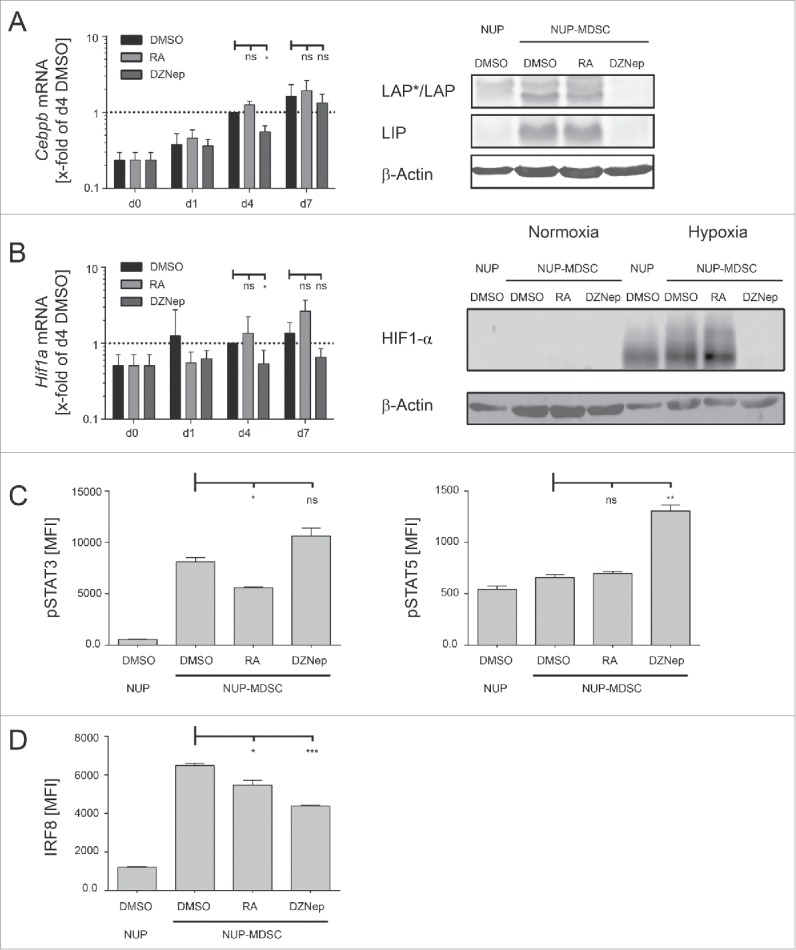
DZNep alters expression of MDSC master regulators. (A, B) NUP cells were incubated for 0, 1, 4 or 7 d with 20 ng/mL GM-CSF, 20 ng/mL IL-6 and DMSO, 1 μM RA or 0.1 μM DZNep. (A) Cebpb mRNA levels were normalized to 18s rRNA transcript level and are represented as x-fold of day 4 DMSO-treated NUP-MDSC. The corresponding WB shows C/EBPβ isoforms LAP (liver-enriched activator protein), LAP* and LIP (liver-enriched inhibitory protein) as well as β-actin in cell lysates of NUP-MDSC treated with DMSO, RA, or DZNep. (B) Hif1a mRNA levels were normalized to 18s rRNA transcript level and are represented as x-fold of day 4 DMSO-treated NUP-MDSC. The corresponding WB shows HIF1-α content in cell lysates of NUP-MDSC that were treated with DMSO, RA or DZNep for 4 d either in normoxia or hypoxia (20 h). Data in (A) and (B) represent mean ± SD of 3–4 independent replicates. (C) Bar diagrams are showing the amount of phosphorylated STAT3 or STAT5 for NUP-MDSC on day 0 (NUP) and day 4 (DMSO, RA, and DZNep). MFI-values represent mean ± SD of three independent replicates. (D) Bar diagrams are showing the amount of IRF8 for NUP-MDSC on day 0 (NUP) and day 4 (DMSO, RA, and DZNep). MFI-values represent mean ± SD of three independent replicates. Asterisks represent statistical significance (two-tailed t-test with Welch's correction) with ns: not significant, *p < 0.05; **p < 0.01; ***p < 0.001
Discussion
In this work, we differentiated immortalized bone marrow progenitors (NUP cells) into cells displaying all features of MDSC including (1) upregulation of the master regulators C/EBPβ and HIF1-α; (2) expression of MDSC immunosuppressive molecules such as PD-L1, Arginase-1, arginine (CAT2), and cystine (xCT) transporters as well as ROS and RNS; and (3) suppression of T cell proliferation and cytokine production upon stimulation. In fact, all MDSC characteristics could be switched on in a quasi-digital manner when NUP cells were cultured in the presence of GM-CSF and IL-6. These cells very closely resembled BM-MDSC counterpart with very few noticeable differences including a lower proportion of PMN-MDSC. The system has several advantages. First, it provides a convenient and almost unlimited source of progenitor cells that can be differentiated into several myeloid cell subsets.39 Second, NUP cells are significantly more homogenous as compared with mouse bone marrow progenitors. Third, NUP cells can be manipulated genetically far more easily than bone marrow cells (antibiotic selection, expansion, etc.) and are therefore better suited for screening purposes. We used this system to perform a screening using 95 compounds targeting epigenetic regulators. Phenotypic alterations were clearly noticeable in the case of RA treatment and subtler for several other compounds but could altogether be easily identified using simple metrics such as mean fluorescence intensity or percentage positive cells (e.g., CD11b and Gr-1). In fact, the nature of the data lends itself to more sophisticated computer-assisted analytical methods.
Our screening identified DZNep as a new inhibitor of MDSC immunosuppressive functions. We showed that RA and DZNep interfere with the ability of MDSC to suppress T cell activity in a different manner. RA treatment impaired predominantly T cell proliferation suppression, whereas DZNep treatment reduced the inhibition of IFNγ secretion. These findings highlight the multiplicity of suppression mechanisms and the fact that they may affect T cells in a different manner. Our results suggest that suppression occurs downstream of TCR signaling as T cells did blast in the presence of MDSC but neither proliferated nor produced cytokines. RA and DZNep treatment both affected the expression of PD-L1 as well as ROS/RNS production, although to a different extent. However, the compounds altered amino acid transporter (CAT2/Slc7a2, xCT/Slc7a11) and metabolic enzyme (Arg1, Nos2) expression in a different fashion. Interestingly, RA but not DZNep decreased cystine transporter expression (Slc7a11). Furthermore, the addition of cysteine to T cell/MDSC co-culture rescued T cell proliferation but not cytokine production. This finding might suggest that the consequence of cysteine depletion affects mostly cell proliferation rather than cytokine production. Similarly, others have shown that increase of cysteine availability in the medium rescued 3H-thymidine uptake by T cells and hence proliferation.55
We conclude that RA and DZNep inhibit MDSC function through downregulation of several key effector molecules as well as master regulators (Cebpb, Hif1a) in the case of DZNep treatment. It may be tempting to postulate that RA induces an alternative pathway of differentiation given the drastic changes in phenotype whereas DZNep prevents full differentiation into MDSC by downregulating master regulators. Nevertheless, the precise mechanism, by which compounds modify the expression of those genes, remains unknown. RA and DZNep treatments are likely to induce a differential expression of numerous genes in a direct and indirect fashion. Not surprisingly, the inhibition of DNA methyltransferase activity by DZNep has been shown to have pleiotropic effects on anti-tumor responses as reported by several independent studies.46,47,58,59 5-aza-2-deoxycytidine (5-AZA-dC) and DZNep have been shown to improve anti-tumor response by increasing CXCL9 and CXCL10 expression in cancer cells and tumor infiltration by T cells60 or by inducing type I or III interferon responses through reactivation of endogenous retrovirus transcription.61,62 On the other hand, EZH2 deletion or inhibition has been reported to negatively impact cytokine production and T cell survival.63 These contrasting results highlight many ways in which epigenetic regulators can impact the immune system.
Taken together, small molecule inhibitors are likely to be less specific than monoclonal antibodies; nevertheless, they offer greater possibilities in the number and subcellular localization of potential targets. The identification of compounds that can modulate cell differentiation or function for the purpose of immunotherapy requires the establishment of scalable assays. This study demonstrates the feasibility of such approaches.
Materials and methods
Mice
C57BL/6j mice were maintained under specific pathogen-free conditions in the animal facility of the University of Heidelberg. All animal experiments were done in accordance with German legislation governing animal studies.
Generation of NUP98/HOXB4 cells
To generate NUP98/HOXB4 cells, we used freshly isolated bone marrow cells of C57Bl/6j mice. The bone marrow cells were treated with ACK lysis buffer and subsequently depleted for CD19+ and Gr-1+ cells with magnetic cell isolation and cell separation (MACS). The remaining cells were cultured for 3 d in NUP medium (see below) before using them for retroviral transduction.
The expression plasmids pSTITCH-GFP (pST-GFP), pHit60 [murine leukemia virus (MLV)-Gag/Pol], pHit123 [ecotropic MLV envelope], as well as MLV-A [amphotropic MLV envelope] were kindly provided by Reno Debets (Department of Medical Oncology, Erasmus MC, Rotterdam, The Netherlands).64 To generate pST-NUP98-HOXB4-IRES-Hyg, cDNA encoding the fusion protein NUP98-HoxB4 was amplified from pMyc-NUP98-HOXB4-IP (kind gift from Klaus Karjalainen & Antonius Rolink) and transferred into pST-GFP. Simultaneously, GFP was replaced by the hygromycin resistance gene using the Gibson assembly cloning strategy (New England BioLabs, Ipswich, USA).
MLV-based vector production was performed as described previously.65 Virus containing supernatant was harvested after 72 h and either used immediately for transduction or stored at −80°C until further use.
Retroviral transduction was performed as follows: 24-well plates were coated with 16 µg/mL RetroNectin (Takara Bio Europe/Clontech, #T100B) for 2 h at 37°C. Subsequently, 2 mL of virus containing medium was spun on the plates at 3200g for 1 h. Bone marrow progenitors were resuspended at 1 × 10⁷ cells/mL in NUP growth medium, mixed gently with 4 µg/mL polybrene (Sigma Aldrich, #107689), and 2 × 10⁶ cells were added per 24-well. Spin-oculation was performed at 650g for 1 h at room temperature (RT). Two hours after transduction, the cells were washed once and resuspended in NUP growth medium at a density of 0.5 × 10⁶ cells/mL. Antibiotic selection with 300 µg/mL hygromycin B (Merck KGaA, #400050) was performed from day 2 to day 5 after transduction.
Cultivation of NUP98/HOXB4 cells
NUP98/HOXB4 cells were cultivated in RPMI1640 medium (Life Technologies, 21875–034) containing 10% FBS (Life Technologies, #10270106) 100U/mL penicillin (Life Technologies, #15140122) 100µg/mL streptomycin (Life Technologies, #15140122), 1 mM sodium pyruvate (Life Technologies, #11360070), 2 mM β-mercaptoethanol (Life Technologies, 31350-010), 1X non-essential amino acids (Life Technologies, 11140-035), 20 ng/mL IL-6 (BioLegend, #575708) and 10 ng/mL SCF (BioLegend, #579708) in tissue culture flasks (37°C, 5% CO2). Every 2 or 3 d, the NUP cells were split to a concentration of 0.2 × 10⁶–0.3 × 10⁶ cells/mL for up to 3 weeks. To induce MDSC differentiation, the NUP cells (not older than 4 weeks) were pelleted and resuspended in RPMI1640 medium (10% FBS, 100U/mL penicillin, 100µg/mL streptomycin, 1 mM sodium pyruvate, 2 mM β-mercaptoethanol, 1X non-essential amino acids) containing 20 ng/mL IL-6 and 20 ng/mL GM-CSF (BioLegend, #576304). For the characterization of the differentiation process, cells were seeded in 12-well plates for 1–7 d. Cells differentiated for 7 d were split once during this time at day 4. Retinoic acid (R&D Diagnostics, #8687), 3-Deazaneplanocin A (Cayman Chemicals, #13828), and the chemicals from the Epigenetics Screening Library (Cayman Chemicals, #11076) were added at 1 µM or 0.1 µM during the differentiation process. Since the chemicals were solved in DMSO, we used the highest remaining DMSO percentage (0.1%) as control (DMSO MDSC). To investigate HIF1-α production under normoxic and hypoxic conditions, we used NUP cells that were already differentiated for 3 d with GM-CSF/IL-6 and put them into a hypoxia chamber (Stem Cell, Cologne) for additional 20 h at 37°C, 5% CO2, and 1% O2.
To compare the above described NUP-derived MDSCs with MDSC derived from untransduced murine bone marrow, we isolated fresh bone marrow of mice and performed exactly the same experiments as described above at the same time.
Flow cytometry
Antibody staining was done in the presence of Fc receptor blockade (TruStain fcX BioLegend, #101320) in FACS buffer (1X PBS with 1% FBS). SytoxBlue (Thermo Fisher Scientific, S34857) was used for exclusion of dead cells. Antibodies used for flow cytometry were as follows (all from BioLegend unless indicated otherwise): Fluorescein(FITC)-anti-Gr1 (#108406), allophycocyanin (APC)-anti-CD11c (#117310), PerCP-anti-CD11b (#101230), APC-Cy7-anti-MHCII (#107628), phycoerythrin (PE)-anti-PD-L1 (#124307), Pe-Cy7-anti-F4/80 (#123143), Pacific Blue-anti-CD8+ (eBioscience, #48-0081-82), PE-Cy7-CD40 (#124622), PE-Cy5-CD80 (#104712), FITC-CD86 (#105109), Alexa488-Ly6C (#128022), APC-Cy7-Ly6G (#127623), PE-Cy7-IL-4Rα (#144806), Alexa488-phospho-(Tyr705)STAT3 (#651006), APC-phospho-(Y694)STAT5 (eBioscience, #17-9010-42) and PE-IRF8 (eBioscience, #12-9852-80). The cells were stained in FACS buffer containing antibodies at 4°C for 30 min, washed, and resuspended in FACS buffer. For intracellular staining, cells were treated with Nuclear Factor Fixation and Permeabilization buffer (BioLegend, #422601) as described by the provider. Afterwards the staining procedure was performed as described above. ROS staining was performed with the DCFDA dye (abcam, ab113851) and RNS staining with the DAF-2DA dye (Enzo Life Science, ALX-620-056-M001) according the manufacturer's instructions. Briefly, the cells were stained with 2 μM DCFDA or 2 μM DAF-2 DA for 30 min at RT in FACS buffer, washed twice, and used for FACS measurements. A FACSAria IIu cytometer (BD Biosciences, Heidelberg) and FlowJo software (TreeStar) were used for acquisition and analysis.
Cytokine measurements
Mouse-specific ELISA for the detection of IFNγ (BioLegend, #430801), TNFα (BioLegend, #430901), IL-10 (BioLegend, #431411), TGFβ1 (eBioscience, #88-8350), and VEGF (R&D Systems, #MMV00) was used to detect cytokines in the supernatants generated in vitro according the manufacturer's instructions.
Western blot
Protein concentration in lysates was determined using the Pierce BCA protein assay kit (Thermo Fisher Scientific, #23227). Samples and standards were diluted in lysis buffer (10 mM Tris–HCl, 0.4% Triton X-100, complete ULTRA Tablets Mini in H2O), and the assay was performed following manufacturer's instructions. The samples were incubated with anti-S100A8 (abcam, ab92331), anti-S100A9 (abcam, ab105472), anti-C/EBPβ (abcam, #ab32358), anti-HIF1-α (abcam, ab82832), or anti-β-Actin (Cell Signaling, #3700) antibodies overnight at 4°C. After washing the membrane 3–4 times for 5 min in washing buffer, it was incubated with anti-rabbit IgG-HRP (Cell Signaling, #7074P2) for 1 h at RT, followed by another washing step. The signal was measured with a Licor c-digit Imaging System (LI-COR, Nebraska).
Measurement of arginase activity
A total of 5 ×10⁵ NUP cells or MDSC (NUP- or BM-derived) were lysed in 50 µL lysis buffer (10 mM Tris–HCl, 0.4% Triton X-100, complete ULTRA Tablets Mini in H2O) for 10 min at 4°C. After centrifugation at 600 rpm for 10 min, 20 µL of the supernatant was mixed with 20 µL of freshly prepared manganese solution (50 mM Tris–HCl, pH 7.4, 10 mM MnCl2 in H2O) in a 96-well PCR plate. A dilution series of the urea standard was prepared in H2O, ranging from 20 mM to 312.5 µM, and 40 µL/well was added. The plate was incubated at 55°C for 10 min in a PCR machine to activate arginase activity in the sample. Afterwards, L-arginine solution (0.5 M L-arginine in H2O, pH 9.7) was added to each sample and the plate was incubated at 37°C for 1 h. The reaction was stopped by adding 80 µL of stop solution (H2SO4 (96%):H3PO4 (85%):H2O = 1:3:6) and 10 µL of α-isonitroso-propriophenone (9% in ethanol) to each well. The reaction was stopped after 10–40 min, depending on the intensity of the color change. 100 µL of each sample was transferred into a clear flat-bottom 96-well plate and to remove remaining turbidity in the wells, additional 100 µL of stop solution was added to each well. Absorption was measured at 560 nm with a microplate reader (GloMax®-Multi+, Promega, Mannheim). Arginase activity was calculated based on the results of the standard curve. In addition, results were normalized to protein content of the lysates.
RNA isolation, cDNA synthesis, and real-time-PCR
For RNA isolation, 5 × 10⁶ cells were washed in PBS and resuspended in 300 µL Trizol (LifeTechnologies, #15596026). The RNA was isolated according the manufacturer's instructions. The RNA concentration was determined using the BioDrop DUO (BioDrop Ltd., Cambridge) and 1 µg total RNA was used for cDNA synthesis. The mRNA was transcribed in cDNA with the High Capacity cDNA Reverse Transcription Kit (Applied Biosystems, #4368814) according the manufacturer's instructions.
RT-PCR was performed using the TaqMan® assay (Life Technologies) and TaqMan® primer/probes (Life Technologies) according the manufacturer's instructions. The RT-PCR was run with Rotor Gene Q (Qiagen, Hilden). The measurement was done as technical triplicates and each Ct-value was normalized using the housekeeping gene 18s rRNA. Relative expression levels for each gene were calculated based on comparison with day 4 DMSO NUP-MDSC.
T cell isolation and suppression assay (MIATA-compliant)
The sample
WT mice were transported from the animal facility to our laboratory and sacrificed immediately. Spleen and lymph nodes of WT mice were isolated, mashed through a 40 µm cell strainer (NeoLab, ST292712340) and incubated 5 min with ACK-lysing buffer (Life Technologies, A10492-01) at RT. The process was stopped with MACS buffer (1X PBS, 2% FBS, and 2 mM EDTA) and after a centrifugation step the cells were counted and resuspended in MACS buffer for subsequent MACS CD8+ T cell isolation (Miltenyi Biotech, 130-104-075) according the manufacturer's instructions. The whole process from organ isolation to single cell suspension took approximately 1.5 h.
None of the cells were stored/frozen and reused later.
An aliquot of the cells was stained with trypan blue (Life Technologies, #15250-061) to discriminate between alive and dead cells and counted with a Neubauer improved chamber using a microscope (Leica, Wetzlar). The median cell yield per mouse (splenocytes and lymphnodes) was 1.2 × 10⁸ and the CD8+ T cell yield ∼9×10⁶ per mouse. Cell viability was >95% and the purity of the CD8+ T cell fraction was >90% (detected with FACS). Before using the cells for the assay they were incubated with 1 µM CFSE (BioLegend, #423801) in PBS for 5 min at 37°C. Afterwards the cells were pelleted and resupended in assay medium (see below).
The assay
The assay was performed in RPMI1640 medium (Life Technologies, 21875-034) containing 10% FBS (Life Technologies, #10270106) 100 U/mL penicillin (Life Technologies, #15140122), 100 µg/mL streptomycin (Life Technologies, #15140122), 1 mM sodium pyruvate (Life Technologies, #11360070), 2 mM β-mercaptoethanol (Life Technologies, 31350-010), and 1X non-essential amino acids (Life Technologies, 11140-035). The serum used for all experiments was from the same batch and was constantly monitored by the provider (Life Technologies).
Before adding the freshly isolated CD8+ T cells into the assay, flat-bottom 96-wells were coated with 2 μg/mL anti-CD3 and 2 μg/mL anti-CD28 antibodies (BioLegend #100302 and #102102) in 50 μL PBS per well for 30 min at 37°C. After washing the wells with PBS, 1×10⁵ CFSE labeled CD8+ T cells were added to each well. Recombinant mouse IL-2 (BioLegend, #575402) was added to induce proliferation at a final concentration of 5 ng/mL. 1×10⁵ NUP cells or different amounts of freshly generated NUP-MDSC (0.125×10⁵–1×10⁵), untreated or treated with the above mentioned chemicals, were added. T cells without mIL-2 and without CD3/28 stimulation were used as negative control and stimulated T cells without addition of other cells as positive control. NUP cells were added in each replicate to demonstrate that there is no suppressive activity prior to the differentiation process into MDSC.
After 72 h of incubation at 37°C and 5% CO2, the cells were transferred into a 96-well V-bottom plate and pelleted. The supernatant was saved for subsequent measurement of cytokines while the cells were stained with CD8α-eFluor450 (eBioscience, #48-0081) to determine proliferation by measuring the CFSE signal via FACS.
Data acquisition
Samples were acquired using the FACSAria IIu cytometer (BD Biosciences, Heidelberg) and FACS diva software (TreeStar). CS&T beads (BD Biosciences, 655051) were used to set up the Photo Multiplier Tube (PMT) voltages prior to measuring samples. Samples were compensated using single stained, CFSE-negative T cells and samples. The unstimulated T cells were used as reference for cells that did not proliferate.
Raw data
As described, stimulated T cells were used as positive control, representing the status of maximal proliferation and maximal IFNγ and TNFα production. For unstimulated T cells, there was no background reactivity detectable, neither for proliferation nor for cytokine production. Raw data can be provided per request. Suppressive activity due to MDSC co-culture was pre-defined by reduced T cell proliferation and/or significantly reduced cytokine production. Data analysis was performed using Microsoft Office Excel as well as GraphPad Prism. Statistical analysis of results was done by performing unpaired, two-tailed t-test with Welch's correction using GraphPad Prism. Significance levels were defined as *p < 0.05, **p < 0.01, and ***p < 0.001.
General lab operation
These studies were conducted in a laboratory that operates under exploratory research principles. The study was performed using investigative and established laboratory protocols and was performed using investigative and validated assays.
High throughput assay—surface marker
For high throughput screening of the compound library 5×10⁴ NUP cells were added in 96-wells and incubated with the compounds for 4 d (37°C, 5% CO2). Afterwards the cells were transferred into a V-shaped 96-well plate and pelleted. The cells were washed with FACS buffer, resuspended in FACS buffer containing FACS-antibodies, and incubated for 30 min at 4°C. Then, the cells were pelleted again, washed with FACS buffer, resupended in 100 μL FACS buffer, and transferred to a U-bottom 96-well. The measurement was done using a BD FACSCanto RUO Special Order System (BD Biosciences, Heidelberg) which is equipped with a high-throughput sampler for plate-based acquisition (96-well plate format). Before loading the machine, each sample was pipetted up and down by the system for three times to resuspend the cells. Of each sample, 20 μL was assessed by the machine to be able to compare the amount of cells in the respective volume, to determine the impact of the compound on cell viability and growth. Data was analyzed using the software FlowJo (BD).
Supplementary Material
Disclosure of potential conflicts of interest
No potential conflicts of interest were disclosed.
Acknowledgments
We thank Reno Debets for providing pSTITCH viral vector. We thank Klaus Karjalainen for providing NUP98/HOXB4 construct and Antonius Rolink for providing cells. We thank Monika Langlotz from the “Zentrum für Molekulare Biologie der Universität Heidelberg” (ZMBH) for her support with the high throughput FACS analyses.
Funding
The research of the team “Immunosuppressive Microenvironment of Tumors” at the BioMed X Innovation Center is kindly sponsored by Merck KGaA.
References
- 1.Galon J, Costes A, Sanchez-Cabo F, Kirilovsky A, Mlecnik B, Lagorce-Pages C, Tosolini M, Camus M, Berger A, Wind P et al.. Type, density, and location of immune cells within human colorectal tumors predict clinical outcome. Science 2006; 313:1960-4; PMID:17008531; http://dx.doi.org/ 10.1126/science.1129139 [DOI] [PubMed] [Google Scholar]
- 2.Schumacher TN, Schreiber RD. Neoantigens in cancer immunotherapy. Science 2015; 348:69-74; PMID:25838375; http://dx.doi.org/ 10.1126/science.aaa4971 [DOI] [PubMed] [Google Scholar]
- 3.van der Bruggen P, Traversari C, Chomez P, Lurquin C, De Plaen E, Van den Eynde B, Knuth A, Boon T. A gene encoding an antigen recognized by cytolytic T lymphocytes on a human melanoma. Science 1991; 254:1643-7; PMID:1840703; http://dx.doi.org/ 10.1126/science.1840703 [DOI] [PubMed] [Google Scholar]
- 4.Dudley ME, Wunderlich JR, Robbins PF, Yang JC, Hwu P, Schwartzentruber DJ, Topalian SL, Sherry R, Restifo NP, Hubicki AM et al.. Cancer regression and autoimmunity in patients after clonal repopulation with antitumor lymphocytes. Science 2002; 298:850-4; PMID:12242449; http://dx.doi.org/ 10.1126/science.1076514 [DOI] [PMC free article] [PubMed] [Google Scholar]
- 5.Rosenberg SA, Spiess P, Lafreniere R. A new approach to the adoptive immunotherapy of cancer with tumor-infiltrating lymphocytes. Science 1986; 233:1318-21; PMID:3489291; http://dx.doi.org/ 10.1126/science.3489291 [DOI] [PubMed] [Google Scholar]
- 6.Grupp SA, Kalos M, Barrett D, Aplenc R, Porter DL, Rheingold SR, Teachey DT, Chew A, Hauck B, Wright JF et al.. Chimeric antigen receptor-modified T cells for acute lymphoid leukemia. N Engl J Med 2013; 368:1509-18; PMID:23527958; http://dx.doi.org/ 10.1056/NEJMoa1215134 [DOI] [PMC free article] [PubMed] [Google Scholar]
- 7.Kessels HW, Wolkers MC, van den Boom MD, van der Valk MA, Schumacher TN. Immunotherapy through TCR gene transfer. Nat Immunol 2001; 2:957-61; PMID:11577349; http://dx.doi.org/ 10.1038/ni1001-957 [DOI] [PubMed] [Google Scholar]
- 8.Morgan RA, Dudley ME, Wunderlich JR, Hughes MS, Yang JC, Sherry RM, Royal RE, Topalian SL, Kammula US, Restifo NP et al.. Cancer regression in patients after transfer of genetically engineered lymphocytes. Science 2006; 314:126-9; PMID:16946036; http://dx.doi.org/ 10.1126/science.1129003 [DOI] [PMC free article] [PubMed] [Google Scholar]
- 9.Bocchia M, Bronte V, Colombo MP, De Vincentiis A, Di Nicola M, Forni G, Lanata L, Lemoli RM, Massaia M, Rondelli D et al.. Antitumor vaccination: where we stand. Haematologica 2000; 85:1172-206; PMID:11074658 [PubMed] [Google Scholar]
- 10.Chiang CL, Kandalaft LE, Coukos G. Adjuvants for enhancing the immunogenicity of whole tumor cell vaccines. Int Rev Immunol 2011; 30:150-82; PMID:21557641; http://dx.doi.org/ 10.3109/08830185.2011.572210 [DOI] [PubMed] [Google Scholar]
- 11.Hodi FS, O'Day SJ, McDermott DF, Weber RW, Sosman JA, Haanen JB, Gonzalez R, Robert C, Schadendorf D, Hassel JC et al.. Improved survival with ipilimumab in patients with metastatic melanoma. N Engl J Med 2010; 363:711-23; PMID:20525992; http://dx.doi.org/ 10.1056/NEJMoa1003466 [DOI] [PMC free article] [PubMed] [Google Scholar]
- 12.Topalian SL, Hodi FS, Brahmer JR, Gettinger SN, Smith DC, McDermott DF, Powderly JD, Carvajal RD, Sosman JA, Atkins MB et al.. Safety, activity, and immune correlates of anti-PD-1 antibody in cancer. N Engl J Med 2012; 366:2443-54; PMID:22658127; http://dx.doi.org/ 10.1056/NEJMoa1200690 [DOI] [PMC free article] [PubMed] [Google Scholar]
- 13.Brahmer JR, Tykodi SS, Chow LQ, Hwu WJ, Topalian SL, Hwu P, Drake CG, Camacho LH, Kauh J, Odunsi K et al.. Safety and activity of anti-PD-L1 antibody in patients with advanced cancer. N Engl J Med 2012; 366:2455-65; PMID:22658128; http://dx.doi.org/ 10.1056/NEJMoa1200694 [DOI] [PMC free article] [PubMed] [Google Scholar]
- 14.Gajewski TF. Failure at the effector phase: immune barriers at the level of the melanoma tumor microenvironment. Clin Cancer Res 2007; 13:5256-61; PMID:17875753; http://dx.doi.org/ 10.1158/1078-0432.CCR-07-0892 [DOI] [PubMed] [Google Scholar]
- 15.Joyce JA, Fearon DT. T cell exclusion, immune privilege, and the tumor microenvironment. Science 2015; 348:74-80; PMID:25838376; http://dx.doi.org/ 10.1126/science.aaa6204 [DOI] [PubMed] [Google Scholar]
- 16.Makkouk A, Weiner GJ. Cancer immunotherapy and breaking immune tolerance: new approaches to an old challenge. Cancer Res 2015; 75:5-10; PMID:25524899; http://dx.doi.org/ 10.1158/0008-5472.CAN-14-2538 [DOI] [PMC free article] [PubMed] [Google Scholar]
- 17.Rabinovich GA, Gabrilovich D, Sotomayor EM. Immunosuppressive strategies that are mediated by tumor cells. Annu Rev Immunol 2007; 25:267-96; PMID:17134371; http://dx.doi.org/ 10.1146/annurev.immunol.25.022106.141609 [DOI] [PMC free article] [PubMed] [Google Scholar]
- 18.Chang CH, Qiu J, O'Sullivan D, Buck MD, Noguchi T, Curtis JD, Chen Q, Gindin M, Gubin MM, van der Windt GJW et al.. Metabolic competition in the tumor microenvironment is a driver of cancer progression. Cell 2015; 162:1229-41; PMID:26321679; http://dx.doi.org/ 10.1016/j.cell.2015.08.016 [DOI] [PMC free article] [PubMed] [Google Scholar]
- 19.Ho PC, Bihuniak JD, Macintyre AN, Staron M, Liu X, Amezquita R, Tsui YC, Cui G, Micevic G, Perales JC et al.. Phosphoenolpyruvate is a metabolic checkpoint of Anti-tumor T cell responses. Cell 2015; 162:1217-28; PMID:26321681; http://dx.doi.org/ 10.1016/j.cell.2015.08.012 [DOI] [PMC free article] [PubMed] [Google Scholar]
- 20.Gabrilovich DI, Ostrand-Rosenberg S, Bronte V. Coordinated regulation of myeloid cells by tumours. Nat Rev Immunol 2012; 12:253-68; PMID:22437938; http://dx.doi.org/ 10.1038/nri3175 [DOI] [PMC free article] [PubMed] [Google Scholar]
- 21.Umansky V, Sevko A. Melanoma-induced immunosuppression and its neutralization. Semin Cancer Biol 2012; 22:319-26; PMID:22349515; http://dx.doi.org/ 10.1016/j.semcancer.2012.02.003 [DOI] [PubMed] [Google Scholar]
- 22.Sica A, Larghi P, Mancino A, Rubino L, Porta C, Totaro MG, Rimoldi M, Biswas SK, Allavena P, Mantovani A. Macrophage polarization in tumour progression. Semin Cancer Biol 2008; 18:349-55; PMID:18467122; http://dx.doi.org/ 10.1016/j.semcancer.2008.03.004 [DOI] [PubMed] [Google Scholar]
- 23.Diaz-Montero CM, Salem ML, Nishimura MI, Garrett-Mayer E, Cole DJ, Montero AJ. Increased circulating myeloid-derived suppressor cells correlate with clinical cancer stage, metastatic tumor burden, and doxorubicin-cyclophosphamide chemotherapy. Cancer Immunol Immunother 2009; 58:49-59; PMID:18446337; http://dx.doi.org/ 10.1007/s00262-008-0523-4 [DOI] [PMC free article] [PubMed] [Google Scholar]
- 24.Jiang H, Gebhardt C, Umansky L, Beckhove P, Schulze TJ, Utikal J, Umansky V. Elevated chronic inflammatory factors and myeloid-derived suppressor cells indicate poor prognosis in advanced melanoma patients. Int J Cancer 2015; 136:2352-60; PMID:25353097; http://dx.doi.org/ 10.1002/ijc.29297 [DOI] [PubMed] [Google Scholar]
- 25.Bronte V, Brandau S, Chen SH, Colombo MP, Frey AB, Greten TF, Mandruzzato S, Murray PJ, Ochoa A, Ostrand-Rosenberg S et al.. Recommendations for myeloid-derived suppressor cell nomenclature and characterization standards. Nat Commun 2016; 7:12150; PMID:27381735; http://dx.doi.org/ 10.1038/ncomms12150 [DOI] [PMC free article] [PubMed] [Google Scholar]
- 26.Condamine T, Gabrilovich DI. Molecular mechanisms regulating myeloid-derived suppressor cell differentiation and function. Trends Immunol 2011; 32:19-25; PMID:21067974; http://dx.doi.org/ 10.1016/j.it.2010.10.002 [DOI] [PMC free article] [PubMed] [Google Scholar]
- 27.Marigo I, Bosio E, Solito S, Mesa C, Fernandez A, Dolcetti L, Ugel S, Sonda N, Bicciato S, Falisi E et al.. Tumor-induced tolerance and immune suppression depend on the C/EBPbeta transcription factor. Immunity 2010; 32:790-802; PMID:20605485; http://dx.doi.org/ 10.1016/j.immuni.2010.05.010 [DOI] [PubMed] [Google Scholar]
- 28.Spooner CJ, Guo X, Johnson PF, Schwartz RC. Differential roles of C/EBP beta regulatory domains in specifying MCP-1 and IL-6 transcription. Mol Immunol 2007; 44:1384-92; PMID:16784777; http://dx.doi.org/ 10.1016/j.molimm.2006.05.004 [DOI] [PubMed] [Google Scholar]
- 29.Kumar V, Cheng P, Condamine T, Mony S, Languino LR, McCaffrey JC, Hockstein N, Guarino M, Masters G, Penman E et al.. CD45 phosphatase inhibits STAT3 transcription factor activity in myeloid cells and promotes tumor-associated macrophage differentiation. Immunity 2016; 44:303-15; PMID:26885857; http://dx.doi.org/ 10.1016/j.immuni.2016.01.014 [DOI] [PMC free article] [PubMed] [Google Scholar]
- 30.Nefedova Y, Nagaraj S, Rosenbauer A, Muro-Cacho C, Sebti SM, Gabrilovich DI. Regulation of dendritic cell differentiation and antitumor immune response in cancer by pharmacologic-selective inhibition of the janus-activated kinase 2/signal transducers and activators of transcription 3 pathway. Cancer Res 2005; 65:9525-35; PMID:16230418; http://dx.doi.org/ 10.1158/0008-5472.CAN-05-0529 [DOI] [PMC free article] [PubMed] [Google Scholar]
- 31.Rebe C, Vegran F, Berger H, Ghiringhelli F. STAT3 activation: A key factor in tumor immunoescape. JAKSTAT 2013; 2:e23010; PMID:24058791; http://dx.doi.org/ 10.4161/jkst.23010 [DOI] [PMC free article] [PubMed] [Google Scholar]
- 32.Waight JD, Netherby C, Hensen ML, Miller A, Hu Q, Liu S, Bogner PN, Farren MR, Lee KP, Liu K et al.. Myeloid-derived suppressor cell development is regulated by a STAT/IRF-8 axis. J Clin Invest 2013; 123:4464-78; PMID:24091328; http://dx.doi.org/ 10.1172/JCI68189 [DOI] [PMC free article] [PubMed] [Google Scholar]
- 33.Corzo CA, Condamine T, Lu L, Cotter MJ, Youn JI, Cheng P, Cho HI, Celis E, Quiceno DG, Padhya T et al.. HIF-1alpha regulates function and differentiation of myeloid-derived suppressor cells in the tumor microenvironment. J Exp Med 2010; 207:2439-53; PMID:20876310; http://dx.doi.org/ 10.1084/jem.20100587 [DOI] [PMC free article] [PubMed] [Google Scholar]
- 34.Iclozan C, Antonia S, Chiappori A, Chen DT, Gabrilovich D. Therapeutic regulation of myeloid-derived suppressor cells and immune response to cancer vaccine in patients with extensive stage small cell lung cancer. Cancer Immunol Immunother 2013; 62:909-18; PMID:23589106; http://dx.doi.org/ 10.1007/s00262-013-1396-8 [DOI] [PMC free article] [PubMed] [Google Scholar]
- 35.Kao J, Ko EC, Eisenstein S, Sikora AG, Fu S, Chen SH. Targeting immune suppressing myeloid-derived suppressor cells in oncology. Crit Rev Oncol Hematol 2011; 77:12-9; PMID:20304669; http://dx.doi.org/ 10.1016/j.critrevonc.2010.02.004 [DOI] [PMC free article] [PubMed] [Google Scholar]
- 36.Srivastava MK, Zhu L, Harris-White M, Huang M, St John M, Lee JM, Elashoff D, Strieter R, Dubinett S, Sharma S. Targeting myeloid-derived suppressor cells augments antitumor activity against lung cancer. Immunotargets Ther 2012; 2012:7-12; PMID:24791250; http://dx.doi.org/ 10.2147/ITT.S32617 [DOI] [PMC free article] [PubMed] [Google Scholar]
- 37.Ko JS, Zea AH, Rini BI, Ireland JL, Elson P, Cohen P, Golshayan A, Rayman PA, Wood L, Garcia J et al.. Sunitinib mediates reversal of myeloid-derived suppressor cell accumulation in renal cell carcinoma patients. Clin Cancer Res 2009; 15:2148-57; PMID:19276286; http://dx.doi.org/ 10.1158/1078-0432.CCR-08-1332 [DOI] [PubMed] [Google Scholar]
- 38.Mirza N, Fishman M, Fricke I, Dunn M, Neuger AM, Frost TJ, Lush RM, Antonia S, Gabrilovich DI. All-trans-retinoic acid improves differentiation of myeloid cells and immune response in cancer patients. Cancer Res 2006; 66:9299-307; PMID:16982775; http://dx.doi.org/ 10.1158/0008-5472.CAN-06-1690 [DOI] [PMC free article] [PubMed] [Google Scholar]
- 39.Ruedl C, Khameneh HJ, Karjalainen K. Manipulation of immune system via immortal bone marrow stem cells. Int Immunol 2008; 20:1211-8; PMID:18644831; http://dx.doi.org/ 10.1093/intimm/dxn079 [DOI] [PubMed] [Google Scholar]
- 40.Wang GG, Calvo KR, Pasillas MP, Sykes DB, Hacker H, Kamps MP. Quantitative production of macrophages or neutrophils ex vivo using conditional Hoxb8. Nat Methods 2006; 3:287-93; PMID:16554834; http://dx.doi.org/ 10.1038/nmeth865 [DOI] [PubMed] [Google Scholar]
- 41.Nefedova Y, Fishman M, Sherman S, Wang X, Beg AA, Gabrilovich DI. Mechanism of all-trans retinoic acid effect on tumor-associated myeloid-derived suppressor cells. Cancer Res 2007; 67:11021-8; PMID:18006848; http://dx.doi.org/ 10.1158/0008-5472.CAN-07-2593 [DOI] [PubMed] [Google Scholar]
- 42.Chen PT, Hsieh CC, Wu CT, Yen TC, Lin PY, Chen WC, Chen MF. 1alpha,25-Dihydroxyvitamin D3 inhibits esophageal squamous cell carcinoma progression by reducing IL6 signaling. Mol Cancer Ther 2015; 14:1365-75; PMID:25824337; http://dx.doi.org/ 10.1158/1535-7163.MCT-14-0952 [DOI] [PubMed] [Google Scholar]
- 43.Noonan KA, Ghosh N, Rudraraju L, Bui M, Borrello I. Targeting immune suppression with PDE5 inhibition in end-stage multiple myeloma. Cancer Immunol Res 2014; 2:725-31; PMID:24878583; http://dx.doi.org/ 10.1158/2326-6066.CIR-13-0213 [DOI] [PMC free article] [PubMed] [Google Scholar]
- 44.Weed DT, Vella JL, Reis IM, De la Fuente AC, Gomez C, Sargi Z, Nazarian R, Califano J, Borrello I, Serafini P. Tadalafil reduces myeloid-derived suppressor cells and regulatory T cells and promotes tumor immunity in patients with head and neck squamous cell carcinoma. Clin Cancer Res 2015; 21:39-48; PMID:25320361; http://dx.doi.org/ 10.1158/1078-0432.CCR-14-1711 [DOI] [PMC free article] [PubMed] [Google Scholar]
- 45.Tseng CK, Marquez VE, Fuller RW, Goldstein BM, Haines DR, McPherson H, Parsons JL, Shannon WM, Arnett G, Hollingshead M et al.. Synthesis of 3-deazaneplanocin A, a powerful inhibitor of S-adenosylhomocysteine hydrolase with potent and selective in vitro and in vivo antiviral activities. J Med Chem 1989; 32:1442-6; PMID:2544721; http://dx.doi.org/ 10.1021/jm00127a007 [DOI] [PubMed] [Google Scholar]
- 46.Tam EK, Nguyen TM, Lim CZ, Lee PL, Li Z, Jiang X, Santhanakrishnan S, Tan TW, Goh YL, Wong SY et al.. 3-Deazaneplanocin A and neplanocin A analogues and their effects on apoptotic cell death. ChemMedChem 2015; 10:173-82; PMID:25319940; http://dx.doi.org/ 10.1002/cmdc.201402315 [DOI] [PubMed] [Google Scholar]
- 47.Fiskus W, Wang Y, Sreekumar A, Buckley KM, Shi H, Jillella A, Ustun C, Rao R, Fernandez P, Chen J et al.. Combined epigenetic therapy with the histone methyltransferase EZH2 inhibitor 3-deazaneplanocin A and the histone deacetylase inhibitor panobinostat against human AML cells. Blood 2009; 114:2733-43; PMID:19638619; http://dx.doi.org/ 10.1182/blood-2009-03-213496 [DOI] [PMC free article] [PubMed] [Google Scholar]
- 48.Tan J, Yang X, Zhuang L, Jiang X, Chen W, Lee PL, Karuturi RK, Tan PB, Liu ET, Yu Q. Pharmacologic disruption of Polycomb-repressive complex 2-mediated gene repression selectively induces apoptosis in cancer cells. Genes Dev 2007; 21:1050-63; PMID:17437993; http://dx.doi.org/ 10.1101/gad.1524107 [DOI] [PMC free article] [PubMed] [Google Scholar]
- 49.Corzo CA, Cotter MJ, Cheng P, Cheng F, Kusmartsev S, Sotomayor E, Padhya T, McCaffrey TV, McCaffrey JC, Gabrilovich DI. Mechanism regulating reactive oxygen species in tumor-induced myeloid-derived suppressor cells. J Immunol 2009; 182:5693-701; PMID:19380816; http://dx.doi.org/ 10.4049/jimmunol.0900092 [DOI] [PMC free article] [PubMed] [Google Scholar]
- 50.Bronte V, Zanovello P. Regulation of immune responses by L-arginine metabolism. Nat Rev Immunol 2005; 5:641-54; PMID:16056256; http://dx.doi.org/ 10.1038/nri1668 [DOI] [PubMed] [Google Scholar]
- 51.De Sanctis F, Solito S, Ugel S, Molon B, Bronte V, Marigo I. MDSCs in cancer: conceiving new prognostic and therapeutic targets. Biochim Biophys Acta 2016; 1865(1):35-48; PMID:26255541; http://dx.doi.org/ 10.1016/j.bbcan.2015.08.001 [DOI] [PubMed] [Google Scholar]
- 52.Munder M, Schneider H, Luckner C, Giese T, Langhans CD, Fuentes JM, Kropf P, Mueller I, Kolb A, Modolell M et al.. Suppression of T-cell functions by human granulocyte arginase. Blood 2006; 108:1627-34; PMID:16709924; http://dx.doi.org/ 10.1182/blood-2006-11-010389 [DOI] [PubMed] [Google Scholar]
- 53.Cimen Bozkus C, Elzey BD, Crist SA, Ellies LG, Ratliff TL. Expression of cationic amino acid transporter 2 is required for myeloid-derived suppressor cell-mediated control of T cell immunity. J Immunol 2015; 195:5237-50; PMID:26491198; http://dx.doi.org/ 10.4049/jimmunol.1500959 [DOI] [PMC free article] [PubMed] [Google Scholar]
- 54.Ostrand-Rosenberg S. Myeloid-derived suppressor cells: more mechanisms for inhibiting antitumor immunity. Cancer Immunol Immunother 2010; 59:1593-600; PMID:20414655; http://dx.doi.org/ 10.1007/s00262-010-0855-8 [DOI] [PMC free article] [PubMed] [Google Scholar]
- 55.Srivastava MK, Sinha P, Clements VK, Rodriguez P, Ostrand-Rosenberg S. Myeloid-derived suppressor cells inhibit T cell activation by depleting cystine and cysteine. Cancer Res 2010; 70:68-77; PMID:20028852; http://dx.doi.org/ 10.1158/0008-5472.CAN-09-2587 [DOI] [PMC free article] [PubMed] [Google Scholar]
- 56.Lewerenz J, Hewett SJ, Huang Y, Lambros M, Gout PW, Kalivas PW, Massie A, Smolders I, Methner A, Pergande M et al.. The cystine/glutamate antiporter system x(c)(−) in health and disease: from molecular mechanisms to novel therapeutic opportunities. Antioxid Redox Signal 2013; 18:522-55; PMID:22667998; http://dx.doi.org/ 10.1089/ars.2011.4391 [DOI] [PMC free article] [PubMed] [Google Scholar]
- 57.Kumar V, Gabrilovich DI. Hypoxia-inducible factors in regulation of immune responses in tumour microenvironment. Immunology 2014; 143:512-9; PMID:25196648; http://dx.doi.org/ 10.1111/imm.12380 [DOI] [PMC free article] [PubMed] [Google Scholar]
- 58.Girard N, Bazille C, Lhuissier E, Benateau H, Llombart-Bosch A, Boumediene K, Bauge C. 3-Deazaneplanocin A (DZNep), an inhibitor of the histone methyltransferase EZH2, induces apoptosis and reduces cell migration in chondrosarcoma cells. PLoS One 2014; 9:e98176; PMID:24852755; http://dx.doi.org/ 10.1371/journal.pone.0098176 [DOI] [PMC free article] [PubMed] [Google Scholar]
- 59.Zhou J, Bi C, Cheong LL, Mahara S, Liu SC, Tay KG, Koh TL, Yu Q, Chng WJ. The histone methyltransferase inhibitor, DZNep, up-regulates TXNIP, increases ROS production, and targets leukemia cells in AML. Blood 2011; 118:2830-9; PMID:21734239; http://dx.doi.org/ 10.1182/blood-2010-07-294827 [DOI] [PubMed] [Google Scholar]
- 60.Peng D, Kryczek I, Nagarsheth N, Zhao L, Wei S, Wang W, Sun Y, Zhao E, Vatan L, Szeliga W et al.. Epigenetic silencing of TH1-type chemokines shapes tumour immunity and immunotherapy. Nature 2015; 527:249-53; PMID:26503055; http://dx.doi.org/ 10.1038/nature15520 [DOI] [PMC free article] [PubMed] [Google Scholar]
- 61.Chiappinelli KB, Strissel PL, Desrichard A, Li H, Henke C, Akman B, Hein A, Rote NS, Cope LM, Snyder A et al.. Inhibiting DNA methylation causes an interferon response in cancer via dsRNA including endogenous retroviruses. Cell 2015; 162:974-86; PMID:26317466; http://dx.doi.org/ 10.1016/j.cell.2015.07.011 [DOI] [PMC free article] [PubMed] [Google Scholar]
- 62.Roulois D, Loo Yau H, Singhania R, Wang Y, Danesh A, Shen SY, Han H, Liang G, Pugh TJ, Jones PA et al.. DNA-demethylating agents target colorectal cancer cells by inducing viral mimicry by endogenous transcripts. Cell 2015; 162:961-73; PMID:26317465; http://dx.doi.org/ 10.1016/j.cell.2015.07.056 [DOI] [PMC free article] [PubMed] [Google Scholar]
- 63.Zhao E, Maj T, Kryczek I, Li W, Wu K, Zhao L, Wei S, Crespo J, Wan S, Vatan L et al.. Cancer mediates effector T cell dysfunction by targeting microRNAs and EZH2 via glycolysis restriction. Nat Immunol 2016; 17:95-103; PMID:26523864; http://dx.doi.org/ 10.1038/ni.3313 [DOI] [PMC free article] [PubMed] [Google Scholar]
- 64.Pouw NM, Westerlaken EJ, Willemsen RA, Debets R. Gene transfer of human TCR in primary murine T cells is improved by pseudo-typing with amphotropic and ecotropic envelopes. J Gene Med 2007; 9:561-70; PMID:17471588; http://dx.doi.org/ 10.1002/jgm.1047 [DOI] [PubMed] [Google Scholar]
- 65.Stolp B, Imle A, Coelho FM, Hons M, Gorina R, Lyck R, Stein JV, Fackler OT. HIV-1 Nef interferes with T-lymphocyte circulation through confined environments in vivo. Proc Natl Acad Sci USA 2012; 109:18541-6; PMID:23093676; http://dx.doi.org/ 10.1073/pnas.1204322109 [DOI] [PMC free article] [PubMed] [Google Scholar]
Associated Data
This section collects any data citations, data availability statements, or supplementary materials included in this article.