ABSTRACT
The metabolic reprogramming is indispensible for the fast growth of tumor cells. The metabolism of CAFs is reprogrammed to aerobic glycolysis too. However, it is not clear whether this metabolic reprogramming promotes the growth of CAFs themselves. In this study, we found that the proliferation rate of CAFs was slower than NAFs, which was determined by cell counting, BrdU assay and flow cytometry analysis. Moreover, we found TGF-β signaling regulated cell growth of CAF through RNA-sequencing analysis and Western blot, which was further supported by the observation that TGF-β2 was highly expressed in colon cancer tissues. In the end, we demonstrated that CAFs were critical to tumor cell proliferation, which was supported by the evidence of their close localization in clinical tumor tissue and tumor promoting effect in mice. In brief, our data have manifested that the proliferation rate is decreased in CAFs, which enable CAFs generate more intermediate metabolites to support tumor cells growth, suggesting CAFs is an ideal target for tumor therapy.
KEYWORDS: Cancer-associated fibroblasts (CAF), cell cycle checkpoint, Non-activated fibroblasts (NAF), proliferation
Introduction
The development and progression of tumors are controlled not only by tumor cells but also by their surrounding stromal cells.1-5 Cancer-associated fibroblasts (CAFs), a major component of cancer stromal cells that account for about 40∼50% of total cell population in cancer.6 CAFs are primarily derived from the activation of quiescent fibroblasts surrounding cancer cells, and have been shown to directly promote tumor initiation7,8 progression9,10 and metastasis11,12 CAFs produce ECM-degrading enzymes, secrete growth factors and cytokines, which collectively promote tumor development and progression.13-18,19-21
Previous studies have revealed that the metabolism in CAFs is reprogrammed.6,22 The glucose uptake and lactate generation in CAFs are dramatically increased, which is also known as the reverse Warburg effect to distinguish from the Warburg effect of tumor cells. CAFs secrete large amounts of lactate and ketone bodies, which are utilized by tumor cells for anabolic metabolism or oxidative phosphorylation to accelerate the tumor cell growth.21 For example, β-hydroxybutyrate, one of ketone bodies, increased cancer cell proliferation approximately 3-fold compare with the control group, and lactate promoted angiogenesis in tumor model.19-21 However, it remains unclear whether this metabolic reprogramming promotes the growth of CAFs themselves.
In this study, we found that the proliferation decreased rather than increased in clinical isolated CAFs, distinct from tumor cells. Moreover, the expression profiling analysis revealed TGF-β2 signaling-activated G1/S checkpoint played critical role in inhibiting CAFs growth. These observations suggest that CAFs are critical for the fast growth of tumor cells and a potential target for tumor therapy, although CAFs are not tumorigenic.
Results
Isolation and identification of cancer-associated fibroblasts from clinical colon cancer and liver cancer
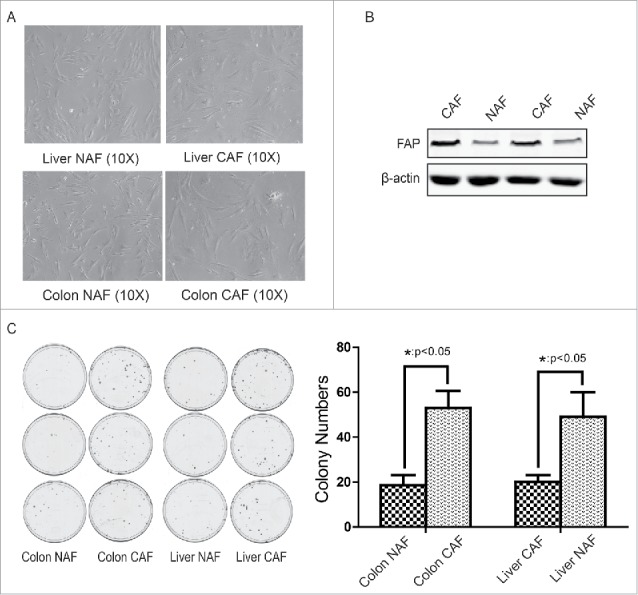
To determine whether metabolic reprogramming promotes the growth of cancer-associated fibroblasts (CAFs), the CAFs were first isolated from clinical colon cancers (4 cases) or liver cancers (1 cases) and non-activated fibroblasts (NAFs) were isolated from paratumor tissue at least 6 cm away from tumor border. From the morphology observation, the most of fibroblasts from tumor tissue were multipolar compare with NAFs, which were bipolar (Fig. 1A).
Figure 1.

Isolation and identification of cancer-associated fibroblasts from clinical colon cancer and liver cancer. (A) The morphology of CAF and NAF isolated from colon cancer or liver cancer. (B) Identification of CAF by FAP expression. C. Identification of CAF by its tumor-promoting effect. The cologenic assay was performed. *: p < 0.05.
To further identify these fibroblasts from tumor tissue are CAFs, the expression of fibroblast activation marker FAP and their function were analyzed. As shown in Figure 1B, the expression of FAP was increased in CAFs compare with NAFs. Through co-culture with CAF-conditioned medium, the colony numbers of colon cancer HCT116 cells or liver cancer HepG2 cells was counted. As shown in Figure 1C, the colon CAFs dramatically promoted colon cancer growth (48 ± 3 vs 17 ± 2 colonies per dish) and the liver CAFs also enhanced liver cancer growth (44 ± 4 vs 18 ± 1 colonies per dish). These observations suggest that the isolation of CAF and NAF were successful.
Cell proliferation was downregulated in CAFs
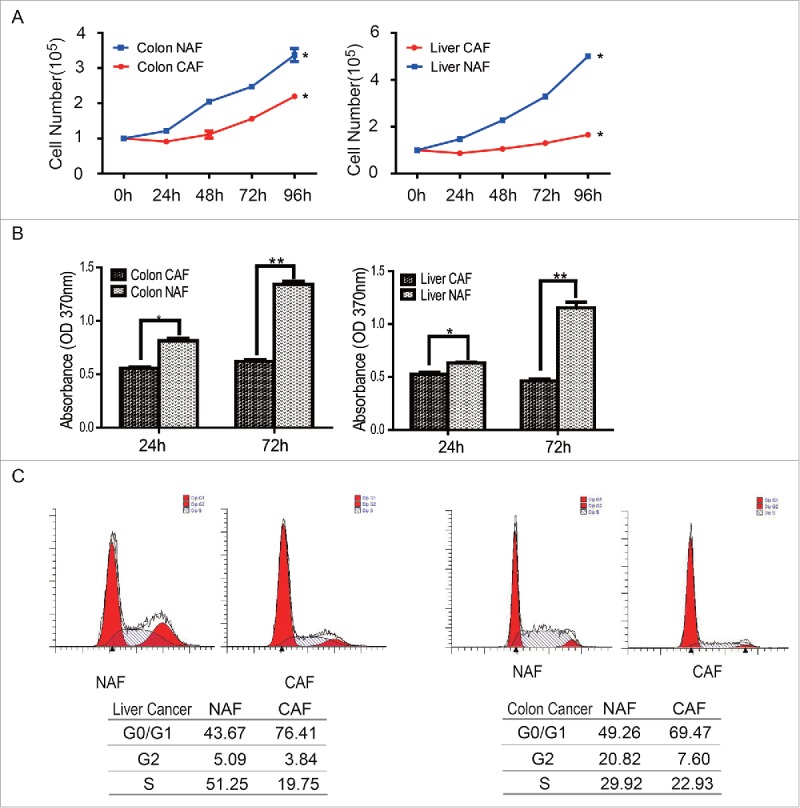
To examine whether CAFs grow faster than non-activated fibroblasts, the cell numbers were first counted at the indicated time points. The 1 × 10⁵ cells of CAF or NAF were seeded in the 10 cm dishes at the beginning. As shown in Figure 2A, the total cell numbers of CAF, no matter from colon cancer or liver cancer, were less than that in NAF group, suggesting CAFs grow slower than the relative NAFs. To further test whether the cell proliferation of CAFs is lower than NAFs, the proliferation rate were determined by the BrdU incorporation assay at the 24 hour or 72 hours after seeding. Compared to NAFs, the proliferation rate of CAFs were lower than that in control group (Figure 2B). These observations suggest the cell proliferation of CAF is decreased rather than increased.
Figure 2.

Cell proliferation was downregulated in CAFs. (A) CAFs grow slower than NAFs. Cell numbers were counted at the indicated time points, *: p < 0.05. (B) The cell proliferation rate of CAFs decreased, compare with NAFs. The cell proliferation rate was determined by the BrdU assay. *: p < 0.05; **: p < 0.01. (C) The subpopulation of CAFs at the G0/G1 phase increased. The cell cycle was analyzed by flow cytometry.
To dissect the mechanism underlying the decreased cell proliferation of CAFs, the cell cycles were analyzed by flow cytometry after PI (Propidium Iodide) staining. As shown in Figure 2C, there were more sub-population of CAFs accumulated at the G0/G1 phase of cell cycle, compare with the relative NAFs. The subpopulation of CAFs at the G0/G1 phase of cell cycle or NAFs from colon cancer was 76.41 vs 43.67; this subpopulation of CAFs or NAFs from liver cancer was 69.74 vs 49.26. This observation suggests that the CAFs were arrested at the G0/G1 phase of cell cycle.
TGF-β2 signaling regulates G1/S checkpoint in CAFs
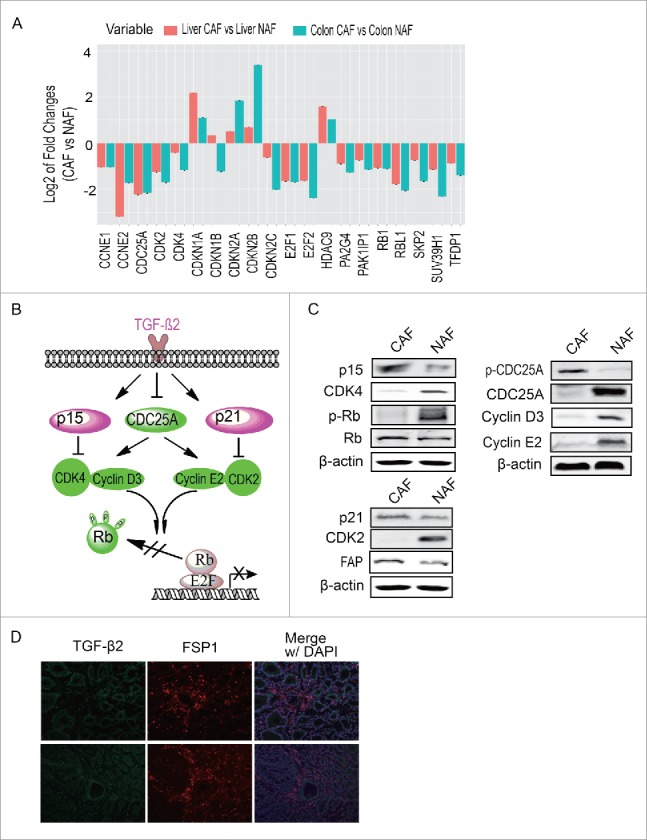
To explore which signaling pathway activates G1/S checkpoint in CAFs, the expression profiling of CAFs were analyzed by RNA-sequencing. The proteins regulating cell cycle, of which the expression level changes at least 2 folds than NAFs, were further analyzed. As shown in Figure 3A, expression of most of CDKs, cyclin proteins and cyclin-dependent kinase inhibitors were significantly altered in CAF, compare with NAFs. Through ingenuity pathway analysis (IPA), we found TGF-β signaling pathway was activated in CAF (Figure 3B). To verify whether TGF-β signaling regulates G1/S checkpoint in CAF, the expression or phosphorylations of molecules involved in this pathway were determined by Western blot. As shown in Figure 3C, TGF-β/p15/CDK4, TGF-β/p21/CDK2 and TGF-β/CDC25A/Cyclin E2 or Cyclin D3 pathways were activated and led to G1/S arrest, consistent with the data shown in Figure 2C. Moreover, the phosphorylation of Rb, a downstream target of these signaling was also detected. The Western blot showed that the Rb was dephosphorylated in CAFs, which further suppressed cell growth.
Figure 3.

TGF-β signaling regulates G1/S checkpoint in CAFs. (A) The analysis of cell cycle regulation pathway. Proteins of which expression changed more than 2 folds and involved in cell cycle regulation were presented (B) The possible pathway regulating G1/S checkpoint. (C) Verification of the possible pathway regulating G1/S checkpoint. (D) The expression of TGF-β2 in colon cancer tissue. FSP1 is a marker of CAF.
In addition, the expression and distribution of TGF-β2 was detected in clinical colon cancer tissue. As shown in Figure 3D, TGF-β2 universally expressed in colon cancer tissue, surrounding cancer cells and CAFs, suggesting TGF-β2 signaling is a critical factor inducing cell cycle arrest in CAFs.
CAFs are critical to the fast growth of cancer cells
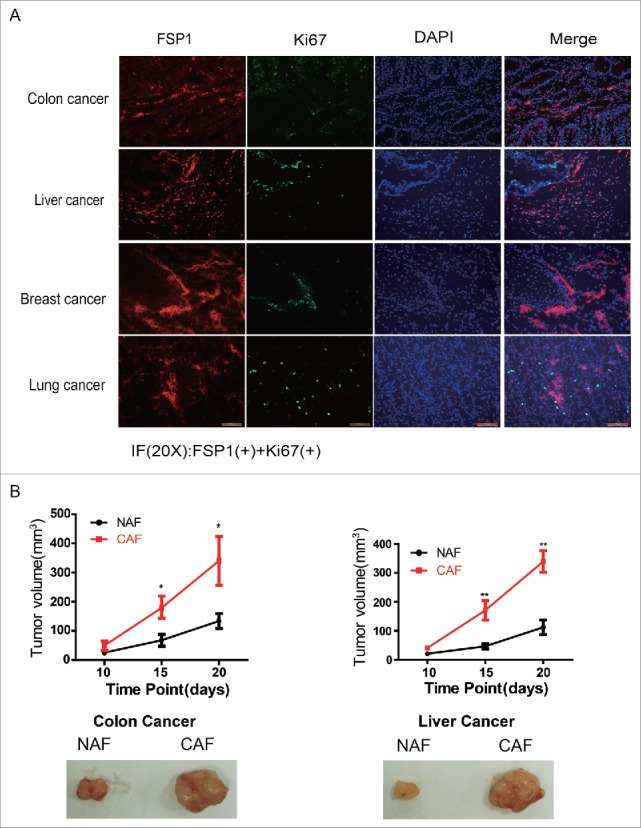
To better understanding how CAFs promotes the fast growth of tumor cells, the co-localization of CAF and proliferating tumor cells was determined by immunofluorescence staining in various types of tumor tissues. As shown in Figure 4A, most of fast proliferating tumor cells, including colon cancer, liver cancer, breast cancer and lung cancer, are adjacent to and/or surrounding by CAFs, suggesting CAFs are critical for the fast growth of tumor cells.
Figure 4.

CAFs are critical to the fast growth of cancer cells. (A) The proliferating tumor cells are closely adjacent to CAFs. The FSP1 is a marker of CAF and the Ki67 is marker for cell proliferation. (B) CAFs promote tumor growth. The pictures are representative photos of tumor in each group. *: p < 0.05; **: p < 0.01.
To further manifest the effect of CAF on tumor growth, the isolated colon CAFs or liver CAFs were co-injected into armpits of nude mice with colon cancer HCT116 cells or liver cancer HepG2 cells, respectively. As shown in Figure 4B, both colon CAFs and liver CAFs remarkably promoted tumor growth, the colon CAFs increased the xenografted HCT116 tumor volume from 116 ± 18 mm3 to 342 ± 42 mm3 and the liver CAFs increased the xenografted HepG2 tumor volume from 102 ± 15 mm3 to 320 ± 22 mm3, their difference was statistically significant. These observations demonstrated that CAFs are critical for tumor faster growth although their proliferation was reduced.
Discussion
Cancer-associated fibroblasts (CAFs), a major component of cancer stromal cells that account for about 40∼50% of total cell population in cancer.6 Although glucose uptake is enhanced in CAFs, their catabolins are exported to extracellular to fuel tumor cells instead of being utilized by CAF themselves. Therefore, cell proliferation of CAFs is decreased, which is consistent with our finding. Moreover, we found that the TGF-β2 signaling downregulated cell proliferation of CAFs through activating G1/S checkpoint. In the same tumor microenvironment, TGF-β2 signaling regulates both CAFs and cancer cells. However, in cancer cells, the transcriptional corepressor ZNF451 blocks the ability of Smad3/4 to recruit p300 in response to TGF-β and dephosphorylation of the nuclear exporter RanBP3 at Ser 58 promotes the export of Smad2/3 and terminates TGF-β responses, which together overcome the TGF-β signaling-induced growth inhibition of cancer cells.23,24 Due to the importance of CAF in tumor progression, it is necessary to dissect the detail mechanism underlying the metabolic reprogramming in CAFs, and to better understand their difference between tumor cells and CAFs.
The fast growth of cancer cells requires a large amount of biomaterials for biosynthesis. Previous studies have indicated that these biomaterials not only depend on the supply of glucose and amino acids from blood, but also depend on the transport of intermediate metabolites from adjacent CAFs.19,25-27 Apparently, the metabolism in CAFs is not same as that in cancer cells, although the glycolysis is upregulated in both cancer cells and CAFs.22 Our data suggest that CAFs are more like a factory to catalyze larger molecules of nutrition into small size of intermediate metabolites, to support the fast growth of cancer cells, but not themselves, suggesting CAF may be an ideal target to improve the efficacy of tumor therapy.
Materials and methods
Reagents
Fetal bovine serum (FBS) was purchased from GEMINI. DMEM was purchased from Basal Media. FAP and FSP1 antibodies were purchased from Abcam. Anti-Ki67, anti-CDK2, anti-CDK4, anti-CyclinD3 and anti-p21 antibodies were purchased from Cell Signaling Technology (MA, USA). Anti-β-actin antibody was purchased from Santa Cruz (CA, USA). Antibodies against Rb, p-Rb or CyclinE2 were purchased from ABclonal (Shanghai, China). Anti-CDC25A and p15 INK4b antibodies were purchased from Proteintech (IL,USA). Anti-cdc25A(Phospho-Ser76) antibody was purchased from AbSci (MD,USA).
Fibroblast isolation and culture
Clinical specimens were obtained from Shanghai Ninth People's Hospital affiliated to Shanghai Jiao Tong University School of Medicine, which was approved by the Ethics Committee of Shanghai Jiao Tong University and informed consent by the patient. Both cancer-associated fibroblasts (CAFs) and Non-activated fibroblasts (NAFs) were isolated from human colon cancers (4 cases)/liver cancers (1 cases) tissue and non-cancerous colon/liver tissue 6 cm away from colon/liver cancer, respectively. After dissection, the tissues were immediately put into the cold PBS containing 1% pen/strep and transported to the laboratory on ice. All the tissues were minced and then digested with 0.1% type I collagenase and trypsin. After digestion, the tissue was filtered with a 400-mesh sieve, and the flow through was centrifuged at 1,000 x g for 10 min. Cells obtained from the pellet were cultured with DMEM containing 10% FBS for 30 minutes; The medium was changed and the adherent cells remained were fibroblasts. After three passages, the cells were collected and verified by FAP expression and the function assay.
Immunofluorescence staining
The tumors tissues were embedded in O.C.T medium (TissueTek) and frozen at −80˚C overnight. The 5 μm thick frozen sections were fixed in ice-cold 4% paraformaldehyde for 20 min. After permeabilization with 0.4% Trion-X100, the tissues were blocked with 10% goat serum in PBS for 1 hr, followed by incubation with the primary antibodies at 4°C overnight. The appropriate fluorescein-conjugated secondary antibodies were incubated for 1 hr at the next day. After washing with TBST, the slices were stained with DAPI and observed by fluorescence microscopy.
Western blot
The cells were washed with PBS and harvested and lysed on ice for 20 min in lysis buffer (Thermo Fisher Scientific, Inc.). The lysates were centrifuged at 16.000 g for 20 min at 4˚C. Protein concentration was detected using the BCA assay kit (Ding Guo Biotechnology, Shanghai, China). Proteins were separated by SDS-PAGE and transferred to NC membrane. The membrane was blocked with 5% (w/v) skimmed dry milk and then the primary antibodies were incubated overnight at 4°C at the dilutions indicated in the manufacturer's protocol.
Cologenic assay
HCT116 cells or HepG2 cells were plated in 6-well plate (150 cells/well) and cultured at 37 °C with 5% CO2 overnight. Then the culture medium was replaced with fresh medium containing 1/3 supernatant from Colon CAFs, Colon NAFs, Liver CAFs and Liver NAFs. After keeping culture for about 2 weeks until the colonies were seen, cells were fixed and stained with 1% crystal violet, and colonies containing at least 50 cells were scored.
Cell proliferation assay
Cells were seeded in 100-mm dishes at a density of 1 × 10⁵ cells/dish and were cultured in 8 ml DMEM supplemented with 10% FBS at 37 °C with 5% CO2. The cell number was counted using the Countless cell counter (Invitrogen, Grand Island, NY, USA) at the indicated time points. For the cell proliferation assay, cells were seeded in 96-well plate at a density of 2 × 10³ cells/well. Relative cell growth was analyzed at the indicated time points using a Brdu kit according to the manufacturer's instructions. The OD370 were measured on ELISA microplate reader (BioTex, USA).
Cell cycle analysis
Cells were seeded in 100-mm dishes at a density of 1 × 10⁶ cells/dish and cultured at 37 °C with 5% CO2 for 24 hr. After trypsinization and washing with PBS, the cells were fixed with pre-cooled 70% ethanol overnight at 4 °C. After washing, cells were resuspended in 500 uL of PBS containing 100 ug/mL RNase for 30 min at 37°C, and then incubated with PtdIns at a final concentration of 40 ug/ml for 15 min. Finally, the cells were analyzed using flow cytometer (BD Inc., Franklin Lakes, NJ, USA). The percentage of cells in each phase of cell cycle was calculated using the provided software.
Statistics
The student's T-test was performed using the SPSS version 16.0 statistical software package. The data are presented as the mean ± SD. All data are representative of at least 3 independent experiments. Difference was considered as statistically significant when p < 0.05.
Disclosure of potential conflicts of interest
No potential conflicts of interest were disclosed.
Funding
This study was supported by grants from the Shanghai Committee of Science and Technology (11DZ2260200), the National Science Foundation of China (81372194) (81572300) to Dr. Mi; Shanghai Municipal Science and Technology Commission of Science and Technology Innovation Action Plan Key Project (10411953400) and Shanghai Baoshan District Science and Technology Commission Project (14-E-4) to Jiangmin Zhao; and Precision Medicine Research Academy of Sciences (KJZD-EW-L14), Strategic Priority Research Program of the Chinese Academy of Sciences (XDA12020343), and National Basic Research Program of China (973 program, 2012CB518302 and 2013CB911001) to Dr. Sun.
Author contributions
J.W, and R.F. performed most of the experiments; Y.X. performed some of the experiments; J.Z. provided reagents and revised the paper; J. M. designed the project and wrote the article; all authors reviewed the manuscript.
References
- [1].Lengauer C, Kinzler KW, Vogelstein B. Genetic instabilities in human cancers. Nature 1998; 396:643-9; PMID:9872311; http://dx.doi.org/ 10.1038/25292 [DOI] [PubMed] [Google Scholar]
- [2].Ronnov-Jessen L, Petersen OW, Bissell MJ. Cellular changes involved in conversion of normal to malignant breast: importance of the stromal reaction. Physiol Rev 1996; 76:69-125; PMID:8592733 [DOI] [PubMed] [Google Scholar]
- [3].Tlsty TD. Stromal cells can contribute oncogenic signals. Semin Cancer Biol 2001; 11:97-104; PMID:11322829; http://dx.doi.org/ 10.1006/scbi.2000.0361 [DOI] [PubMed] [Google Scholar]
- [4].Carmeliet P, Jain RK. Angiogenesis in cancer and other diseases. Nature 2000; 407:249-57; PMID:11001068; http://dx.doi.org/ 10.1038/35025220 [DOI] [PubMed] [Google Scholar]
- [5].Sandler AB, Johnson DH, Herbst RS. Anti-vascular endothelial growth factor monoclonals in non-small cell lung cancer. Clin Cancer Res 2004; 10:4258s-62s; PMID:15217970; http://dx.doi.org/ 10.1158/1078-0432.CCR-040023 [DOI] [PubMed] [Google Scholar]
- [6].Xing Y, Zhao S, Zhou BP, Mi J. Metabolic reprogramming of the tumour microenvironment. Febs J 2015; 282:3892-8; PMID:26255648; http://dx.doi.org/ 10.1111/febs.13402 [DOI] [PubMed] [Google Scholar]
- [7].Bhowmick NA, Neilson EG, Moses HL. Stromal fibroblasts in cancer initiation and progression. Nature 2004; 432:332-7; PMID:15549095; http://dx.doi.org/ 10.1038/nature03096 [DOI] [PMC free article] [PubMed] [Google Scholar]
- [8].Olumi AF, Grossfeld GD, Hayward SW, Carroll PR, Tlsty TD, Cunha GR. Carcinoma-associated fibroblasts direct tumor progression of initiated human prostatic epithelium. Cancer Res 1999; 59:5002-11; PMID:10519415 [DOI] [PMC free article] [PubMed] [Google Scholar]
- [9].Dimanche-Boitrel MT, Vakaet L Jr., Pujuguet P, Chauffert B, Martin MS, Hammann A, Van Roy F, Mareel M, Martin F. In vivo and in vitro invasiveness of a rat colon-cancer cell line maintaining E-cadherin expression: an enhancing role of tumor-associated myofibroblasts. Int J Cancer 1994; 56:512-21; PMID:8112888; http://dx.doi.org/ 10.1002/ijc.2910560410 [DOI] [PubMed] [Google Scholar]
- [10].Orimo A, Gupta PB, Sgroi DC, Arenzana-Seisdedos F, Delaunay T, Naeem R, Carey VJ, Richardson AL, Weinberg RA. Stromal fibroblasts present in invasive human breast carcinomas promote tumor growth and angiogenesis through elevated SDF-1/CXCL12 secretion. Cell 2005; 121:335-48; PMID:15882617; http://dx.doi.org/ 10.1016/j.cell.2005.02.034 [DOI] [PubMed] [Google Scholar]
- [11].Grum-Schwensen B, Klingelhofer J, Berg CH, El-Naaman C, Grigorian M, Lukanidin E, Ambartsumian N. Suppression of tumor development and metastasis formation in mice lacking the S100A4(mts1) gene. Cancer Res 2005; 65:3772-80; PMID:15867373; http://dx.doi.org/ 10.1158/0008-5472.CAN-04-4510 [DOI] [PubMed] [Google Scholar]
- [12].Olaso E, Santisteban A, Bidaurrazaga J, Gressner AM, Rosenbaum J, Vidal-Vanaclocha F. Tumor-dependent activation of rodent hepatic stellate cells during experimental melanoma metastasis. Hepatology 1997; 26:634-42; PMID:9303493; http://dx.doi.org/ 10.1002/hep.510260315 [DOI] [PubMed] [Google Scholar]
- [13].Kolch W, Martiny-Baron G, Kieser A, Marme D. Regulation of the expression of the VEGF/VPS and its receptors: role in tumor angiogenesis. Breast Cancer Res Treat 1995; 36:139-55; PMID:8534863; http://dx.doi.org/ 10.1007/BF00666036 [DOI] [PubMed] [Google Scholar]
- [14].Saharinen P, Eklund L, Pulkki K, Bono P, Alitalo K. VEGF and angiopoietin signaling in tumor angiogenesis and metastasis. Trends Mol Med 2011; 17:347-62; PMID:21481637; http://dx.doi.org/ 10.1016/j.molmed.2011.01.015 [DOI] [PubMed] [Google Scholar]
- [15].Boire A, Covic L, Agarwal A, Jacques S, Sherifi S, Kuliopulos A. PAR1 is a matrix metalloprotease-1 receptor that promotes invasion and tumorigenesis of breast cancer cells. Cell 2005; 120:303-13; PMID:15707890; http://dx.doi.org/ 10.1016/j.cell.2004.12.018 [DOI] [PubMed] [Google Scholar]
- [16].Lochter A, Galosy S, Muschler J, Freedman N, Werb Z, Bissell MJ. Matrix metalloproteinase stromelysin-1 triggers a cascade of molecular alterations that leads to stable epithelial-to-mesenchymal conversion and a premalignant phenotype in mammary epithelial cells. J Cell Biol 1997; 139:1861-72; PMID:9412478; http://dx.doi.org/ 10.1083/jcb.139.7.1861 [DOI] [PMC free article] [PubMed] [Google Scholar]
- [17].Chaudhury A, Hussey GS, Ray PS, Jin G, Fox PL, Howe PH. TGF-beta-mediated phosphorylation of hnRNP E1 induces EMT via transcript-selective translational induction of Dab2 and ILEI. Nat Cell Biol 2010; 12:286-93; PMID:20154680 [DOI] [PMC free article] [PubMed] [Google Scholar]
- [18].Ding Y, Kim JK, Kim SI, Na HJ, Jun SY, Lee SJ, Choi ME. TGF-{beta}1 protects against mesangial cell apoptosis via induction of autophagy. J Biol Chem 2010; 285:37909-19; PMID:20876581; http://dx.doi.org/ 10.1074/jbc.M109.093724 [DOI] [PMC free article] [PubMed] [Google Scholar]
- [19].Bonuccelli G, Tsirigos A, Whitaker-Menezes D, Pavlides S, Pestell RG, Chiavarina B, Frank PG, Flomenberg N, Howell A, Martinez-Outschoorn UE, et al.. Ketones and lactate "fuel" tumor growth and metastasis: Evidence that epithelial cancer cells use oxidative mitochondrial metabolism. Cell Cycle 2010; 9:3506-14; PMID:20818174; http://dx.doi.org/ 10.4161/cc.9.17.12731 [DOI] [PMC free article] [PubMed] [Google Scholar]
- [20].Capparelli C, Guido C, Whitaker-Menezes D, Bonuccelli G, Balliet R, Pestell TG, Goldberg AF, Pestell RG, Howell A, Sneddon S, et al.. Autophagy and senescence in cancer-associated fibroblasts metabolically supports tumor growth and metastasis via glycolysis and ketone production. Cell Cycle 2012; 11:2285-302; PMID:22684298; http://dx.doi.org/ 10.4161/cc.20718 [DOI] [PMC free article] [PubMed] [Google Scholar]
- [21].Fiaschi T, Marini A, Giannoni E, Taddei ML, Gandellini P, De Donatis A, Lanciotti M, Serni S, Cirri P, Chiarugi P, et al.. Reciprocal metabolic reprogramming through lactate shuttle coordinately influences tumor-stroma interplay. Cancer Res 2012; 72:5130-40; PMID:22850421; http://dx.doi.org/ 10.1158/0008-5472.CAN-12-1949 [DOI] [PubMed] [Google Scholar]
- [22].Zhang D, Wang Y, Shi Z, Liu J, Sun P, Hou X, Zhang J, Zhao S, Zhou BP, Mi J. Metabolic reprogramming of cancer-associated fibroblast by IDH3α downregulation. Cell Rep 2015; 10:14. [DOI] [PubMed] [Google Scholar]
- [23].Xue J, Lin X, Chiu WT, Chen YH, Yu G, Liu M, Feng XH, Sawaya R, Medema RH, Hung MC, et al.. Sustained activation of SMAD3/SMAD4 by FOXM1 promotes TGF-beta-dependent cancer metastasis. J Clin Invest 2014; 124:564-79; PMID:24382352; http://dx.doi.org/ 10.1172/JCI71104 [DOI] [PMC free article] [PubMed] [Google Scholar]
- [24].Feng Y, Wu H, Xu Y, Zhang Z, Liu T, Lin X, Feng XH. Zinc finger protein 451 is a novel Smad corepressor in transforming growth factor-beta signaling. J Biol Chem 2014; 289:2072-83; PMID:24324267; http://dx.doi.org/ 10.1074/jbc.M113.526905 [DOI] [PMC free article] [PubMed] [Google Scholar]
- [25].Whitaker-Menezes D, Martinez-Outschoorn UE, Lin Z, Ertel A, Flomenberg N, Witkiewicz AK, Birbe RC, Howell A, Pavlides S, Gandara R, et al.. Evidence for a stromal-epithelial "lactate shuttle" in human tumors: MCT4 is a marker of oxidative stress in cancer-associated fibroblasts. Cell Cycle 2011; 10:1772-83; PMID:21558814; http://dx.doi.org/ 10.4161/cc.10.11.15659 [DOI] [PMC free article] [PubMed] [Google Scholar]
- [26].Migneco G, Whitaker-Menezes D, Chiavarina B, Castello-Cros R, Pavlides S, Pestell RG, Fatatis A, Flomenberg N, Tsirigos A, Howell A, et al.. Glycolytic cancer associated fibroblasts promote breast cancer tumor growth, without a measurable increase in angiogenesis: evidence for stromal-epithelial metabolic coupling. Cell Cycle 2010; 9:2412-22; PMID:20562527; http://dx.doi.org/ 10.4161/cc.9.12.11989 [DOI] [PubMed] [Google Scholar]
- [27].Martinez-Outschoorn UE, Prisco M, Ertel A, Tsirigos A, Lin Z, Pavlides S, Wang C, Flomenberg N, Knudsen ES, Howell A, et al.. Ketones and lactate increase cancer cell "stemness," driving recurrence, metastasis and poor clinical outcome in breast cancer: achieving personalized medicine via Metabolo-Genomics. Cell Cycle 2011; 10:1271-86; PMID:21512313; http://dx.doi.org/ 10.4161/cc.10.8.15330 [DOI] [PMC free article] [PubMed] [Google Scholar]


