

Abstract
Purpose
Network analysis has become increasingly popular in epidemiologic research, but the accuracy of data key to constructing risk networks is largely unknown. Using network data from people who use drugs (PWUD), the study examined how accurately PWUD reported their network members’ (i.e., alters’) names and ages.
Methods
Data were collected from 2008 to 2010 from 503 PWUD residing in rural Appalachia. Network ties (n=897) involved recent (past 6 months) sex, drug co-usage, and/or social support. Participants provided alters’ names, ages, and relationship-level characteristics; these data were cross-referenced to that of other participants to identify participant-participant relationships and to determine the accuracy of reported ages (years) and names (binary).
Results
Participants gave alters’ exact names and ages within two years in 75% and 79% of relationships, respectively. Accurate name was more common in relationships that were reciprocally reported and those involving social support and male alters. Age was more accurate in reciprocal ties and those characterized by kinship, sexual partnership, recruitment referral, and financial support, and less accurate for ties with older alters.
Conclusions
Most participants reported alters’ characteristics accurately, and name accuracy was not significantly different in relationships involving drug-related/sexual behavior compared to those not involving these behaviors.
Keywords: data accuracy, drug abuse, HIV, hepatitis C, intravenous drug abuse, social networks, self report, rural health
INTRODUCTION
Social network analysis (SNA) has become increasingly popular in epidemiologic research [1, 2], particularly in the study of HIV, hepatitis C (HCV), and sexually transmitted infections (STIs) [3–5]. Since the beginning of the HIV epidemic, researchers have attempted to map sexual connectivity of HIV-infected and high-risk individuals in an effort to understand, predict, and prevent transmission of HIV. Increasingly sophisticated procedures to map “risk potential networks” [6], where individuals are connected by ties that spread infection, have expanded beyond HIV research and have yielded insight into the dynamics of transmission that were previously unattainable through the analysis of individual-level behavioral data alone. Risk network analysis, a subset of SNA, contributes to the understanding of transmission [7–15] and risk behavior [7, 16, 17] and can highlight opportunities for network-based intervention [18, 19]. However, despite these contributions and network analysis’s increasing popularity, methodological challenges persist and warrant recognition.
In studies of “hard to reach” populations, such as people who use drugs (PWUD), constructing risk networks is challenging. In network studies in less sensitive contexts, participants (i.e., egos), can nominate network members (i.e., alters) from a roster of names representing all members of the target population. However, in studies of PWUD, exhaustive lists are not available and using a roster would violate participants’ privacy by disclosing their drug use. Thus, the standard protocol in network-based epidemiological research in PWUD involves asking participants to free-list the name and basic demographic information (e.g., gender, age) of their alters. Staff then cross-reference the names and characteristics of alters with those of participants to construct a sociometric network representing all direct and indirect connections among participants (i.e., to determine when two egos have named the same alter and/or when an ego has named another ego). This process, referred to as duplicate removal or entity resolution (ER), is often difficult due to discrepancies in reported demographic characteristics and names. Figure 1 provides a simplified example of the ER process and demonstrates that the accuracy of ER relies heavily on the accuracy of reported identifying characteristics, such as age and name. Thus, examining patterns in the accuracy of these reported characteristics is critical to informing more accurate sociometric network construction.
Figure 1. Hypothetical Scenario Requiring Entity Resolution.

Figure 1 provides a simplified example of the entity resolution (ER) process, with three egos (dark gray), their alters (gray), and the gender and age of each in brackets. In this example, two participants, Sam J and Esther Q, report one and two alters, respectively. To construct the sociometric network, the researcher must determine if Esther’s partner, Samuel J (age 34) is the study participant, Sam J who self-reported being age 32. The researcher must also determine if Esther’s partner, Bill Jr. F (age 36), is the study participant William Jr. F (age 36). If the researcher determines that the alters and egos meet the criteria for being considered the same individuals, the researcher resolves the duplicates as being the same entities within the network. Three different network structures (shown in the inset box) could result depending on the decisions made; as shown, these decisions rely heavily on the accuracy of the reported demographic characteristics. This illustration demonstrates the importance of reporting accuracy to conclusions drawn about the overall network structure.
Existing methodological publications on SNA focus primarily on participants’ recall of alters [20–25], consistency of network recall [20, 22, 26–31], and the impact of different network elicitation techniques on reported network size and characteristics [22, 24, 29, 30, 32–40]. However, research on the accuracy of demographic data reported by participants about their alters is scarce [27, 41–44]. HIV-related studies in Sub-Saharan Africa have found that egos reports of alters’ genders [41] and ages were fairly accurate [41, 43], though another found that women under-estimate their partner’s age [44]. The present study extends extant research by involving network data from a larger community-based sample in which egos were not specifically asked to recruit their described alters. Further, using network data from a sample of PWUD, the current analysis examined the accuracy of egos’ report of their alters’ ages and names and identified individual- and relationship-level correlates of accurate name and age reporting.
MATERIAL AND METHODS
Data for this analysis were collected during the baseline assessment of the longitudinal Social Networks among Appalachian People (SNAP) study, which examined HIV, hepatitis C, and herpes risk among 503 PWUD in Appalachia. Participants were recruited using respondent-driven sampling (RDS), in which participants were given three coupons to recruit their network members, who if enrolled in the study, were given three coupons to distribute, and so on; this process was initiated by 108 seeds (57 of whom recruited no one) and proceeded through a maximum of 14 waves (details described elsewhere [45, 46]). Once enrolled, participants completed questionnaires administered by community-based interviewers who had received training in human subjects’ research ethics. Participants were asked to provide the first names and last initials, ages, and genders of alters with whom they had sexual contact, used drugs (excluding alcohol and marijuana), and/or relied on for social support during the past 6 months. Participants could name up to eight alters for each relationship type (24 people maximum). For each name listed, egos were asked to provide additional information about each alter and his/her relationship with each alter (described below). Interviewers entered responses into computer-assisted interviewing software. The protocol was approved by the University of Kentucky Institutional Review Board, and a Certificate of Confidentiality was obtained. Participants provided written informed consent and were compensated $50 for their time.
Entity resolution
To confirm reported ties, the SNAP community-based interviewers who collected the data, assisted the data analysts with ER by comparing the names and demographic information they previously collected from participants about their network members against a list of participants’ names and demographic information (also from the interviewer-administered questionnaires). This multi-step process is shown in Figure 2. First, Microsoft’s “Fuzzy Look-up Add-in” [47] was used to cross-reference the names of reported alters (n=2,634) with those of participants (n=503) to produce possible matches based on name similarity. The algorithm produces a name similarity score (range 0 to 1), based on Jaccard similarity coefficients with built-in transformations (i.e., recognizing that ‘Bob’ may match with ‘Robert’). Using a minimum Jaccard coefficient of 0.6, the fuzzy search yielded 2,269 possible matches for 1,379 of the named alters; no match was identified for 1,255 alters. Second, interviewers reviewed and confirmed/disconfirmed (through consensus) each possible match, as well as the names without a match. Of note, the interviewers confirmed/disconfirmed relationship presence, not type (i.e., drug, sex, social support). Similar to previous research [7, 48], interviewers’ decisions were informed by whether they had ever observed the participants in question interacting in the office or in public, and also through awareness of participants’ kinship, residential proximity, and presence of mutual friends. The interviewers confirmed a total of 897 relationships between participants; representing 34% of all reported relationships (other relationships involved alters for whom no match to a study participant was identified). Of note, the interviewers were not privy to any information through ER that they did not already know from conducting the interviews. Thus, interviewers’ involvement in ER did not pose additional risks to participants’ privacy.
Figure 2. Entity resolution process involving fuzzy matching and consultation with community-based interviewers.
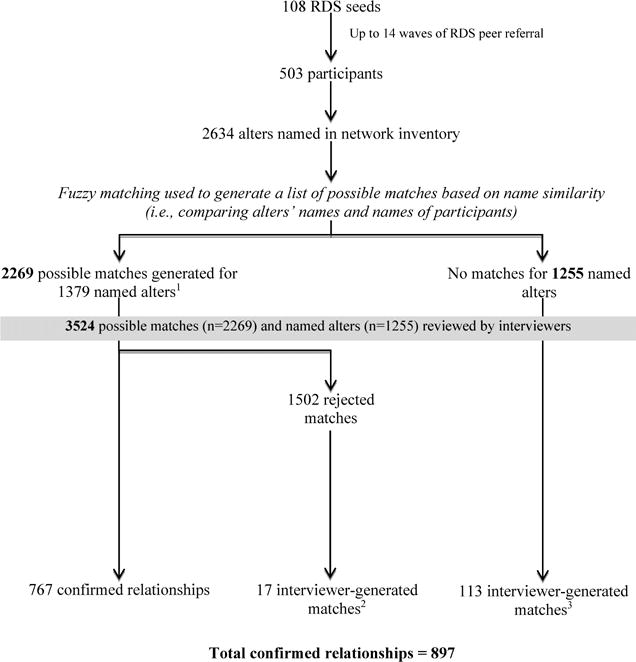
1The number of possible matches exceeds the number of named alters because some alters’ names were similar to multiple participants’ names and generated multiple possible matches.
2These were instances in which matches identified by the fuzzy matching process based on name similarity were rejected by the interviewers and the interviewers were able to identify matches manually.
3These were instances in which matches were NOT identified by the fuzzy matching process based on name similarity, but interviewers were able to identify matches manually (i.e., matches were missed by the fuzzy matching process).
The relationship between the network data and RDS referrals is shown in Figure 3. Of note, only RDS ties that could be confirmed as social network ties (209 of the 397 RDS ties) were included in this analysis because when egos did not name as a network tie the person who recruited them or whom they recruited, name and age accuracy could not be measured. The imperfect overlap between the RDS and social network ties is consistent with other research in which only a small fraction of RDS ties were also listed in the social network inventory [49].
Figure 3. Relationship between RDS peer-referral data and network data generated through interviewer-administered questionnaires.

Panel A shows an example of two RDS recruitment “chains” in which seeds (circles) recruited peers, some of whom recruited additional peers. Of note, each was eligible to recruit three peers, but some did not do so. Panel B overlays the RDS referral ties (solid lines) with relationships with network members that each participant named in their interviewer-administered questionnaires (dotted lines). Through a process called “entity resolution,” the information that individuals give about their network members is cross-referenced against characteristics of the other participants to determine when participants have named each other or named the same network member. Panel C shows situations in which named network members resemble that of other participants. These entities are resolved as duplicates in the network and a linkages among participants are made. Panel D shows the resulting network relationships used for analyses (i.e., relationships confirmed during entity resolution). As can be seen from comparing Panel D to Panel A, some but not all of the network ties involved RDS referral.
Dependent Variables: Name and Age Inaccuracy
For alters confirmed to be participants, their ages and names as reported by egos were compared with their self-reported ages and names to determine accuracy. In this analysis, two dependent variables, age inaccuracy (difference in years, continuous) and name inaccuracy (binary), were examined. An alter’s name reported by an ego was considered to be inaccurate if the ego-provided first name and last initial did not match the first name, middle name, or nickname and last initial provided by the alter about him/herself. Of note, to account for women’s maiden names, the reported last initial was considered accurate if it matched the first letter of the alter’s middle name.
Independent Variables: Relationship characteristics
Two dyadic measures of ego-alter demographic similarity were examined: gender (1=same gender, 0=different gender) and age difference in years (continuous). Three binary measures characterized relationship type in the past 6 months as drug co-usage, sex, and social support tie. For each named alter, respondents were asked the relationship duration (years), kinship (immediate and extended family relations) (binary), if they relied on him/her for financial support (binary), if they shared drugs (binary), frequency of communication (ordinal, 5-point scale), trust (10-point scale), and the shortest road-network distance (miles) between geocoded residences (computed using the network analyst extension in ArcMap 10.1 and data from the North America Detailed Streets Layer Package) [50]; on the latter three, increasing values represented more frequent communication, trust, and distance, respectively.
Analysis
A total of 897 confirmed network ties were included in dyadic analyses examining correlates to reporting accuracy; these ties involved 463 of the 503 participants, 40 participants were not involved in a relationship with another participant. Given potential autocorrelation among dyads involving the same ego, negative binomial and log binomial generalized estimating equations, which accounted for clustering by ego, were used to determine correlates to age and name inaccuracy, respectively. Crude and adjusted rate ratios (RRs and ARRs) and prevalence ratios (PRs and APRs) were estimated from the negative binomial and log binomial regressions, respectively, with 95% confidence intervals (CIs). Models were estimated using PROC GENMOD (SAS v9.4), and collinearity was assessed. Covariates reaching p<0.05 in bivariate analyses were entered into multivariate models, and those with p<0.05 after adjustment were retained to derive the most parsimonious adjusted model. RDS referral and reciprocal reporting (i.e., ties in which ego named alter and alter named ego) were not included in the final multivariate models, as they represent substantively different types of variables and are artifacts of the study’s design. Unlike the other interpersonal characteristics examined, RDS-referral is influenced by study-specific factors such as number of coupons received and available recruits [51, 52]. Similarly, reciprocal reporting may not reflect reciprocity in the nature of the relationship and could also be influenced by data reporting (e.g., participant recall, censoring, and information bias, overlap in ego-alter recall periods). The associations between age and name accuracy and RDS referral and reciprocal reporting, adjusting for other variables that were significant in bivariate analysis, were examined and are reported in the results.
RESULTS
Sample demographic and behavioral characteristics are described in detail elsewhere [53]. Briefly, the majority were white (94%), male (57%), not married (74%), high school graduates (57%) and employed (58%). Median age was 31 years (interquartile range: 26–38). Characteristics of reported relationships are described in Table 1. Of the 897 confirmed relationships, 90% involved drug co-usage and 33% involved sexual partnership. In 22% of relationships, egos reported that they injected with their alter, and in 64% of those relationships, they reported sharing injection equipment.
Table 1.
Descriptive Characteristics of Relationships (n=897)
| Characteristic | Total n (%) |
|---|---|
| Characteristics of Ego | |
| Male gender | 510 (56.9) |
| Age – median (IQR) | 31 (26 – 38) |
| Number of alters – median (IQR) | 3 (2 – 4) |
| Characteristics of Alter | |
| Male gender | 532 (59.3) |
| Age | 30 (25 – 37) |
| Ego-Alter Demographic Similarity | |
| Gender | 419 (46.7) |
| Age difference (years) – median (IQR) | 5 (2 – 10) |
| Ego-Alter Relationship Characteristics | |
| Kinship | 290 (32.3) |
| Duration (years) of relationship – median (IQR) | 10 (4 – 23) |
| Frequency of communication | |
| A few times a year or less | 14 (1.6) |
| About once a month | 19 (2.1) |
| A few times a month | 56 (6.2) |
| A few times a week | 247 (27.5) |
| Everyday | 561 (62.5) |
| Trust – median (IQR) | 8 (5 – 10) |
| Distance (miles) between residences – median (IQR) (n=837)a | 2.62 (0.17 – 7.88) |
| Receipt of any social supportb | 380 (42.4) |
| Receipt of financial supportb | 242 (27.0) |
| Risk Behavior in Relationships | |
| Drug co-usage | 806 (89.9) |
| Sex | 295 (32.9) |
| Overlap between drug co-usage and sex | |
| Drug co-usage and sex | 244 (27.2) |
| Drug co-usage, no sex | 562 (62.7) |
| Sex, no drug co-usage | 51 (5.7) |
| No sex or drug co-usage | 40 (4.5) |
| Drug sharing | 798 (89.0) |
| Inject drugs together | 197 (22.0) |
| Share injection equipment | 127 (14.2) |
| Other | |
| Reciprocally reportedc | 366 (40.8) |
| RDS referral | 305 (34.0) |
IQR: interquartile range; RDS: respondent driven sampling
Fifteen addresses were not able to be geocoded; therefore, distances between 30 pairs could not be computed.
Ego reported receipt of support from alter.
Ego named alter and alter named ego.
In 36% of relationships, alter ages were accurately reported by egos (i.e., age difference of 0 years); reported ages were within one year or two years of alters’ actual ages in 32% and 12% of relationships, respectively. The inaccuracy of reported age exceeded 5 years in only 7% of relationships. Overall, a significantly greater proportion of egos over- rather than under-estimated their alters’ ages (35% and 29%, respectively; p=0.045).
Reported ages were significantly more inaccurate in relationships reported by older egos and those involving older alters (Table 2). Ages were also more inaccurate in relationships in which the ego and alter were the same gender, had a greater age difference between them, and who communicated less frequently. Reported ages were less inaccurate in relationships involving sexual partnership, drug co-usage and sexual partnership, social or financial support, kinship, and increased trust. Of note, gender similarity was collinear with sexual partnership (97% of sexual relationships involved opposite sex partners). Because gender similarity was not significantly associated with name inaccuracy after controlling for other variables in the multivariate model, sexual partnership was used in the final multivariate models. Because the variable representing sexual partnership and the one representing sexual partnership and drug co-usage were collinear, they could not be included in the same model; therefore, two multivariate models were estimated (Models 1 and 2, Table 3) in addition to another (Model 3, Table 3) that used a combined drug/sex variable. In multivariate analyses, kinship, receipt of financial support, alter age, and age difference were significantly associated with age inaccuracy, as were sexual relationships and partnerships involving drug-co-usage and sex(compared to partnerships involving only drug co-usage or sex or neither).
Table 2.
Unadjusted Analysis of Name and Age Inaccuracy (n=897)
| Inaccurate Name | Age Inaccuracy (years) | |||
|---|---|---|---|---|
|
| ||||
| Characteristic | PR | 95% CI | RR | 95% CI |
| Characteristics of Ego | ||||
| Male gender | 1.07 | 0.85, 1.36 | 1.21 | 0.99, 1.48 |
| Age | 1.00 | 0.99, 1.02 | 1.02 | 1.01, 1.03 |
| Number of alters | 1.07 | 0.99, 1.15 | 1.03 | 0.99, 1.08 |
| Characteristics of Alter | ||||
| Male gender | 0.60 | 0.48, 0.75 | 1.16 | 0.96, 1.40 |
| Age | 1.01 | 1.00, 1.02 | 1.03 | 1.02, 1.04 |
| Ego-Alter Demographic Similarity | ||||
| Gender | 0.90 | 0.72, 1.13 | 1.35 | 1.11, 1.63 |
| Age difference (years) | 1.01 | 0.99, 1.03 | 1.04 | 1.03, 1.06 |
| Relationship Characteristics | ||||
| Kinship | 0.99 | 0.77, 1.29 | 0.67 | 0.54, 0.84 |
| Duration of relationship | 1.00 | 0.98, 1.01 | 1.00 | 0.99, 1.01 |
| Frequency of communication | ||||
| A few times a year or less | 0.55 | 0.18, 1.70 | 1.38 | 0.97, 1.97 |
| About once a month | 0.81 | 0.34, 1.92 | 2.03 | 1.27, 3.27 |
| A few times a month | 0.49 | 0.24, 0.98 | 1.59 | 1.20, 2.12 |
| A few times a week | 1.08 | 0.84, 1.40 | 1.51 | 1.23, 1.86 |
| Every day (reference) | – | – | – | – |
| Trust | 1.02 | 0.98, 1.06 | 0.96 | 0.93, 0.99 |
| Distance (miles) between residences (n=837) | 1.00 | 0.99, 1.01 | 1.01 | 1.00, 1.01 |
| Receipt of any social supporta | 0.74 | 0.58, 0.94 | 0.75 | 0.61, 0.92 |
| Receipt of financial supporta | 0.97 | 0.73, 1.29 | 0.52 | 0.40, 0.68 |
| Risk Behavior in Relationships | ||||
| Drug co-usage (ref: relationships not involving drug co-usage) | 0.91 | 0.65, 1.28 | 0.95 | 0.71, 1.27 |
| Sex (ref: relationships not involving sex) | 1.03 | 0.80, 1.31 | 0.61 | 0.48, 0.78 |
| Drug co-usage and sex (ref: relationships involving drug co-usage or sex, or neither) | 0.89 | 0.68, 1.17 | 0.58 | 0.44, 0.77 |
| Overlap between drug co-usage and sex | ||||
| Drug co-usage and sex | 1.55 | 0.73, 3.30 | 0.53 | 0.32, 0.89 |
| Drug co-usage, no sex | 1.72 | 0.82, 3.61 | 0.93 | 0.60, 1.43 |
| Sex, no drug co-usage | 2.49 | 1.09, 5.67 | 0.73 | 0.43, 1.26 |
| No sex or drug co-usage | ref | ref | ref | ref |
| Drug sharing | 1.01 | 0.73, 1.39 | 0.90 | 0.70, 1.16 |
| Inject drugs togetherb | 0.89 | 0.68, 1.18 | 0.84 | 0.64, 1.11 |
| Share injection equipmenb | 1.01 | 0.74, 1.36 | 0.75 | 0.55, 1.03 |
| Other | ||||
| Reciprocally reportedc | 0.75 | 0.58, 0.96 | 0.41 | 0.33, 0.50 |
| RDS referral | 0.85 | 0.66, 1.09 | 0.56 | 0.46, 0.68 |
PR: prevalence ratio, CI: confidence interval, RR: Rate ratio, RDS: respondent driven sampling
Ego reported receipt of support from alter
Analysis restricted to relationships in which the ego and alter had ever injected drugs (n=616).
Ego named alter and alter named ego.
Table 3.
Multivariate Analyses of Age Inaccuracy (n=897)
| Model 1 | Model 2 | Model 3 | ||||
|---|---|---|---|---|---|---|
|
| ||||||
| Characteristic | ARR | 95% CI | ARR | 95% CI | ARR | 95% CI |
| Characteristics of Alter | ||||||
| Alter age | 1.02 | 1.01, 1.03 | 1.02 | 1.01, 1.04 | 1.02 | 1.01, 1.04 |
| Ego-Alter Demographic Similarity | ||||||
| Age difference (years) | 1.04 | 1.02, 1.06 | 1.04 | 1.02, 1.06 | 1.04 | 1.02, 1.06 |
| Relationship Characteristics | ||||||
| Kinship | 0.67 | 0.55, 0.83 | 0.67 | 0.54, 0.82 | 0.67 | 0.54, 0.83 |
| Receipt of financial support | 0.63 | 0.49, 0.81 | 0.64 | 0.49, 0.82 | 0.63 | 0.49, 0.82 |
| Risk Behavior in Relationships | ||||||
| Sexa | 0.77 | 0.60, 0.98 | ||||
| Drug co-usage and sexa | 0.72 | 0.54, 0.96 | ||||
| Overlap between drug co-usage and sexa | ||||||
| Drug co-usage and sex | 0.64 | 0.36, 1.13 | ||||
| Drug co-usage, no sex | 0.88 | 0.55, 1.40 | ||||
| Sex, no drug co-usage | 0.88 | 0.49, 1.58 | ||||
| No sex or drug co-usage | ref | ref | ||||
ARR: adjusted rate ratio, CI: confidence interval
Sex was collinear with the variable representing drug co-usage and sex (83% of sexual relationships involved drug co-usage; chi-square = 684, p<0.001), and the variables could not be included in the model together. Also, the sex variable is encompassed in the 4-category drug/sex overlap variable and could not be included in the same model.
In 75% of confirmed relationships, participants accurately reported partners’ names. Of these, 82% matched on the first name, 8% on the middle name, and 10% using a nickname. As shown in Table 2, name inaccuracy was significantly less common in relationships involving male alters, those in which the alter was providing social support to the ego, and in relationships involving sex but no drug co-usage. In multivariate analyses, alter gender (APR: 0.58, CI: 0.46, 0.72, p<0.001) and social support (APR: 0.75, CI: 0.59, 0.95, p=0.019) were negatively associated with name inaccuracy; relationship type (i.e., sex, but no drug co-usage) was not associated with name inaccuracy (APR: 1.86, CI: 0.82, 4.23, p=0.136; data not shown in table), controlling for social support and alter gender.
As described above, names were more likely to be accurate for relationships involving male alters than with female alters; the likelihood of inaccurate name reporting was 40% lower when the alter was male. This association remained significant (APR: 0.58, CI: 0.46, 0.72) after adjusting for social support and relationship type. Overall, 33% of the 365 relationships involving female alters did not match on name, compared to 20% of the 532 relationships with male alters. The increased name accuracy for male alters was attributable to middle name and nickname matching, as the first name matched for similar proportions of relationships involving male and female alters (61.5% and 60.8%, respectively). Among relationships with male alters, middle name and nickname matches accounted for 11% and 12% of exact name matches, respectively, compared to 3% and 6% among relationships involving female alters.
Overall, 41% of ties were reciprocal and 34% involved RDS referral (i.e., a relationship in which ego had referred alter to the study or vice versa). Ages were less inaccurate in relationships that were reciprocally reported and involved RDS referral. Reciprocal reporting and RDS referral remained negatively associated with age inaccuracy after controlling for other variables that were significant in bivariate analyses (ARR: 0.51, CI: 0.50, 0.65, p<0.001 and ARR: 0.78, CI: 0.65, 0.95, p=0.013, respectively; data not shown in tables). As shown in Table 2, inaccurate name reporting was significantly less common in relationships that were reciprocally reported. Of note, reciprocal reporting was not significantly associated with name inaccuracy after adjusting for other variables that were significant in bivariate analyses (APR: 0.90, CI: 0.70, 1.15; data not shown in tables).
DISCUSSION
In this network-based study of rural PWUD, most participants reported the identifying characteristics of their alters accurately; in 75% of confirmed relationships, participants gave the exact name and last initial of their alter, and in 79% of relationships, participants reported the alter age within two years of their actual age. Notably, the accuracy of name and age reporting was not significantly different in relationships involving illicit behavior (i.e., drug co-usage, drug sharing, injecting drugs together, injection equipment sharing) compared to those not involving these behaviors. Further, in sexual relationships, the accuracy of age reporting was greater than in relationships not involving sex.
The accuracy of name and age reporting among PWUD in this rural Appalachian setting is striking given the stigma surrounding drug use in this region [54], as well as the illegality of the behavior and criminal justice involvement of the sample (i.e., 80% had a history of incarceration). The accuracy of the reported information may be attributable to data protections afforded by a Federal Certificate of Confidentiality, which were described to participants during the informed consent process, and to the involvement of skilled, community-based research staff, which has been noted to be critical to network data quality in similar research [26]. Additional research is needed to determine if the same degree of reporting accuracy is observed in urban and suburban settings, including those in which drug networks have lesser overlap with kinship networks.
A key finding is that reported names were significantly more accurate when a participant reported a male’s name compared to a female’s name. While understanding the sociocultural factors surrounding this phenomenon requires more research, it is worth comment that improved name matching for male alters was due largely to matching on middle names and nicknames. In total, 23% of exact name matches for male alters were due to matches on middle name or nickname compared to just 9% for female alters. Without information on participants’ middle names and nicknames, study staff may have incorrectly ruled out a sizeable proportion of ties and a different network structure may have resulted (i.e., the network may have appeared more fragmented, comparatively more male participants may have been represented as isolates). While the amount of identifying information that a study is able to collect about participants and their alters is contingent on various factors (i.e., confidentiality concerns, internal regulations, logistics), our data suggest that, when ethically appropriate, allowable, and deemed acceptable by the target population, investigators should consider asking participants for their middle names and/or nicknames and use these data during the ER process.
Finally, the data from this study demonstrate that the accuracy of key variables (i.e., name and age) used in the construction of sociometric networks can vary significantly by various individual- and relationship-level characteristics. Specifically, in multivariate analyses, age accuracy was greater in relationships involving sexual partnership, kinship, and receipt of financial support, while ages were more inaccurate in relationships involving older alters. Additionally, overestimation of age was significantly more common than underestimation, perhaps due to the impact of participants’ prolonged drug use on their physical appearance. Ages were also reported more accurately in reciprocally reported relationships and those in which ego referred alter to the study or vice versa. These findings indicate that ER algorithms imposing crude age accuracy criteria without accounting for relationship characteristics or tendency toward over-estimation may be suboptimal.
Conditional and more nuanced approaches to cross-referencing sociometric network data are needed. For example, an algorithm-driven approach to ER in the SNAP study may include criteria that have more restrictive criteria for age accuracy in relationships that involve kinship, sexual partnership, RDS referral, and those that are reciprocally reported and less stringent criteria for age accuracy with increasing alter age. Likewise, in this study, criteria for name accuracy should be more restrictive for reciprocally reported relationships and/or those involving social support. These criteria may not be optimal in other settings, as factors related to name and age accuracy likely vary depending on the target population and study site. Thus, network-based epidemiologic studies should explore individual- and dyadic characteristics associated with reporting accuracy on the key variables used in ER to fine tune and improve the efficiency of their ER algorithms.
The study’s primary limitation is its reliance on interviewer-confirmation of network ties which may be subject to information and recall biases. To gain some indication of interviewers’ accuracy, we explored the percentage of RDS referral ties (n=397, including referrals and having been referred) in which interviewers confirmed a relationship (52.6%, n=209). Among the 188 RDS ties not confirmed as social network ties, 173 involved instances in which the participant recruited or was recruited by someone whom they did not name in their network and 11 in which the match between the RDS referral/referee and network member was highly unlikely (i.e., ages were drastically different and/or last initials were incorrect). Thus, of the 397 RDS referral ties, only four could be considered “missed” by interviewer confirmation. Of note, of the four ties that were missed by interviewers, three were also missed by the Excel-based fuzzy matching algorithm used to generate a list of possible matches based on name similarity (as measured by the Jaccard similarity coefficient). This finding demonstrates the need for future research to incorporate a variety of algorithms beyond the Jaccard similarity coefficient (e.g., Levenshtein distance, Hamming distance, Soundex,). Although we acknowledge that interviewer confirmation has limitations, consultation with field staff during ER in network-based research of PWUD is common [7, 26, 48, 55] and often offers the best and most comprehensive representation of the network available for comparison. In the present study, the only other available alternative (i.e., re-contact of participants to confirm network ties) would present ethical concerns, as re-contacting participants to verify the identity of individuals they named would violate the privacy of the individual in question by revealing to the participant that the named person was a study participant and thereby a person who uses drugs.
CONCLUSION
Most participants reported their alters’ names and ages accurately. Notably, the accuracy of name and age reporting was not significantly different in relationships involving drug-related/sexual behavior vs. those not involving these behaviors. Although these findings may not be generalized to other settings, they do provide preliminary evidence that the identifying information (i.e., name and age) most often used to construct risk networks among PWUD can be accurate. These analyses also demonstrate that the accuracy of key variables used in the construction of sociometric networks can vary significantly by various individual- and relationship-level characteristics and that more sophisticated, conditional algorithms for cross-referencing sociometric network data and accounting for uncertainties in the analyses, such as those used in probabilistic record linkage [56, 57], are needed. Semi-automated tools [58] that are currently in development for ER in network data will facilitate the integration of sophisticated algorithms and permit greater analytic capabilities, such as the ability to examine how network structure is impacted by variations in ER criteria.
Acknowledgments
This work was supported by the National Institute on Drug Abuse (Grant R01 DA024598) and the pilot research grant program of the College of Public Health at the University of Kentucky. Dr. Abby Rudolph’s effort was supported by National Institute on Drug Abuse (Grant K01 DA033879). Ms. Su was supported by the University of Kentucky Professional Student Mentored Research Fellowship funded by the National Center for Advancing Translational Sciences/National Institutes of Health, through grant UL1TR000117.
ABBREVIATIONS
- APR
adjusted prevalence ratio
- ARR
adjusted rate ratio
- CI
95% confidence interval
- ER
entity resolution
- HCV
hepatitis C virus
- HIV
human immunodeficiency virus
- PR
prevalence ratio
- PWUD
people who use drugs
- RDS
respondent driven sampling
- RR
rate ratio
- SNA
social network analysis
- STI
sexually transmitted infection
Footnotes
Publisher's Disclaimer: This is a PDF file of an unedited manuscript that has been accepted for publication. As a service to our customers we are providing this early version of the manuscript. The manuscript will undergo copyediting, typesetting, and review of the resulting proof before it is published in its final citable form. Please note that during the production process errors may be discovered which could affect the content, and all legal disclaimers that apply to the journal pertain.
References
- 1.Carroll LN, Au AP, Detwiler LT, et al. Visualization and analytics tools for infectious disease epidemiology: A systematic review. Journal of Biomedical Informatics. 2014;51:287–98. doi: 10.1016/j.jbi.2014.04.006. [DOI] [PMC free article] [PubMed] [Google Scholar]
- 2.Stattner E, Vidot N. Social network analysis in epidemiology: Current trends and perspectives. Presented at Research Challenges in Information Science (RCIS), 2011 Fifth International Conference on 2011 [Google Scholar]
- 3.Doherty IA, Padian NS, Marlow C, et al. Determinants and consequences of sexual networks as they affect the spread of sexually transmitted infections. Journal of Infectious Disease. 2005;191(Suppl 1):S42–54. doi: 10.1086/425277. [DOI] [PubMed] [Google Scholar]
- 4.Friedman SR, Downing MJ, Jr, Smyrnov P, et al. Socially-integrated transdisciplinary HIV prevention. AIDS and Behavior. 2014;18(10):1821–34. doi: 10.1007/s10461-013-0643-5. [DOI] [PMC free article] [PubMed] [Google Scholar]
- 5.Sacks-Davis R, Daraganova G, Aitken C, et al. Hepatitis C virus phylogenetic clustering is associated with the social-injecting network in a cohort of people who inject drugs. PloS One. 2012:e47335. doi: 10.1371/journal.pone.0047335. [DOI] [PMC free article] [PubMed] [Google Scholar]
- 6.Friedman SR, Aral S. Social networks, risk-potential networks, health, and disease. Journal of Urban Health. 2001;78(3):411–8. doi: 10.1093/jurban/78.3.411. [DOI] [PMC free article] [PubMed] [Google Scholar]
- 7.Friedman SR, Neagius A, Jose B, et al. Sociometric Risk Networks and Risk for HIV Infection. American Journal of Public Health. 1997;87(8):1289–96. doi: 10.2105/ajph.87.8.1289. [DOI] [PMC free article] [PubMed] [Google Scholar]
- 8.De P, Cox J, Boivin J-F, et al. The importance of social networks in their association to drug equipment sharing among injection drug users: a review. Addiction. 2007;102(11):1730–9. doi: 10.1111/j.1360-0443.2007.01936.x. [DOI] [PubMed] [Google Scholar]
- 9.Rothenberg R, Sterk C, Toomey K, et al. Using social network and ethnographic tools to evaluate syphilis transmission. Sexually Transmitted Diseases. 1998;25(3):154–60. doi: 10.1097/00007435-199803000-00009. [DOI] [PubMed] [Google Scholar]
- 10.Rothenberg R, Potterat J, Woodhouse DE, et al. Social network dynamics and HIV transmission. AIDS. 1998;12(12):1529–36. doi: 10.1097/00002030-199812000-00016. [DOI] [PubMed] [Google Scholar]
- 11.Klovdahl AS, Potterat J, Woodhouse DE, et al. Social networks and infectious disease: The Colorado Springs Study. Social Science and Medicine. 1994;38(1):79–88. doi: 10.1016/0277-9536(94)90302-6. [DOI] [PubMed] [Google Scholar]
- 12.Potterat J, Rothenberg R, Muth SQ. Network structural dynamics and infectious disease propagation. International Journal of STD & AIDS. 1999;10(3):182–5. doi: 10.1258/0956462991913853. [DOI] [PubMed] [Google Scholar]
- 13.Helleringer S, Kohler H-P, Chimbiri A, et al. The Likoma Network Study: Context, data collection, and initial results. Demographic Research. 2009;21:427–68. doi: 10.4054/DemRes.2009.21.15. [DOI] [PMC free article] [PubMed] [Google Scholar]
- 14.Bearman PS, Moody J, Stovel K. Chains of Affection: The Structure of Adolescent Romantic and Sexual Networks. American Journal Of Sociology. 2004;110(1):44–91. [Google Scholar]
- 15.De P, Singh AE, Wong T, et al. Sexual network analysis of a gonorrhoea outbreak. Sexually Transmitted Infections. 2004;80(4):280–5. doi: 10.1136/sti.2003.007187. [DOI] [PMC free article] [PubMed] [Google Scholar]
- 16.Bell DC, Atkinson JS, Carlson JW. Centrality measures for disease transmission networks. Social Networks. 1999;21(1):1–21. [Google Scholar]
- 17.Rothenberg RB, Potterat JJ, Woodhouse DE, et al. Choosing a centrality measure: Epidemiologic correlates in the Colorado Springs study of social networks. Social Networks. 1995;17(3–4):273–97. [Google Scholar]
- 18.Wang K, Brown K, Shen S-Y, et al. Social network-based interventions to promote condom use: a systematic review. AIDS & Behavior. 2011;15:1298–308. doi: 10.1007/s10461-011-0020-1. [DOI] [PMC free article] [PubMed] [Google Scholar]
- 19.Neaigus A. The network approach and interventions to prevent HIV among injection drug users. Public Health Reports. 1998;113:140–50. [PMC free article] [PubMed] [Google Scholar]
- 20.Wright ER, Pescosolido BA. “Sorry, I forgot”: the role of recall error in longitudinal personal network studies. Advances in Medical Sociology. 2002;8:113–30. [Google Scholar]
- 21.Bell DC, Belli-McQueen B, Haider A. Partner naming and forgetting: recall of network members. Social Networks. 2007;29(2):279–99. doi: 10.1016/j.socnet.2006.12.004. [DOI] [PMC free article] [PubMed] [Google Scholar]
- 22.Marsden PV. Network data and measurement. Annual Review of Sociology. 1990:435–63. [Google Scholar]
- 23.Brewer DD. Forgetting in the recall-based elicitation of personal and social networks. Social Networks. 2000;22(1):29–43. [Google Scholar]
- 24.Brewer DD, Garrett SB. Evaluation of interviewing techniques to enhance recall of sexual and drug injection partners. Sexually Transmitted Diseases. 2001;28(11):666–77. doi: 10.1097/00007435-200111000-00010. [DOI] [PubMed] [Google Scholar]
- 25.Freeman LC, Romney AK, Freeman SC. Cognitive structure and informant accuracy. American Anthropologist. 1987;89(2):310–25. [Google Scholar]
- 26.Adams J, Moody J. To tell the truth: Measuring concordance in multiply reported network data. Social Networks. 2007;29(1):44–58. [Google Scholar]
- 27.White K, Watkins SC. Accuracy, stability and reciprocity in informal conversational networks in rural Kenya. Social Networks. 2000;22(4):337–55. [Google Scholar]
- 28.Hanson BS, Elmståhl S, Isacsson S-O, et al. Reliability and validity assessments of measures of social networks, social support and control—results from the Malmö Shoulder and Neck Study. Scandinavian Journal of Public Health. 1997;25(4):249–57. doi: 10.1177/140349489702500407. [DOI] [PubMed] [Google Scholar]
- 29.Hlebec V, Ferligoj A. Respondent mood and the instability of survey network measurements. Social Networks. 2001;23(2):125–40. [Google Scholar]
- 30.O’Reilly P. Methodological issues in social support and social network research. Social Science and Medicine. 1988;26(8):863–73. doi: 10.1016/0277-9536(88)90179-7. [DOI] [PubMed] [Google Scholar]
- 31.Zemljič B, Hlebec V. Reliability of measures of centrality and prominence. Social Networks. 2005;27(1):73–88. [Google Scholar]
- 32.Kogovšek T, Ferligoj A, Coenders G, et al. Estimating the reliability and validity of personal support measures: full information ML estimation with planned incomplete data. Social Networks. 2002;24(1):1–20. [Google Scholar]
- 33.Pustejovsky JE, Spillane JP. Question-order effects in social network name generators. Social Networks. 2009;31(4):221–9. [Google Scholar]
- 34.Molin E, Arentze T, Timmermans H. Eliciting social network data. Presented at international conference on survey methods in transport: harmonization and data comparability; Annecy, France. 2008. [Google Scholar]
- 35.Mikolajczyk RT, Kretzschmar M. Collecting social contact data in the context of disease transmission: prospective and retrospective study designs. Social Networks. 2008;30(2):127–35. [Google Scholar]
- 36.Marin A, Hampton KN. Simplifying the Personal Network Name Generator. Field Methods. 2007;19:163–93. [Google Scholar]
- 37.Campbell KE, Lee BA. Name generators in surveys of personal networks. Social Networks. 1991;13(3):203–21. [Google Scholar]
- 38.Conrath DW, Higgins CA, McClean RJ. A comparison of the reliability of questionnaire versus diary data. Social Networks. 1983;5(3):315–22. [Google Scholar]
- 39.Ferligoj A, Hlebec V. Evaluation of social network measurement instruments. Social Networks. 1999;21(2):111–30. [Google Scholar]
- 40.Straits BC. Ego’s important discussants or significant people: An experiment in varying the wording of personal network name generators. Social Networks. 2000;22(2):123–40. [Google Scholar]
- 41.Green HD, Hoover MA, Wagner GJ, et al. Measuring Agreement between Egos and Alters Understanding Informant Accuracy in Personal Network Studies. Field Methods. 2014;26(2):126–40. doi: 10.1177/1525822x13492676. [DOI] [PMC free article] [PubMed] [Google Scholar]
- 42.Laumann EO. Friends of urban men: An assessment of accuracy in reporting their socioeconomic attributes, mutual choice, and attitude agreement. Sociometry. 1969:54–69. [Google Scholar]
- 43.Harling G, Tanser F, Mutevedzi T, et al. Assessing the validity of respondents’ reports of their partners’ ages in a rural South African population-based cohort. BMJ open. 2015;5(3):e005638. doi: 10.1136/bmjopen-2014-005638. [DOI] [PMC free article] [PubMed] [Google Scholar]
- 44.Helleringer S, Kohler H-P, Mkandawire J. Women Under-estimate the Age of their Partners during Survey Interviews: Implications for HIV Risk associated with Age Mixing in Northern Malawi. Sexually Transmitted Diseases. 2011;38(11):1030. doi: 10.1097/OLQ.0b013e318227a486. [DOI] [PMC free article] [PubMed] [Google Scholar]
- 45.Young AM, Jonas AB, Mullins UL, et al. Network Structure and the Risk for HIV Transmission Among Rural Drug Users. AIDS and Behavior. 2012;17(7):2341–51. doi: 10.1007/s10461-012-0371-2. [DOI] [PMC free article] [PubMed] [Google Scholar]
- 46.Young AM, Rudolph AE, Quillen D, et al. Spatial, temporal and relational patterns in respondent-driven sampling: evidence from a social network study of rural drug users. Journal of epidemiology and community health. 2014;68(8):792–8. doi: 10.1136/jech-2014-203935. [DOI] [PMC free article] [PubMed] [Google Scholar]
- 47.Microsoft Excel. Fuzzy Lookup Add-In. 2011 [Google Scholar]
- 48.Weeks MR, Clair S, Borgatti SP, et al. Social networks of drug users in high-risk sites: Finding the connections. AIDS and Behavior. 2002;6(2):193–206. [Google Scholar]
- 49.McCreesh N, Frost S, Seeley J, et al. Evaluation of respondent-driven sampling. Epidemiology (Cambridge, Mass) 2012;23(1):138. doi: 10.1097/EDE.0b013e31823ac17c. [DOI] [PMC free article] [PubMed] [Google Scholar]
- 50.(ESRI) ESRI. North America Detailed Streets. Redlands, CA: 2007. (updated July 23, 2013) [Google Scholar]
- 51.Rudolph AE, Fuller CM, Latkin C. The Importance of Measuring and Accounting for Potential Biases in Respondent-Driven Samples. AIDS and Behavior. 2013:1–9. doi: 10.1007/s10461-013-0451-y. [DOI] [PMC free article] [PubMed] [Google Scholar]
- 52.Rudolph AE, Crawford ND, Latkin C, et al. Individual, study, and neighborhood level characteristics associated with peer recruitment of young illicit drug users in New York City: optimizing respondent driven sampling. Social Science and Medicine. 2011;73(7):1097–104. doi: 10.1016/j.socscimed.2011.06.040. [DOI] [PMC free article] [PubMed] [Google Scholar]
- 53.Jonas A, Young AM, Oser CB, et al. OxyContin® as currency: OxyContin® use and increased social capital among rural Appalachian drug users. Social Science and Medicine. 2012;74(10):1602–9. doi: 10.1016/j.socscimed.2011.12.053. [DOI] [PMC free article] [PubMed] [Google Scholar]
- 54.Zhang Z, Infante A, Meit M, et al. An analysis of mental health and substance abuse disparities and access to treatment services in the Appalachian region. 2008 http://www.arc.gov/assets/research_reports/AnalysisofMentalHealthandSubstanceAbuseDisparities.pdf. (Accessed December 15 2015)
- 55.Yang C, Latkin C, Muth S, et al. Injection drug users’ involvement in drug economy: dynamics of sociometric and egocentric social networks. Connections. 2013;33(1):24–34. [PMC free article] [PubMed] [Google Scholar]
- 56.Méray N, Reitsma JB, Ravelli AC, et al. Probabilistic record linkage is a valid and transparent tool to combine databases without a patient identification number. Journal of clinical epidemiology. 2007;60(9):883. e1–e11. doi: 10.1016/j.jclinepi.2006.11.021. [DOI] [PubMed] [Google Scholar]
- 57.Jaro MA. Probabilistic linkage of large public health data files. Statistics in medicine. 1995;14(5‐7):491–8. doi: 10.1002/sim.4780140510. [DOI] [PubMed] [Google Scholar]
- 58.Hopkins C, Young AM. SPIDER©: New Technology for Constructing Sociometric Networks from Personal Network Data. International Network for Social Network Analysis Sunbelt Conference; April 6, 2016; Newport Beach, California. [Google Scholar]