

Although impairments in endothelial signaling are hypothesized to reduce insulin-stimulated blood flow in type 2 diabetes (T2D), human studies examining these links are limited. We provide the first measures of nitric oxide synthase and endothelin-1 expression from skeletal muscle tissue containing native microvessels in individuals with and without T2D before and during insulin stimulation. Higher basal skeletal muscle expression of endothelin-1 and reduced endothelial nitric oxide phosphorylation (peNOS)/eNOS may contribute to reduced insulin-stimulated blood flow in obese T2D patients.
Keywords: insulin resistance, blood flow, endothelial signaling proteins
Abstract
Increased endothelin-1 (ET-1) and reduced endothelial nitric oxide phosphorylation (peNOS) are hypothesized to reduce insulin-stimulated blood flow in type 2 diabetes (T2D), but studies examining these links in humans are limited. We sought to assess basal and insulin-stimulated endothelial signaling proteins (ET-1 and peNOS) in skeletal muscle from T2D patients. Ten obese T2D [glucose disposal rate (GDR): 6.6 ± 1.6 mg·kg lean body mass (LBM)−1·min−1] and 11 lean insulin-sensitive subjects (Lean GDR: 12.9 ± 1.2 mg·kg LBM−1·min−1) underwent a hyperinsulinemic-euglycemic clamp with vastus lateralis biopsies taken before and 60 min into the clamp. Basal biopsies were also taken in 11 medication-naïve, obese, non-T2D subjects. ET-1, peNOS (Ser1177), and eNOS protein and mRNA were measured from skeletal muscle samples containing native microvessels. Femoral artery blood flow was assessed by duplex Doppler ultrasound. Insulin-stimulated blood flow was reduced in obese T2D (Lean: +50.7 ± 6.5% baseline, T2D: +20.8 ± 5.2% baseline, P < 0.05). peNOS/eNOS content was higher in Lean under basal conditions and, although not increased by insulin, remained higher in Lean during the insulin clamp than in obese T2D (P < 0.05). ET-1 mRNA and peptide were 2.25 ± 0.50- and 1.52 ± 0.11-fold higher in obese T2D compared with Lean at baseline, and ET-1 peptide remained 2.02 ± 1.9-fold elevated in obese T2D after insulin infusion (P < 0.05) but did not increase with insulin in either group (P > 0.05). Obese non-T2D subjects tended to also display elevated basal ET-1 (P = 0.06). In summary, higher basal skeletal muscle expression of ET-1 and reduced peNOS/eNOS may contribute to a reduced insulin-stimulated leg blood flow response in obese T2D patients.
NEW & NOTEWORTHY Although impairments in endothelial signaling are hypothesized to reduce insulin-stimulated blood flow in type 2 diabetes (T2D), human studies examining these links are limited. We provide the first measures of nitric oxide synthase and endothelin-1 expression from skeletal muscle tissue containing native microvessels in individuals with and without T2D before and during insulin stimulation. Higher basal skeletal muscle expression of endothelin-1 and reduced endothelial nitric oxide phosphorylation (peNOS)/eNOS may contribute to reduced insulin-stimulated blood flow in obese T2D patients.
it is estimated that one-third of the U.S. population will have diabetes by 2050 (5). A key etiological factor in type 2 diabetes (T2D) is insulin resistance, which leads to both fasting and postprandial hyperglycemia (41). Another negative outcome in T2D is the presence of vascular dysfunction (21, 26). Indeed, increasing evidence suggests that impaired vasodilation in response to insulin plays a key role in the development and progression of insulin resistance and cardiovascular disease (3, 48). We (31) and others (25) have found that individuals with T2D have a severely blunted insulin-mediated blood flow response. Although an impaired vasodilatory response to insulin has been established in T2D patients, the underlying mechanisms have not been rigorously examined.
Previous work has established that insulin-stimulated increases in blood flow play an important role in insulin-stimulated glucose uptake into skeletal muscle (20). Baron et al. (2) demonstrated that leg glucose uptake during a hyperinsulinemic-euglycemic clamp was significantly reduced (~40%) when nitro-l-arginine methyl ester (l-NAME), a nitric oxide synthase (NOS) inhibitor, was concurrently infused to reduce blood flow in healthy insulin-sensitive subjects. These data indicate that the ability of insulin to stimulate the production of nitric oxide (NO) is important for insulin-stimulated glucose disposal. Insulin phosphorylates endothelial NOS (eNOS) stimulating the production of the vasodilator NO (39). The resulting vasodilation and subsequent increase in blood flow result in enhanced delivery of glucose and insulin to skeletal muscle (9). Interestingly, further evidence suggests that insulin also increases the production and release of endothelin-1 (ET-1), a potent vasoconstrictor. In healthy, insulin-sensitive subjects, Ottosson-Seeberger et al. (36) demonstrated significant reductions in leg glucose uptake during a hyperinsulinemic-euglycemic clamp following ET-1 infusion, providing evidence that this pathway is involved in glucose control. Overall, the use of inhibitors of eNOS to block vasodilation or infusion of ET-1 to cause vasoconstriction has been shown to alter insulin-stimulated blood flow and reduce glucose uptake in healthy humans. Likewise, impaired endothelial insulin-stimulated signaling has been reported in insulin-resistant rodent models (13, 23). However, the extent to which an imbalance in the production of NO and ET-1 contributes to the reduced insulin-stimulated blood flow found in patients with T2D has not been mechanistically tested. We are unaware of in vivo studies in which endothelial nitric oxide phosphorylation (peNOS) and ET-1 expression have been measured in the skeletal muscle of T2D patients before and during hyperinsulinemia.
Thus the purpose of this study was to test the hypothesis that ET-1 content is increased and eNOS phosphorylation (Ser1177) is decreased in skeletal muscle microvasculature during insulin stimulation in obese individuals with T2D compared with healthy lean insulin-sensitive (Lean) individuals. Given that previous studies have demonstrated that individuals across the insulin sensitivity/resistance continuum (Lean, obese, and obese T2D) display a progressive impairment in insulin-stimulated blood flow responses (24), we chose to examine the broad ends of this continuum (i.e., Lean and obese T2D patients) to begin to examine potential impairments in endothelial signaling proteins in response to insulin stimulation. We reasoned that this approach would provide important mechanistic insight regarding the production of these signaling proteins in T2D, which may be responsible for decreased glucose uptake, and, as such, provide support for the vasculature as a target for therapeutic intervention in patients with T2D. Furthermore, we also compared basal levels of ET-1 and eNOS to age- and body weight-matched non-T2D obese individuals obtained from biopsy samples for a previously published study (30) from our laboratory to better understand the impact of obesity, independent of T2D, on our basal results.
METHODS
Subjects.
Protocols were approved by the University of Missouri Health Sciences Institutional Review Board and written informed consent was obtained from all subjects. We recruited 21 individuals to complete this study [11 Lean individuals (4 females/7 males) and 10 obese T2D patients (7 females/3 males)]. T2D patients had a clinical diagnosis of T2D and all subjects completed a medical health history questionnaire and a 12-h fasting blood chemistry screening including a lipid panel and a metabolic panel that included insulin and glucose measurements. Additionally, muscle samples from obese-non-T2D individuals were also assessed (n = 11; 6 females/5 males). Subject characteristics are provided in Table 1. Exclusion criteria included smoking, multiple daily injections of insulin (once daily insulin was allowed), recent weight gain or loss (>5% of body weight in 3 mo), recent (<3 mo) changes in medication use or dose, uncontrolled T2D (HbA1c > 10%), advanced retinopathy or neuropathy, pregnancy, known cardiovascular or pulmonary disease, consumption of >14 alcoholic beverages per week (34a) (Lean: 1.38 ± 0.83 and T2D: 0.8 ± 0.4 drinks/week), and individuals on prescription anticoagulants.
Table 1.
Subject characteristics
| Baseline Subject Characteristics | Lean | Obese | Obese T2D |
|---|---|---|---|
| Age, yr | 28 ± 1.5 | 55 ± 1.3* | 55 ± 1.7* |
| BMI, kg/m2 | 25.3 ± 1.1 | 34.8 ± 1.4* | 36.5 ± 1.3* |
| Body fat, % | 25.3 ± 2.1 | 38.9 ± 1.8* | 41.3 ± 2.2* |
| GDR, mg·kg LBM−1·min−1 | 12.9 ± 1.2 | 6.6 ± 1.6* | |
| HOMA IR | 1.9 ± 0.4 | 3.1 ± 0.6 | 10.1 ± 2.6*† |
| Glucose, mg/dl | 85 ± 2.5 | 94 ± 2.6 | 135 ± 5.8*† |
| Insulin, µIU/ml | 8.3 ± 1.8 | 13.2 ± 2.5 | 30.3 ± 6.6 |
| Triglycerides, mg/dl | 72 ± 5.6 | 149 ± 27.0* | 135 ± 16.2* |
| Total cholesterol, mg/dl | 167 ± 12.7 | 215 ± 11.1* | 147 ± 10.4† |
Values are mean ± SE. T2D; type 2 diabetes; BMI, body mass index; GDR, glucose disposal rate; LBM, lean body mass; HOMA-IR, homeostatic model assessment of insulin resistance.
P < 0.05 from Lean.
P < 0.05 from obese.
Experimental procedures.
Body composition was assessed via dual X-ray absorptiometry (QDR-4500A; Hologic, Shelby Township, MI) before the study visit. Subjects were asked to refrain from vigorous physical activity and alcohol for 24 h before the study visit. Twelve hours before the study visit subjects refrained from food and drink (other than water). The morning of the study, the subjects refrained from taking all medications until after the study visit was over.
Upon arrival to the laboratory, weight and height were measured. Subjects then rested in a supine position while intravenous catheters were inserted in a hand and antecubital vein for blood draws and glucose and insulin infusion, respectively. The lower portion of the arm used to obtain blood draws was placed in a warming box for arterialization of hand vein blood samples (54). After resting quietly for >20 min, baseline blood samples were obtained for the analysis of insulin and glucose. A muscle sample from the vastus lateralis was then taken using a Bergstrom needle and standard biopsy techniques as previously described by our laboratory (30). Briefly, ~60 to 120 mg of skeletal muscle tissue, and associated microvessels perfusing the muscle, were taken from the vastus lateralis. Connective and adipose tissues were removed from the muscle sample and the samples were snap frozen in liquid nitrogen and stored at −80°C until analyzed. After another 30-min rest, a hyperinsulinemic-euglycemic clamp (40 µU·m−2·min−1) was started (60), with blood glucose samples taken every 5 min for the determination of glucose infusion rate. Furthermore, every 30 min blood was drawn into serum separator tubes, spun, and stored at −80̊ C for later insulin and glucose analysis. Given the range of insulin sensitivities, some individuals took longer to obtain a steady glucose infusion rate, which lead to a 2- to 3-h range of the insulin clamps. Common femoral artery blood flow was measured via duplex Doppler ultrasound (Logiq P5; GE Medical Systems, Milwaukee, WI) at baseline, ~20 min after the baseline muscle biopsy, and at minute 45 of the insulin clamp using a 11-MHz linear array transducer as previously described by our laboratory (31, 43, 52). Blood flow (ml/min) was calculated as: blood flow = π × (diameter/2)2 × Vmean × 60, where Vmean = mean velocity. Sixty minutes into the hyperinsulinemic-euglycemic clamp, a second muscle biopsy was taken as described above. Glucose disposal rate was calculated during the last 45 min of the hyperinsulinemic-euglycemic clamp. A hyperinsulinemic-euglycemic clamp was not performed in one obese T2D due to an inability to obtain intravenous access and blood flow was not measured in one subject due to technical difficulties. Furthermore, due to issues related to blood pressure cuff interference with the intravenous access, blood pressure at baseline and minute 45 of the hyperinsulinemic-euglycemic clamp was only collected in five Lean and four obese T2D subjects.
Tissue analysis.
Skeletal muscle tissue containing native microvessels was assessed for eNOS, peNOS, AKT, and pAKT protein and ET-1 peptide via standard Western blotting procedures as performed previously (32). Additional muscle samples from non-T2D obese subjects were also assessed for ET-1 and eNOS under basal conditions and compared with the Lean samples and obese T2D samples. eNOS is not expressed in skeletal muscle (10, 46), and thus any protein content that was measured would be from microvessels only. Furthermore, to date, no studies have confirmed that ET-1 is produced from skeletal muscle (18). In contrast, AKT is in muscle tissue and microvessels. eNOS and peNOS antibodies were purchased from BD Transduction (cat. no. 610296 and 612392, respectively) and ET-1 from Sigma-Aldrich (cat. no. e166). Briefly, 20 µg of protein homogenate (2 µg/µl) were loaded on 7.5% (eNOS/peNOS and AKT/pAKT) and 15% (ET-1) gels and transferred to membrane. After blocking for an hour in 5% nonfat milk, membranes were incubated overnight in 5% BSA and the respective primary antibody (1:1,000). Following the overnight incubation samples were incubated in 5% milk and their respective secondary antibodies (1:5,000) for 1 h and imaged. A total protein stain was used for the loading control as performed previously (1). The blots were stained with 0.1% Napthol blue black bioreagent (Sigma-Aldrich) and washed in 10% acetic acid. Total band intensity for each lane (not including the band of interest) was then used as the loading control for each lane. Importantly, we have tested other ET-1 antibodies from other sources and although they showed bands at the correct molecular mass, they also had nonspecific bands. However, the ET-1 antibody from Sigma that we utilized showed a clear band at the correct molecular mass range of 24–30 kDa.
Skeletal muscle tissue containing native microvessels was also assessed for NOS3 (eNOS) and pre-pro ET-1 mRNA expression via real-time PCR as previously described (16, 37). Briefly, frozen skeletal muscle samples were homogenized in TRIzol solution using a tissue homogenizer (TissueLyser LT; Qiagen, Valencia, CA). The Qiagen’s RNeasy tissue protocol was used to isolate total RNA. Samples were Nanodroped (Thermo Scientific, Wilmington, DE) to determine RNA concentration and purity. Total RNA was made into first-strand cDNA via the High Capacity cDNA Reverse Transcription kit (Applied Biosystems, Carlsbad, CA). The ABI StepOne Plus sequence detection system (Applied Biosystems) was used to run quantitative real-time PCR with primer sequences developed from the NCBI Primer Design tool and purchased from IDT (Coralville, IA). The primer sequences were as follows: ET-1: sense 5′-CAGAAACAGCAGTCTTAGGCG-3′, antisense 5′-GGTGGCAGAAGTAGACACACT-3′; NOS3: sense 5′-ATCCCCCGGAGAATGGAGAG-3′, antisense 5′-AGTGGGTCTGAGCAGGAGAT-3′; and 18S: sense 5′-ATACAGCCAGGTCCTAGCCA-3′, antisense 5′-AAGTGACGCAGCCCTCTATG-3′. A 20-μl reaction mixture containing 10 μl iTaq UniverSYBR Green SMX (Bio-Rad, Hercules, CA) and the appropriate concentrations of gene-specific primers plus 4 μl of cDNA template were loaded in a 96-well plate. Samples were run in duplicate as described: 95°C for 10 min, followed by 40 cycles of 95°C for 15 s and 60°C for 45 s. The specificity of PCR primers was verified by a dissociation melt curve. 18S was used as housekeeping control gene. 18S cycle threshold (CT) was not different between the groups and between basal and insulin stimulation conditions. mRNA expression values are presented as 2ΔCT · ΔCT = 18S CT − gene of interest CT. mRNA levels were normalized to the Lean group under basal conditions. Due to lack of sample, insulin-stimulated skeletal muscle eNOS and ET-1 mRNA were not analyzed in three Lean subjects.
Blood analysis.
Serum samples during the hyperinsulinemic-euglycemic clamp were analyzed for glucose via the glucose oxidase method and insulin via enzyme-linked immunosorbent assays (Immulite 1000 Analyzer; Siemens, Deerfield, IL) as performed previously (31).
Statistical analysis.
A power analysis was performed on preliminary data generated from our laboratory on peak blood flow responses during the insulin clamp in sedentary individuals with T2D compared with healthy controls. The analysis was conducted with β = 0.20 m, power = 0.8, and α = 0.08. From the power analysis it was determined that eight subjects would allow us to reach statistical significance for insulin-stimulated blood flow responses. However, there is a lack of data on endothelial signaling proteins in T2D humans during an insulin clamp, which alludes to the novel nature of this study. Thus we also increased our sample size (11 lean and 10 obese T2D) to account for this discrepancy.
Glucose disposal rate, percent change in blood flow from baseline to minute 45 of the clamp, body mass index (BMI), percent body fat, age, fasting glucose, total cholesterol, triglycerides, and homeostatic model assessment of insulin resistance (HOMA-IR) between the Lean individuals and obese T2D individuals were assessed by unpaired Student’s t-tests. A two-way group × time repeated-measures ANOVA was used to assess eNOS, peNOS/eNOS, AKT, pAKT/AKT protein and eNOS, and ET-1 mRNA expression from basal to 60 min of insulin stimulation in the Lean individuals and obese T2D individuals. A one-way ANOVA was used to assess basal levels of eNOS, peNOS/eNOS, AKT, and pAKT/AKT protein among the Lean individuals, obese individuals, and obese T2D individuals. Sex was not considered a factor in the statistical analysis of the data. Data are presented as means ± SE. Statistical significance was accepted at α of P < 0.05.
RESULTS
Subject characteristics are displayed in Table 1. Subject medications are listed in Table 2.
Table 2.
Subject medications
| Lean | Obese | Obese T2D | |
|---|---|---|---|
| Antidiabetic medications, n | |||
| Biguanide | 0 | 0 | 10 |
| Sulfonylurea | 0 | 0 | 2 |
| Insulin | 0 | 0 | 1 |
| Cardiovascular medications, n | |||
| β-Blocker | 0 | 0 | 3 |
| ACE inhibitor | 0 | 0 | 8 |
| Calcium channel blocker | 0 | 0 | 1 |
| Diuretic | 0 | 0 | 4 |
| Statin | 0 | 0 | 6 |
| Fenofibrate | 0 | 0 | 1 |
| Others, n | |||
| Levothyroxine | 0 | 0 | 3 |
Values (n) are no. of subjects. T2D, type 2 diabetes; ACE, angiotensin-converting enzyme.
Glucose homeostasis: insulin sensitivity.
Fasting blood glucose and HOMA-IR were significantly higher in obese T2D individuals compared with Lean individuals and obese non-T2D subjects (Table 1, P < 0.001). Glucose and insulin levels during the hyperinsulinemic-euglycemic clamp were higher in the obese T2D individuals compared with the Lean individuals (Fig. 1, A and B, P < 0.001 and P = 0.04, respectively), an effect that occurs, in part, because of higher initial glycemia and insulin levels and decreased clearance of both in the T2D condition. Glucose disposal rate during the hyperinsulinemic-euglycemic clamp was also significantly lower in the obese T2D individuals compared with the Lean individuals, as expected (Table 1, P = 0.007).
Fig. 1.

Serum glucose (A) and insulin (B) levels during the hyperinsulinemic-euglycemic clamp in Lean individuals and obese individuals with type 2 diabetes (T2D). Percent change in femoral artery blood flow from basal to 45 min of insulin stimulation in the Lean individuals and obese individuals with T2D (C). Black circles represent the Lean individuals and the open circles represent the obese T2D individuals. All samples were derived at the same time and processed in parallel. Values are means ± SE. *P < 0.05 from Lean.
Femoral artery blood flow.
Baseline blood flow before and ~15–20 min following the muscle biopsy was found to be unchanged in Lean individuals and obese T2D individuals (Lean: pre: 252.3 ± 20.9, post: 299.4 ± 23.9 ml/min, P = 0.2; obese T2D: pre: 264.9 ± 40.0, post: 261.2 ± 41.9 ml/min, P = 0.9). There was a significant effect of insulin to increase blood flow within each group (P < 0.001) with the percent change in femoral artery blood flow from baseline to 45 min of the hyperinsulinemic-euglycemic clamp greater in the Lean individuals compared with the obese T2D individuals (Fig. 1C, P = 0.004). Mean arterial pressure during the hyperinsulinemic-euglycemic clamp was not altered (T2D: baseline: 96 ± 5 vs. clamp: 96 ± 4, P = 0.94; Lean: baseline: 83 ± 4 vs. clamp: 84 ± 5 mmHg, P = 0.91); however, obese T2D had higher basal blood pressure than the Lean (P = 0.05). Femoral artery diameter was unchanged during the hyperinsulinemic-euglycemic clamp and was not different between the Lean individuals and obese T2D individuals (Lean: baseline: 0.88 ± 0.8 vs. clamp: 0.90 ± 0.8 cm, P = 0.69; T2D: baseline: 0.78 ± 0.1 vs. clamp: 0.77 ± 0.1 cm, P = 0.95).
Skeletal muscle tissue analysis.
There was a significant main effect for the obese T2D group to have higher ET-1 peptide (Fig. 2E, P < 0.001) and pre-pro ET-1 mRNA (Fig. 3B, P = 0.04) compared with the Lean group. No effect of insulin (ET-1 peptide, P = 0.242; ET-1 mRNA, P = 0.207) or interaction (ET-1 peptide, P = 0.180; ET-1 mRNA, P = 0.215) was found between the two groups and, as such, ET-1 remained higher in the obese T2D group during the hyperinsulinemic-euglycemic clamp. No significant differences were demonstrated in NOS3 mRNA (Fig. 3A) between Lean individuals or obese T2D individuals (P = 0.193); however there was a main effect for the obese T2D group to have higher eNOS (Fig. 2C, P = 0.026) but lower peNOS/eNOS (Fig. 2D, P = 0.003) protein compared with the Lean individuals. No main effect of insulin (P = 0.664) or interaction (P = 0.357) was demonstrated between the two groups such that peNOS/eNOS remained lower in the obese T2D group during the hyperinsulinemic-euglycemic clamp.
Fig. 2.

Protein kinase B (AKT; A), phosphorylation of AKT (pAKT; B), endothelial nitric oxide synthase (eNOS; C), phosphorylation of eNOS (peNOS) (D), and endothelin-1 (ET-1) (E) peptide at basal and following 60 min of insulin stimulation in the Lean individuals and obese individuals with type 2 diabetes (T2D). Representative blots are shown for each protein measured (F). Black bars represent the Lean individuals and open bars represent the obese T2D individuals. All samples were derived at the same time and processed in parallel. Values are means ± SE; a.u., arbitrary units.
Fig. 3.
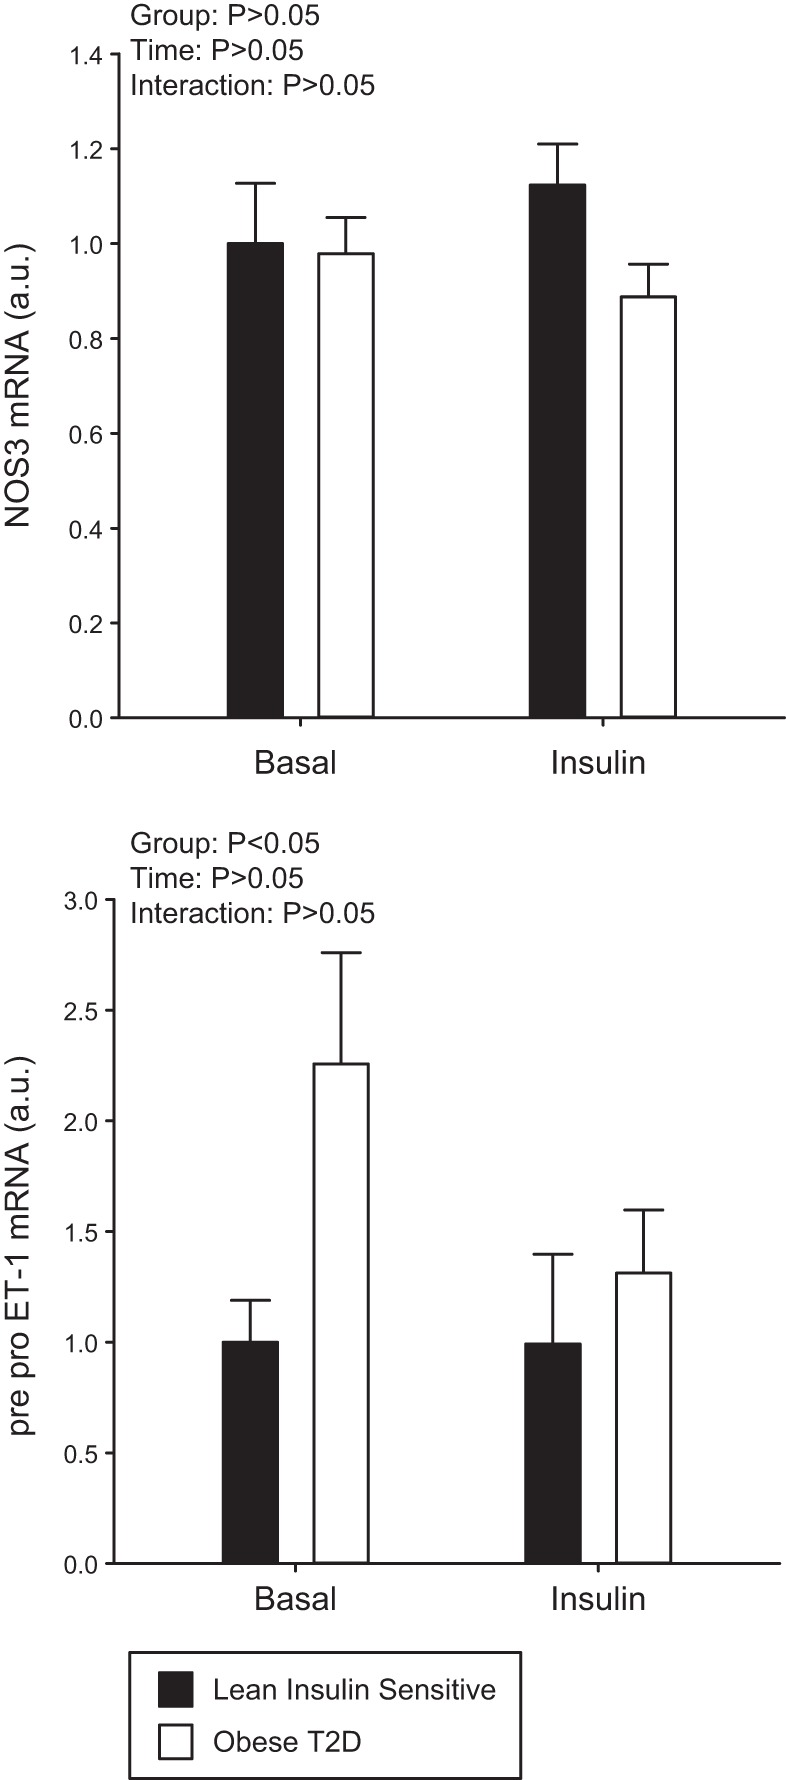
NOS3 mRNA expression (A) and pre-pro endothelin-1 (ET-1) mRNA expression (B) at basal and following 60 min of insulin stimulation in the Lean individuals and obese individuals with type 2 diabetes (T2D). Black bars represent the Lean individuals and open bars represent the obese T2D individuals. All samples were derived at the same time and processed in parallel. Values are means ± SE.
There was a main effect for the obese T2D group to have a slightly higher total AKT (Fig. 2A, P = 0.05). No main effect of insulin (P = 0.294) or interaction (P = 0.847) on total AKT was demonstrated between the two groups. While both the Lean individuals and the obese T2D individuals had an increase in pAKT/AKT (Fig. 2B, P < 0.001) to insulin stimulation, pAKT/AKT increased to a greater extent in the Lean individuals (P = 0.004) confirming reduced insulin signaling in skeletal muscle of obese T2D subjects compared with Lean.
Because we observed basal, non-insulin-stimulated differences in endothelial signaling proteins between the Lean individuals and obese T2D individuals, we also selected skeletal muscle biopsy samples from a previously published study (30) from 11 obese non-T2D subjects who were age and BMI matched to the obese T2D in this investigation to determine the specific role of T2D independent of obesity alone. The characteristics of the obese-non-T2D individuals are presented in Table 1. No significant basal differences existed between Lean individuals, obese individuals, and obese T2D individuals in AKT (Fig. 4A, P = 0.388), pAKT/AKT (Fig. 4B, P = 0.670), or eNOS (Fig. 4C, P = 0.288) protein. However, peNOS/eNOS (Fig. 4E) protein trended (P = 0.054) to be significantly different among the three groups. There was also a trend for statistical significance for ET-1 peptide content to be elevated in the obese individuals and obese T2D individuals compared with Lean individuals (Fig. 4D, P = 0.064).
Fig. 4.

Protein kinase B (AKT; A), phosphorylation of AKT (pAKT; B), endothelial nitric oxide synthase (eNOS; C), phosphorylation of eNOS (peNOS; D), and endothelin-1 (ET-1; E) at rest in the Lean individuals, obese type 2 diabetes (T2D) individuals, and obese individuals without T2D. Representative blots for each protein measured (F). All samples were derived at the same time and processed in parallel. Values are means ± SE.
Insulin sensitivity and ET-1 expression correlations.
The glucose disposal rate was not significantly correlated to ET-1 peptide or mRNA (r = −0.240, P = 0.2 and r = −0.335, P = 0.4, respectively). Also, HOMA-IR was not correlated to ET-1 peptide or mRNA (r = −0.08, P = 0.7 and r = −0.22, P = 0.3, respectively). However, fasting blood glucose trended to be significantly correlated to ET-1 peptide (r = 0.374, P = 0.09) and was significantly correlated to ET-1 mRNA (r = 0.518, P = 0.02).
DISCUSSION
Insulin stimulation did not alter skeletal muscle peNOS/eNOS, eNOS, or ET-1 peptide content or mRNA expression in either Lean individuals or obese T2D individuals, despite the Lean showing a greater than 50% higher insulin-stimulated blood flow and an approximately twofold higher pAKT/AKT signaling than the obese T2D. The obese T2D individuals displayed significantly higher basal protein content and gene expression of the potent vasoconstrictor ET-1 and lower peNOS/eNOS protein expression, compared with the Lean individuals. Overall, these results indicate that 1 h of hyperinsulinemia with insulin levels similar to those of postprandial concentrations (31, 43) does not significantly alter eNOS or ET-1 expression in Lean individuals or obese T2D individuals. However, higher basal levels of ET-1 and reduced peNOS/eNOS may contribute to a reduced insulin-stimulated blood flow response in obese T2D patients.
Contrary to our hypothesis, 60 min of insulin stimulation caused no significant changes in peNOS/eNOS or ET-1 expression in the skeletal muscle homogenate of either the Lean or obese T2D. This occurred despite increased pAKT in the muscle at this same time in both groups. Cell culture studies of human umbilical endothelial artery cells and bovine aortic endothelial cells have shown significant increases in peNOS (56) and ET-1 mRNA expression (35) following 30 and 60 min of insulin stimulation. Since prior research demonstrated increases in leg blood flow to insulin stimulation or glucose ingestion at 45–60 min (31), we had speculated that peNOS/eNOS and ET-1 expression in the present study would also be elevated or altered at this time and would show differential responses between Lean individuals and obese T2D. However, this was not found. Nevertheless, it should be mentioned that there was a trend for ET-1 peptide to increase following insulin stimulation in the T2D condition, but this was not statistically significant (P = 0.18) and future studies are necessary to confirm this. Moreover, ET-1 mRNA did not increase following insulin stimulation in the T2D suggesting that there was no increase in the transcription of ET-1 with insulin.
Our findings of a lack of insulin-stimulated activation of peNOS or changes in ET-1 may be different than previous studies for several reasons. First, the insulin levels used in the previous cell culture studies were supraphysiological and likely provided a greater stimulus for increased peNOS and ET-1 expression than the postprandial levels used in the current study. Furthermore, other cell culture data support that peNOS is increased within 5 min of insulin stimulation (42), so it is possible in the present study that peNOS increased acutely to insulin stimulation and then returned toward basal levels following prolonged stimulation. There is also some evidence that supports that prolonged agonist exposure leads to inactivation of eNOS (12, 29). However, whether this occurs with prolonged insulin stimulation and/or the time course by which eNOS is inactivated is not known. Protein phosphatase 2A (PP2A) regulates the dephosphorylation of Ser 1177 on eNOS, which would inactivate eNOS (12), but we are not aware of any time-course studies examining the activity of PP2A to insulin stimulation. Future studies need to examine the in vivo time course of peNOS activation and activation of inhibitors of eNOS to determine how these are altered with prolonged insulin stimulation at postprandial concentrations.
While we and others demonstrate an increase in leg blood flow following 45–60 min of insulin stimulation (31), others report a more variable time of maximal blood flow responses (8, 24). This may be due to differences in insulin sensitivities, insulin dose and concentration, and duration of exposure. Individuals with insulin resistance have greater plasma insulin responses to meals, which also remain elevated for a longer period of time following a meal when compared with lean insulin-sensitive individuals. Thus blood flow (and endothelial signaling proteins) between the Lean and the obese T2D individuals may be altered differently following longer periods of insulin stimulation than the 1 h used in the present study. Indeed, previous reports by Kashyap et al. (17) demonstrate in non-T2D subjects that significant increases in eNOS expression are induced following 4 h of insulin stimulation, while this duration of insulin infusion did not change eNOS in T2D subjects. However, in vitro studies in endothelial cells indicate that insulin-stimulated eNOS phosphorylation occurs at the onset of insulin exposure (42) and this is rapidly changed back to basal levels through a putative feedback control system (12, 29). We measured eNOS and ET-1 in the microvessels of skeletal muscle biopsies at 1 h, a time point when our preliminary studies demonstrated that insulin infusion caused a significant increase in blood flow compared with baseline. However, eNOS phosphorylation was not increased with 1 h of insulin infusion. Given the already previously mentioned findings, it is possible that either a shorter or longer duration of insulin infusions would have revealed a significant change in peNOS in either of the groups. Future studies need to address this.
In the present study, obese T2D individuals had significantly elevated basal eNOS protein content compared with the Lean individuals but the obese T2D individuals did not express greater peNOS. This is in contrast to previous reports comparing weight matched controls to T2D patients that reported decreased (53) and no differences in basal eNOS (17) expression in T2D patients. The greater elevations of eNOS protein content in the obese T2D individuals in the present study may be due in part to chronic greater basal and postprandial insulin concentrations, a stimulus known to increase eNOS content (22). Thus it is possible that the elevation in eNOS in obese T2D is a compensatory mechanism to sustain similar amounts of peNOS compared with non-T2D individuals. Aged rodents (55) and humans (11) also display increased eNOS expression, which is postulated to counter the reduced NO bioavailability and NO-mediated vasodilation shown in aged population; thus it is possible the same phenomenon occurs with obesity and T2D.
As previously stated, a key finding was that the obese T2D showed significantly higher basal peptide content of the potent vasoconstrictor ET-1 than the Lean subjects. Likewise, previous studies have demonstrated elevated basal plasma levels of ET-1 in individuals with T2D compared with controls (45). Since ~80% of endothelin-1 is secreted on the abluminal side and putatively signals locally through a paracrine fashion (58), plasma ET-1 is not considered the best marker of cellular levels of endothelial ET-1 concentrations. Thus, in this regard, direct measures of ET-1 in the vasculature of skeletal muscle homogenate provide an advantage over blood samples. Importantly, previous studies have demonstrated that ET-1 blockade significantly increased blood flow to a greater extent in individuals with T2D compared with non-T2D individuals (27, 28, 47, 50), suggesting that individuals with T2D have greater ET-1-mediated basal vasoconstrictor tone. These studies, and others (7, 40, 44, 51), demonstrate the important role of obesity and insulin resistance in altering ET-1-mediated vasoconstriction. Therefore, the greater basal ET-1 content found in this study and associated vasoconstriction, combined with previous inhibitor studies, suggest that elevated ET-1 may partially explain the blunted insulin-stimulated blood flow response in the obese T2D individuals.
Since we demonstrated significant elevations in basal levels of ET-1 and eNOS in the obese T2D compared with the Lean individuals, we were interested in understanding if these effects were due to the pathology of T2D or were caused by the obese state or age differences in our Lean subjects and obese T2D subjects. Thus we examined ET-1 peptide from skeletal muscle biopsy samples collected from a previously published paper (30) in subjects that were age and BMI matched to the obese T2D subjects in the current study. These data showed that obese and obese T2D have similar ET-1 peptide levels, alluding to the possibility that elevated ET-1 levels in the vasculature occur during the obese state and preclude the development of T2D. Similarly, Kim et al. (19) showed that high-fat-fed, obese mice displayed insulin resistance in the vasculature before skeletal muscle, liver, or adipose tissue, suggesting that impairments in the vasculature occur early in the development of insulin resistance. Furthermore, work from our group (33) has demonstrated that sedentary obese, insulin-resistant OLETF rats, before the development of T2D, have greater insulin-stimulated vasodilation to ET-1 blockade compared with their sedentary insulin-sensitive counterparts, providing further evidence that upregulation of ET-1 occurs early in the progression of insulin resistance and likely before T2D.
Obesity has been shown to result in increased ET-1 peptide and pre-pro ET-1 gene expression (4, 34, 57). Thus, it is likely that obesity (and hyperglycemia) are both driving the trend for higher ET-1 expression in the obese and obese T2D compared with Lean. ET-1 expression increases in endothelial cells exposed to hyperglycemic conditions (14, 59). Correlational analysis revealed that fasting blood glucose was significantly correlated to ET-1 mRNA and trended to be correlated to ET-1 peptide, further suggesting a link between glucose and ET-1 expression. Given that the obese T2D individuals were on antidiabetic medications to treat hyperglycemia, ET-1 expression may be reduced compared with an obese T2D that is not treated. Insulin also increases ET-1 via MAPK-mediated pathways (15, 38). Thus chronic fasting hyperinsulinemia is likely another important contributor of the increased basal ET-1 in obese T2D compared with Lean subjects; however, as already stated, we did not see evidence that acute insulin stimulation increases ET-1 mRNA or peptide in either subject group.
To summarize, we demonstrated for the first time in humans that skeletal muscle phosphorylation of eNOS does not significantly increase following 1 h of postprandial levels of insulin in either Lean individuals or obese T2D individuals. However, significant increases in peNOS/eNOS were found in Lean individuals compared with obese T2D individuals in the basal, non-insulin-stimulated state. Furthermore, basal, non-insulin-stimulated levels of ET-1 were elevated in obese T2D individuals but were not altered with 60 min of insulin stimulation. Additionally, we provide evidence that elevated ET-1 peptide may occur in obesity before the development of T2D. While sex differences were not analyzed in the present study due a low sample size, future studies should investigate whether sex-specific differences played a role in these findings. Furthermore, given that our Lean subjects were younger than our obese and obese T2D subjects, future studies should examine the impact of aging on these parameters.
In conclusion, the blunted leg blood flow response following 60 min of hyperinsulinemia in obese T2D individuals in the present study is not due to impaired production/activation of eNOS and ET-1 to insulin stimulation but may be due to chronically higher basal levels of ET-1 content and expression and reduced peNOS/eNOS present at rest in T2D.
GRANTS
This work was supported by an American Heart Association (AHA) Grant in Aid (20160072 to P. J. Fadel) and a Mizzou Advantage Grant (to P. J. Fadel). J. P. Thyfault was partially supported by National Institutes of Health Grant R01-DK-088940. D. P. Credeur was supported by NIH Grant T32-AR-048523. L. J. Reynolds was supported by an ACSM Foundation Research Grant from the American College of Sports Medicine Foundation and an AHA Pre-Doctoral Fellowship (12PRE12080242). J. Padilla was supported by NIH Grants R21-DK-105368 and K01-HL-125503. C. Manrique was supported by NIH Grant 1K08-HL-129074–01.
DISCLOSURES
No conflicts of interest, financial or otherwise, are declared by the author(s).
AUTHOR CONTRIBUTIONS
L.J.R, P.J.F., and J.P.T. conception and design of research; L.J.R., D.P.C., C.M.M., and J.P.T. performed experiments; L.J.R., D.P.C., and J.P. analyzed data; L.J.R., D.P.C., J.P., C.M.M., P.J.F., and J.P.T. interpreted results of experiment; L.J.R, prepared figures; L.J.R. drafted manuscript; L.J.R., D.P.C., J.P., C.M.M., P.J.F., and J.P.T. edited and revised manuscript; L.J.R., D.P.C., J.P., C.M.M., P.J.F., and J.P.T. approved final version of manuscript.
ACKNOWLEDGMENTS
We thank Charla Jay and Grace Meers (University of Missouri) for technical assistance and Dr. Thomas Solomon (University of Copenhagen) for intellectual aid in conducting the hyperinsulinemic-euglycemic clamp studies.
Current address of L.J. Reynolds: Pharmacology and Nutritional Sciences Department, University of Kentucky. Current address of D.P. Credeur: Department of Kinesiology, University of Southern Mississippi. Current address of P.J. Fadel: Department of Kinesiology, University of Texas at Arlington. Current address of J.P. Thyfault: Department of Molecular and Integrative Physiology, University of Kansas Medical Center.
REFERENCES
- 1.Aldridge GM, Podrebarac DM, Greenough WT, Weiler IJ. The use of total protein stains as loading controls: an alternative to high-abundance single-protein controls in semi-quantitative immunoblotting. J Neurosci Methods 172: 250–254, 2008. doi: 10.1016/j.jneumeth.2008.05.003. [DOI] [PMC free article] [PubMed] [Google Scholar]
- 2.Baron AD, Brechtel-Hook G, Johnson A, Cronin J, Leaming R, Steinberg HO. Effect of perfusion rate on the time course of insulin-mediated skeletal muscle glucose uptake. Am J Physiol 271: E1067–E1072, 1996. [DOI] [PubMed] [Google Scholar]
- 3.Baron AD, Laakso M, Brechtel G, Hoit B, Watt C, Edelman SV. Reduced postprandial skeletal muscle blood flow contributes to glucose intolerance in human obesity. J Clin Endocrinol Metab 70: 1525–1533, 1990. doi: 10.1210/jcem-70-6-1525. [DOI] [PubMed] [Google Scholar]
- 4.Barton M, Carmona R, Morawietz H, d’Uscio LV, Goettsch W, Hillen H, Haudenschild CC, Krieger JE, Münter K, Lattmann T, Lüscher TF, Shaw S. Obesity is associated with tissue-specific activation of renal angiotensin-converting enzyme in vivo: evidence for a regulatory role of endothelin. Hypertension 35: 329–336, 2000. doi: 10.1161/01.HYP.35.1.329. [DOI] [PubMed] [Google Scholar]
- 5.Boyle JP, Thompson TJ, Gregg EW, Barker LE, Williamson DF. Projection of the year 2050 burden of diabetes in the US adult population: dynamic modeling of incidence, mortality, and prediabetes prevalence. Popul Health Metr 8: 29, 2010. doi: 10.1186/1478-7954-8-29. [DOI] [PMC free article] [PubMed] [Google Scholar]
- 7.Cardillo C, Campia U, Iantorno M, Panza JA. Enhanced vascular activity of endogenous endothelin-1 in obese hypertensive patients. Hypertension 43: 36–40, 2004. doi: 10.1161/01.HYP.0000103868.45064.81. [DOI] [PubMed] [Google Scholar]
- 8.Cardillo C, Kilcoyne CM, Nambi SS, Cannon RO III, Quon MJ, Panza JA. Vasodilator response to systemic but not to local hyperinsulinemia in the human forearm. Hypertension 32: 740–745, 1998. doi: 10.1161/01.HYP.32.4.740. [DOI] [PubMed] [Google Scholar]
- 9.Clark MG, Wallis MG, Barrett EJ, Vincent MA, Richards SM, Clerk LH, Rattigan S. Blood flow and muscle metabolism: a focus on insulin action. Am J Physiol Endocrinol Metab 284: E241–E258, 2003. doi: 10.1152/ajpendo.00408.2002. [DOI] [PubMed] [Google Scholar]
- 10.Cocks M, Shepherd SO, Shaw CS, Achten J, Costa ML, Wagenmakers AJ. Immunofluorescence microscopy to assess enzymes controlling nitric oxide availability and microvascular blood flow in muscle. Microcirculation 19: 642–651, 2012. doi: 10.1111/j.1549-8719.2012.00199.x. [DOI] [PubMed] [Google Scholar]
- 11.Donato AJ, Gano LB, Eskurza I, Silver AE, Gates PE, Jablonski K, Seals DR. Vascular endothelial dysfunction with aging: endothelin-1 and endothelial nitric oxide synthase. Am J Physiol Heart Circ Physiol 297: H425–H432, 2009. doi: 10.1152/ajpheart.00689.2008. [DOI] [PMC free article] [PubMed] [Google Scholar]
- 12.Dudzinski DM, Michel T. Life history of eNOS: partners and pathways. Cardiovasc Res 75: 247–260, 2007. doi: 10.1016/j.cardiores.2007.03.023. [DOI] [PMC free article] [PubMed] [Google Scholar]
- 13.Eringa EC, Stehouwer CD, Roos MH, Westerhof N, Sipkema P. Selective resistance to vasoactive effects of insulin in muscle resistance arteries of obese Zucker (fa/fa) rats. Am J Physiol Endocrinol Metab 293: E1134–E1139, 2007. doi: 10.1152/ajpendo.00516.2006. [DOI] [PubMed] [Google Scholar]
- 14.Hattori Y, Kasai K, Nakamura T, Emoto T, Shimoda S. Effect of glucose and insulin on immunoreactive endothelin-1 release from cultured porcine aortic endothelial cells. Metabolism 40: 165–169, 1991. doi: 10.1016/0026-0495(91)90168-V. [DOI] [PubMed] [Google Scholar]
- 15.Hu RM, Levin ER, Pedram A, Frank HJ. Insulin stimulates production and secretion of endothelin from bovine endothelial cells. Diabetes 42: 351–358, 1993. doi: 10.2337/diab.42.2.351. [DOI] [PubMed] [Google Scholar]
- 16.Jurrissen TJ, Sheldon RD, Gastecki ML, Woodford ML, Zidon TM, Rector RS, Vieira-Potter VJ, Padilla J. Ablation of eNOS does not promote adipose tissue inflammation. Am J Physiol Regul Integr Comp Physiol 310: R744–R751, 2016. doi: 10.1152/ajpregu.00473.2015. [DOI] [PMC free article] [PubMed] [Google Scholar]
- 17.Kashyap SR, Roman LJ, Lamont J, Masters BS, Bajaj M, Suraamornkul S, Belfort R, Berria R, Kellogg DL Jr, Liu Y, DeFronzo RA. Insulin resistance is associated with impaired nitric oxide synthase activity in skeletal muscle of type 2 diabetic subjects. J Clin Endocrinol Metab 90: 1100–1105, 2005. doi: 10.1210/jc.2004-0745. [DOI] [PubMed] [Google Scholar]
- 18.Kawanabe Y, Nauli SM. Endothelin. Cell Mol Life Sci 68: 195–203, 2011. doi: 10.1007/s00018-010-0518-0. [DOI] [PMC free article] [PubMed] [Google Scholar]
- 19.Kim F, Pham M, Maloney E, Rizzo NO, Morton GJ, Wisse BE, Kirk EA, Chait A, Schwartz MW. Vascular inflammation, insulin resistance, and reduced nitric oxide production precede the onset of peripheral insulin resistance. Arterioscler Thromb Vasc Biol 28: 1982–1988, 2008. doi: 10.1161/ATVBAHA.108.169722. [DOI] [PMC free article] [PubMed] [Google Scholar]
- 20.Kim JA, Montagnani M, Koh KK, Quon MJ. Reciprocal relationships between insulin resistance and endothelial dysfunction: molecular and pathophysiological mechanisms. Circulation 113: 1888–1904, 2006. doi: 10.1161/CIRCULATIONAHA.105.563213. [DOI] [PubMed] [Google Scholar]
- 21.Kingwell BA, Formosa M, Muhlmann M, Bradley SJ, McConell GK. Type 2 diabetic individuals have impaired leg blood flow responses to exercise: role of endothelium-dependent vasodilation. Diabetes Care 26: 899–904, 2003. doi: 10.2337/diacare.26.3.899. [DOI] [PubMed] [Google Scholar]
- 22.Kobayashi T, Kamata K. Effect of chronic insulin treatment on NO production and endothelium-dependent relaxation in aortae from established STZ-induced diabetic rats. Atherosclerosis 155: 313–320, 2001. doi: 10.1016/S0021-9150(00)00583-9. [DOI] [PubMed] [Google Scholar]
- 23.Kubota T, Kubota N, Kumagai H, Yamaguchi S, Kozono H, Takahashi T, Inoue M, Itoh S, Takamoto I, Sasako T, Kumagai K, Kawai T, Hashimoto S, Kobayashi T, Sato M, Tokuyama K, Nishimura S, Tsunoda M, Ide T, Murakami K, Yamazaki T, Ezaki O, Kawamura K, Masuda H, Moroi M, Sugi K, Oike Y, Shimokawa H, Yanagihara N, Tsutsui M, Terauchi Y, Tobe K, Nagai R, Kamata K, Inoue K, Kodama T, Ueki K, Kadowaki T. Impaired insulin signaling in endothelial cells reduces insulin-induced glucose uptake by skeletal muscle. Cell Metab 13: 294–307, 2011. doi: 10.1016/j.cmet.2011.01.018. [DOI] [PubMed] [Google Scholar]
- 24.Laakso M, Edelman SV, Brechtel G, Baron AD. Decreased effect of insulin to stimulate skeletal muscle blood flow in obese man. A novel mechanism for insulin resistance. J Clin Invest 85: 1844–1852, 1990. doi: 10.1172/JCI114644. [DOI] [PMC free article] [PubMed] [Google Scholar]
- 25.Laakso M, Edelman SV, Brechtel G, Baron AD. Impaired insulin-mediated skeletal muscle blood flow in patients with NIDDM. Diabetes 41: 1076–1083, 1992. doi: 10.2337/diab.41.9.1076. [DOI] [PubMed] [Google Scholar]
- 26.Mäkimattila S, Virkamäki A, Groop PH, Cockcroft J, Utriainen T, Fagerudd J, Yki-Järvinen H. Chronic hyperglycemia impairs endothelial function and insulin sensitivity via different mechanisms in insulin-dependent diabetes mellitus. Circulation 94: 1276–1282, 1996. doi: 10.1161/01.CIR.94.6.1276. [DOI] [PubMed] [Google Scholar]
- 27.Mather KJ, Lteif A, Steinberg HO, Baron AD. Interactions between endothelin and nitric oxide in the regulation of vascular tone in obesity and diabetes. Diabetes 53: 2060–2066, 2004. doi: 10.2337/diabetes.53.8.2060. [DOI] [PubMed] [Google Scholar]
- 28.Mather KJ, Mirzamohammadi B, Lteif A, Steinberg HO, Baron AD. Endothelin contributes to basal vascular tone and endothelial dysfunction in human obesity and type 2 diabetes. Diabetes 51: 3517–3523, 2002. doi: 10.2337/diabetes.51.12.3517. [DOI] [PubMed] [Google Scholar]
- 29.Michel JB, Feron O, Sase K, Prabhakar P, Michel T. Caveolin versus calmodulin. Counterbalancing allosteric modulators of endothelial nitric oxide synthase. J Biol Chem 272: 25907–25912, 1997. doi: 10.1074/jbc.272.41.25907. [DOI] [PubMed] [Google Scholar]
- 30.Mikus CR, Boyle LJ, Borengasser SJ, Oberlin DJ, Naples SP, Fletcher J, Meers GM, Ruebel M, Laughlin MH, Dellsperger KC, Fadel PJ, Thyfault JP. Simvastatin impairs exercise training adaptations. J Am Coll Cardiol 62: 709–714, 2013. doi: 10.1016/j.jacc.2013.02.074. [DOI] [PMC free article] [PubMed] [Google Scholar]
- 31.Mikus CR, Fairfax ST, Libla JL, Boyle LJ, Vianna LC, Oberlin DJ, Uptergrove GM, Deo SH, Kim A, Kanaley JA, Fadel PJ, Thyfault JP. Seven days of aerobic exercise training improves conduit artery blood flow following glucose ingestion in patients with type 2 diabetes. J Appl Physiol (1985) 111: 657–664, 2011. doi: 10.1152/japplphysiol.00489.2011. [DOI] [PMC free article] [PubMed] [Google Scholar]
- 32.Mikus CR, Rector RS, Arce-Esquivel AA, Libla JL, Booth FW, Ibdah JA, Laughlin MH, Thyfault JP. Daily physical activity enhances reactivity to insulin in skeletal muscle arterioles of hyperphagic Otsuka Long-Evans Tokushima Fatty rats. J Appl Physiol (1985) 109: 1203–1210, 2010. doi: 10.1152/japplphysiol.00064.2010. [DOI] [PMC free article] [PubMed] [Google Scholar]
- 33.Mikus CR, Roseguini BT, Uptergrove GM, Morris EM, Rector RS, Libla JL, Oberlin DJ, Borengasser SJ, Taylor AM, Ibdah JA, Laughlin MH, Thyfault JP. Voluntary wheel running selectively augments insulin-stimulated vasodilation in arterioles from white skeletal muscle of insulin-resistant rats. Microcirculation 19: 729–738, 2012. doi: 10.1111/j.1549-8719.2012.00210.x. [DOI] [PMC free article] [PubMed] [Google Scholar]
- 34.Mundy AL, Haas E, Bhattacharya I, Widmer CC, Kretz M, Hofmann-Lehmann R, Minotti R, Barton M. Fat intake modifies vascular responsiveness and receptor expression of vasoconstrictors: implications for diet-induced obesity. Cardiovasc Res 73: 368–375, 2007. doi: 10.1016/j.cardiores.2006.11.019. [DOI] [PubMed] [Google Scholar]
- 34a.National Institute on Alcohol Abuse and Alcoholism Drinking Levels Defined. https://www.niaaa.nih.gov/alcohol-health/overview-alcohol-consumption/moderate-binge-drinking.
- 35.Oliver FJ, de la Rubia G, Feener EP, Lee ME, Loeken MR, Shiba T, Quertermous T, King GL. Stimulation of endothelin-1 gene expression by insulin in endothelial cells. J Biol Chem 266: 23251–23256, 1991. [PubMed] [Google Scholar]
- 36.Ottosson-Seeberger A, Lundberg JM, Alvestrand A, Ahlborg G. Exogenous endothelin-1 causes peripheral insulin resistance in healthy humans. Acta Physiol Scand 161: 211–220, 1997. doi: 10.1046/j.1365-201X.1997.00212.x. [DOI] [PubMed] [Google Scholar]
- 37.Padilla J, Jenkins NT, Thorne PK, Lansford KA, Fleming NJ, Bayless DS, Sheldon RD, Rector RS, Laughlin MH. Differential regulation of adipose tissue and vascular inflammatory gene expression by chronic systemic inhibition of NOS in lean and obese rats. Physiol Rep 2: e00225, 2014. doi: 10.1002/phy2.225. [DOI] [PMC free article] [PubMed] [Google Scholar]
- 38.Potenza MA, Addabbo F, Montagnani M. Vascular actions of insulin with implications for endothelial dysfunction. Am J Physiol Endocrinol Metab 297: E568–E577, 2009. doi: 10.1152/ajpendo.00297.2009. [DOI] [PubMed] [Google Scholar]
- 39.Potenza MA, Marasciulo FL, Chieppa DM, Brigiani GS, Formoso G, Quon MJ, Montagnani M. Insulin resistance in spontaneously hypertensive rats is associated with endothelial dysfunction characterized by imbalance between NO and ET-1 production. Am J Physiol Heart Circ Physiol 289: H813–H822, 2005. doi: 10.1152/ajpheart.00092.2005. [DOI] [PubMed] [Google Scholar]
- 40.Rafnsson A, Shemyakin A, Pernow J. Selective endothelin ETA and dual ET(A)/ET(B) receptor blockade improve endothelium-dependent vasodilatation in patients with type 2 diabetes and coronary artery disease. Life Sci 118: 435–439, 2014. doi: 10.1016/j.lfs.2014.02.026. [DOI] [PubMed] [Google Scholar]
- 41.Reaven GM. Banting lecture 1988. Role of insulin resistance in human disease. Diabetes 37: 1595–1607, 1988. doi: 10.2337/diab.37.12.1595. [DOI] [PubMed] [Google Scholar]
- 42.Repetto S, Salani B, Maggi D, Cordera R. Insulin and IGF-I phosphorylate eNOS in HUVECs by a caveolin-1 dependent mechanism. Biochem Biophys Res Commun 337: 849–852, 2005. doi: 10.1016/j.bbrc.2005.09.125. [DOI] [PubMed] [Google Scholar]
- 43.Reynolds LJ, Credeur DP, Holwerda SW, Leidy HJ, Fadel PJ, Thyfault JP. Acute inactivity impairs glycemic control but not blood flow to glucose ingestion. Med Sci Sports Exerc 47: 1087–1094, 2015. doi: 10.1249/MSS.0000000000000508. [DOI] [PMC free article] [PubMed] [Google Scholar]
- 44.Schinzari F, Iantorno M, Campia U, Mores N, Rovella V, Tesauro M, Di Daniele N, Cardillo C. Vasodilator responses and endothelin-dependent vasoconstriction in metabolically healthy obesity and the metabolic syndrome. Am J Physiol Endocrinol Metab 309: E787–E792, 2015. doi: 10.1152/ajpendo.00278.2015. [DOI] [PMC free article] [PubMed] [Google Scholar]
- 45.Schneider JG, Tilly N, Hierl T, Sommer U, Hamann A, Dugi K, Leidig-Bruckner G, Kasperk C. Elevated plasma endothelin-1 levels in diabetes mellitus. Am J Hypertens 15: 967–972, 2002. doi: 10.1016/S0895-7061(02)03060-1. [DOI] [PubMed] [Google Scholar]
- 46.Segal SS, Brett SE, Sessa WC. Codistribution of NOS and caveolin throughout peripheral vasculature and skeletal muscle of hamsters. Am J Physiol Heart Circ Physiol 277: H1167–H1177, 1999. [DOI] [PubMed] [Google Scholar]
- 47.Settergren M, Pernow J, Brismar K, Jörneskog G, Kalani M. Endothelin-A receptor blockade increases nutritive skin capillary circulation in patients with type 2 diabetes and microangiopathy. J Vasc Res 45: 295–302, 2008. doi: 10.1159/000113601. [DOI] [PubMed] [Google Scholar]
- 48.Shankar RR, Wu Y, Shen HQ, Zhu JS, Baron AD. Mice with gene disruption of both endothelial and neuronal nitric oxide synthase exhibit insulin resistance. Diabetes 49: 684–687, 2000. doi: 10.2337/diabetes.49.5.684. [DOI] [PubMed] [Google Scholar]
- 49.Sheldon RD, Roseguini BT, Thyfault JP, Crist BD, Laughlin MH, Newcomer SC. Acute impact of intermittent pneumatic leg compression frequency on limb hemodynamics, vascular function, and skeletal muscle gene expression in humans. J Appl Physiol (1985) 112: 2099–2109, 2012. doi: 10.1152/japplphysiol.00042.2012. [DOI] [PMC free article] [PubMed] [Google Scholar]
- 50.Shemyakin A, Böhm F, Wagner H, Efendic S, Båvenholm P, Pernow J. Enhanced endothelium-dependent vasodilatation by dual endothelin receptor blockade in individuals with insulin resistance. J Cardiovasc Pharmacol 47: 385–390, 2006. [DOI] [PubMed] [Google Scholar]
- 51.Shemyakin A, Salehzadeh F, Böhm F, Al-Khalili L, Gonon A, Wagner H, Efendic S, Krook A, Pernow J. Regulation of glucose uptake by endothelin-1 in human skeletal muscle in vivo and in vitro. J Clin Endocrinol Metab 95: 2359–2366, 2010. doi: 10.1210/jc.2009-1506. [DOI] [PubMed] [Google Scholar]
- 52.Simmons GH, Padilla J, Young CN, Wong BJ, Lang JA, Davis MJ, Laughlin MH, Fadel PJ. Increased brachial artery retrograde shear rate at exercise onset is abolished during prolonged cycling: role of thermoregulatory vasodilation. J Appl Physiol (1985) 110: 389–397, 2011. doi: 10.1152/japplphysiol.00936.2010. [DOI] [PMC free article] [PubMed] [Google Scholar]
- 53.Solomon TP, Haus JM, Li Y, Kirwan JP. Progressive hyperglycemia across the glucose tolerance continuum in older obese adults is related to skeletal muscle capillarization and nitric oxide bioavailability. J Clin Endocrinol Metab 96: 1377–1384, 2011. doi: 10.1210/jc.2010-2069. [DOI] [PMC free article] [PubMed] [Google Scholar]
- 54.Solomon TP, Haus JM, Marchetti CM, Stanley WC, Kirwan JP. Effects of exercise training and diet on lipid kinetics during free fatty acid-induced insulin resistance in older obese humans with impaired glucose tolerance. Am J Physiol Endocrinol Metab 297: E552–E559, 2009. doi: 10.1152/ajpendo.00220.2009. [DOI] [PMC free article] [PubMed] [Google Scholar]
- 55.Spier SA, Delp MD, Meininger CJ, Donato AJ, Ramsey MW, Muller-Delp JM. Effects of ageing and exercise training on endothelium-dependent vasodilatation and structure of rat skeletal muscle arterioles. J Physiol 556: 947–958, 2004. doi: 10.1113/jphysiol.2003.060301. [DOI] [PMC free article] [PubMed] [Google Scholar]
- 56.Tabit CE, Shenouda SM, Holbrook M, Fetterman JL, Kiani S, Frame AA, Kluge MA, Held A, Dohadwala MM, Gokce N, Farb MG, Rosenzweig J, Ruderman N, Vita JA, Hamburg NM. Protein kinase C-β contributes to impaired endothelial insulin signaling in humans with diabetes mellitus. Circulation 127: 86–95, 2013. doi: 10.1161/CIRCULATIONAHA.112.127514. [DOI] [PMC free article] [PubMed] [Google Scholar]
- 57.Traupe T, Lang M, Goettsch W, Münter K, Morawietz H, Vetter W, Barton M. Obesity increases prostanoid-mediated vasoconstriction and vascular thromboxane receptor gene expression. J Hypertens 20: 2239–2245, 2002. doi: 10.1097/00004872-200211000-00024. [DOI] [PubMed] [Google Scholar]
- 58.Wagner OF, Christ G, Wojta J, Vierhapper H, Parzer S, Nowotny PJ, Schneider B, Waldhäusl W, Binder BR. Polar secretion of endothelin-1 by cultured endothelial cells. J Biol Chem 267: 16066–16068, 1992. [PubMed] [Google Scholar]
- 59.Yamauchi T, Ohnaka K, Takayanagi R, Umeda F, Nawata H. Enhanced secretion of endothelin-1 by elevated glucose levels from cultured bovine aortic endothelial cells. FEBS Lett 267: 16–18, 1990. doi: 10.1016/0014-5793(90)80276-O. [DOI] [PubMed] [Google Scholar]
- 60.Young CN, Deo SH, Chaudhary K, Thyfault JP, Fadel PJ. Insulin enhances the gain of arterial baroreflex control of muscle sympathetic nerve activity in humans. J Physiol 588: 3593–3603, 2010. doi: 10.1113/jphysiol.2010.191866. [DOI] [PMC free article] [PubMed] [Google Scholar]