Our data support the feasibility of evaluating fluorine 18 fluorthanatrace as a quantifiable biomarker of poly (adenosine diphosphate–ribose) polymerase expression in clinical trials.
Abstract
Purpose
To demonstrate that positron emission tomography (PET) with fluorine 18 (18F) fluorthanatrace (FTT) depicts activated poly (adenosine diphosphate–ribose)polymerase (PARP) expression and is feasible for clinical trial evaluation.
Materials and Methods
All studies were conducted prospectively from February 2012 through July 2015 under protocols approved by the local animal studies committee and institutional review board. The area under the receiver operating characteristic curve (AUC, in g/mL· min) for 18F-FTT was assessed in normal mouse organs before and after treatment with olaparib (n = 14), a PARP inhibitor, or iniparib (n = 11), which has no PARP inhibitory activity. Murine biodistribution studies were performed to support human translational studies. Eight human subjects with cancer and eight healthy volunteers underwent imaging to verify the human radiation dosimetry of 18F-FTT. The Wilcoxon signed rank test was used to assess for differences among treatment groups for the mouse studies.
Results
In mice, olaparib, but not iniparib, significantly reduced the 18F-FTT AUC in the spine (median difference before and after treatment and interquartile range [IQR]: −17 g/mL· min and 10 g/mL · min, respectively [P = .0001], for olaparib and −3 g/mL · min and 13 g/mL · min [P = .70] for iniparib) and in nodes (median difference and interquartile range [IQR] before and after treatment: −23 g/mL · min and 13 g/mL · min [P = .0001] for olaparib; −9 g/mL · min and 17 g/mL · min [P = .05] for iniparib). The effective dose was estimated at 6.9 mSv for a 370-MBq 18F-FTT dose in humans. In humans, the organs with the highest uptake on images were the spleen and pancreas. Among five subjects with measurable tumors, increased 18F-FTT uptake was seen in one subject with pancreatic adenocarcinoma and another with liver cancer.
Conclusion
The results suggest that 18F-FTT uptake reflects PARP expression and that its radiation dosimetry profile is compatible with those of agents currently in clinical use.
© RSNA, 2016
Introduction
Poly (adenosine diphosphate–ribose)polymerases (PARPs) are enzymes best known for their role in DNA repair. These enzymes catalyze a process called poly (adenosine diphosphate–ribosyl)ation, or PARsylation, which leads to posttranslational modifications that regulate numerous biologic processes (1). PARP1, the best-understood member of this family, facilitates base excision repair (2) and mediates important alternative DNA repair pathways (3). Preclinical studies identified PARP-mediated DNA repair as an essential survival mechanism for breast and ovarian cancers harboring BRCA1 or BRCA2 mutations deleterious to the homologous recombination DNA repair pathway (4,5). Thus, PARP inhibition in these cancers results in massive genomic instability that leads to cell death by synthetic lethality (6,7). The activity of PARP inhibition in BRCA-mutant cancers has been confirmed with successful phase I and II trials (8,9). PARP inhibition may also be effective in a subset of cancers resistant to platinum-based chemotherapies (10). Therefore, PARP inhibition may prove to be an effective treatment strategy for a broad spectrum of cancers, as evidenced by the multiple PARP inhibitors in various phases of clinical development (11).
Despite these promising initial data, not all clinical trials have been uniformly successful (12,13). Olaparib only recently became the first U.S. Food and Drug Administration–approved PARP inhibitor after a long process of clinical investigation (14). It was approved for the treatment of BRCA-mutant ovarian cancer. The lack of biomarkers that can help guide the use of these agents may be one reason for these approval delays. Tissue-based biomarkers have been used to verify PARP inhibition, including measures of DNA damage as indirect assays of PARP activity or direct PARP enzyme activity assays (8,15–17). However, these assays require biopsies, limiting the assessment of multiple synchronous lesions and the ability to make serial measurements. Therefore, noninvasive measures of PARP expression could aid the assessment of PARP inhibitor efficacy for anticancer therapy.
Quantifying the uptake of PARP-targeted probes labeled for imaging with positron emission tomography (PET) may overcome some of the limitations of tissue-based methods. Multifunctional probes for PET, magnetic resonance (MR) imaging, and optical imaging have been synthesized to measure PARP in animal models (18), demonstrating the feasibility of imaging PARP expression in vivo. Initial preclinical data indicate that the radiolabeled PARP inhibitor fluorine 18 (18F) fluorthanatrace (FTT) binds specifically to PARP (19,20). Therefore, the purpose of this study was to present additional preclinical and first-in-human data to demonstrate that PET imaging with 18F-FTT helps detect activated PARP expression and is feasible for clinical trial evaluation.
Materials and Methods
Washington University provided funding for this study and has filed a patent on 18F-FTT that is pending (please see Disclosures for authors who are coinventors on this patent). This trial was registered on clinicaltrials.gov (identification number NCT02469129).
Synthesis and Radiolabeling of 18F-FTT
Figure 1 shows the synthesis scheme and structure of 1-(4-(2-fluoroethoxy)phenyl)-8,9-dihydro-2,7,9a-triazabenzo[cd]azulen-6 (7H)-one (18F-FTT), with radiolabeling performed as previously described (19,20).
Figure 1:
Synthesis scheme and structure of 18F-FTT. DMSO = dimethyl sulfoxide, OMs = mesylate, OTs = tosylate.
Reagents for Animal Experiments and Experimental Groups
Our institutional animal studies committee approved all animal studies, which were conducted between February 2012 and November 2014. Eight-week-old athymic nude mice (weight: 19–24 g; Harlan Laboratories, Indianapolis, Ind) were imaged before and after treatment with 50 mg/kg intraperitoneal injections of either olaparib (Sellekchem, Houston, Tex) (n = 14), a known PARP inhibitor, or iniparib (Sellekchem) (n = 11), a drug initially thought to be a PARP inhibitor but subsequently shown to have no PARP inhibitory activity (21,22). The axillary lymph nodes in a subset of imaged olaparib- or iniparib-treated mice (four mice per group) were combined for each mouse and assayed for PARP enzyme activity (model 4520–096-K; Trevigen, Gaithersberg, Md) following the manufacturer’s kit instructions. All of these mice had SCC1 (head and neck cancer) or MDA-MB-231 (triple-negative breast cancer) xenografts. However, the SCC1 tumors had very little uptake, and olaparib treatment results with MDA-MB-231 tumors, which had variable baseline 18F-FTT uptake, have been reported on previously (19). Therefore, the tumor data are not included in this report. Biodistribution for human dosimetry estimates (19 mice) and metabolism (six mice) of 18F-FTT was also assessed. The methods for tumor implantation, micro-PET imaging, and biodistribution and metabolism studies are detailed in Appendix E1 (online).
Human Subject Recruitment
The human imaging protocol was conducted with the approval of the local institutional review board under an exploratory Investigational New Drug application (number 124116) between November 2014 and July 2015. Given recent evidence suggesting that PARP upregulation could cause resistance to platinum-based chemotherapy regimens (23), we recruited men and women aged 18 years or older with a diagnosis of head and neck cancer or other cancer that could be treated with platinum-based chemotherapy regimens, including but not limited to ovarian, gastric, and pancreatic cancers, from the medical oncology clinics. Men and women aged 18 years or older with no known medical history, in particular no cardiopulmonary disease necessitating active medication or intervention, and no smoking history were also recruited through an institutional registry to characterize the distribution of the tracer in healthy volunteers. Appendix E1 (online) details additional eligibility criteria. Sixteen subjects—eight healthy subjects and eight subjects with cancer—gave written informed consent and completed all study procedures, with no withdrawals or exclusions. After the beginning of the study, it was discovered that one healthy volunteer occasionally used inhalers for seasonal asthma. However, the subject did not use inhalers at the time of the study. Therefore, this volunteer’s data were included in the analysis. Blood assays (complete blood counts and metabolic profiles) and symptoms were assessed before and after 18F-FTT injection for safety evaluation. Subjects were enrolled sequentially into cohorts in which imaging was performed at 0 and 120 minutes, 30 and 150 minutes, 60 and 180 minutes, and 90 and 210 minutes after tracer injection, with two healthy subjects and two subjects with cancer in each cohort.
Human PET Image Acquisition and Analysis
Whole-body images (midskull to midcalf) were obtained after injecting a mean (±standard deviation) of 374 MBq ± 19 (range, 348–403 MBq [0.5–2.1 µg]) of 18F-FTT with a PET/computed tomographic (CT) scanner (Biograph 40; Siemens, Knoxville, Tenn) by using 50 mAs (effective) for the attenuation-correction CT scan. PET images were reconstructed by means of three-dimensional ordered subset expectation maximization with the point spread function correction model by using two iterations and 21 subsets. Regions of interest were drawn over all visible organs by using the CT images and then transferred to the PET images and edited for spillover activity by using Integrated Research Workplace 4.0 (Siemens). The percentage injected dose per organ was calculated at each time point. Detailed image acquisition and analysis methods are described in Appendix E1 (online).
Human Dosimetry Estimates
Organ residence times and estimates of best- and worse-case scenarios were calculated from the percentage injected dose per organ derived from the human images and entered into the OLINDA/EXM software program (version 1.1; Vanderbilt University, Nashville, Tenn) to estimate individual organ doses and whole-body effective doses (24). Given the small number of subjects for the human dosimetry study, statistical analysis was not performed on the human image data. Data from all participants were combined so that four data points per time point were used for the dosimetry estimates as no systematic differences in the percentage injected dose per organ were observed between the healthy volunteers and the subjects with cancer. Appendix E1 (online) includes additional details.
Statistical Analysis
All mouse data are summarized as medians and interquartile ranges (IQRs). For the micro-PET studies, the standardized uptake value (in grams per milliliter) for each region of interest was plotted versus time and then the area under the receiver operating characteristic curve (AUC) was determined numerically by using the Trapezoid Rule (NumPy v1.11, Python 3.5) over the entire 60-minute acquisition. A paired, two-sided Wilcoxon signed rank test (R Foundation for Statistical Computing, v3.2.1) was performed to assess for differences in AUC data before and after olaparib or iniparib treatment separately for each group. The comparability of the olaparib and iniparib treatment groups was assessed by applying the two-sample Kolmogorov-Smirnov test to the pretreatment groups according to organ. The level of statistical significance for all tests was defined as P < .05. When multiple comparisons were made, the Bonferroni correction was used.
Results
Visible 18F-FTT Uptake at Micro-PET Is Reduced with Olaparib but Not Iniparib Treatment
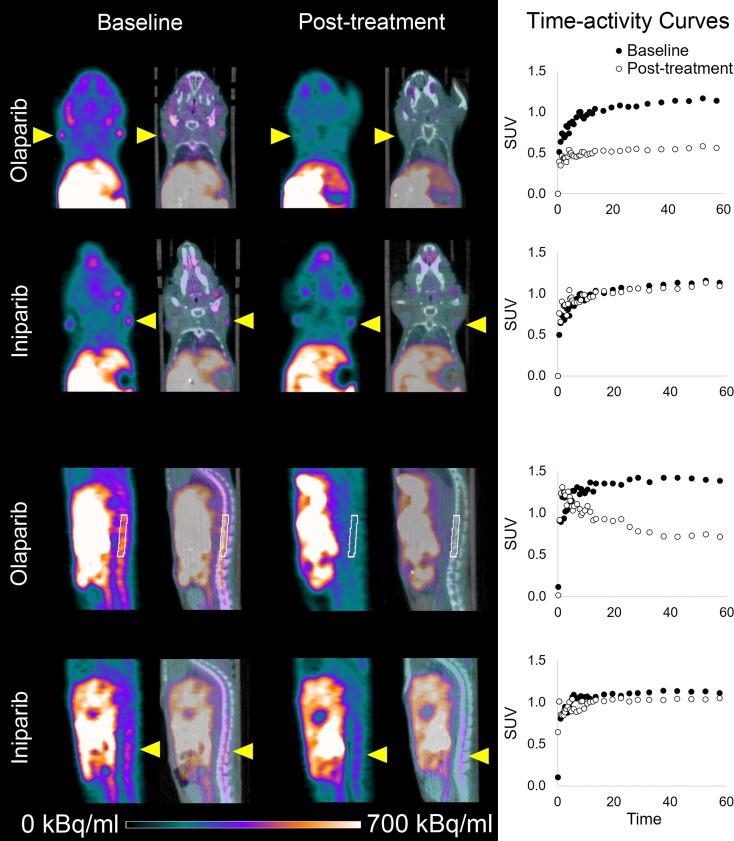
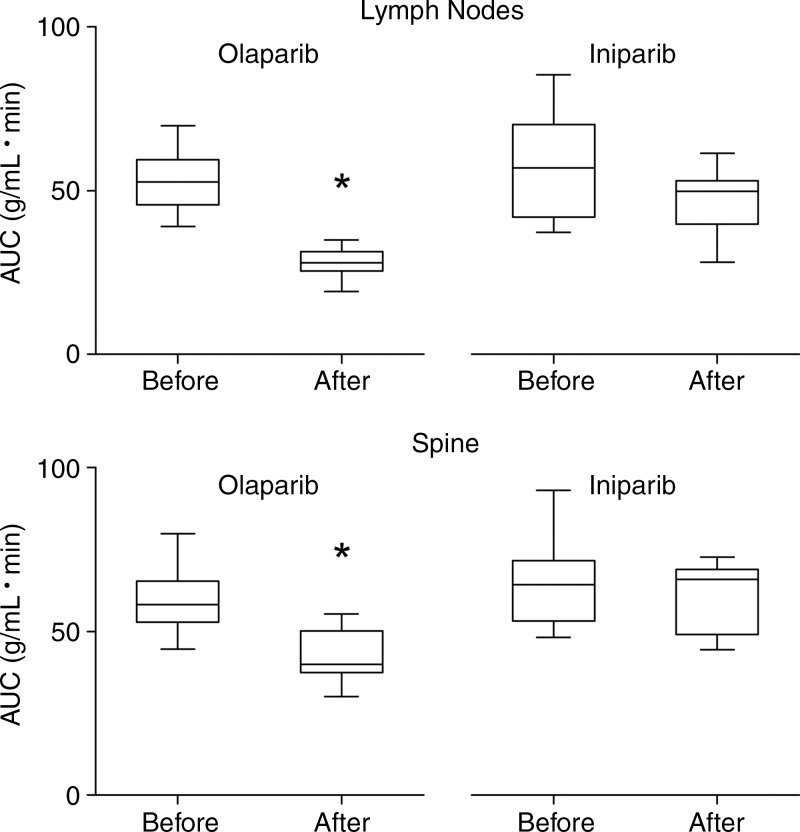
Representative micro-PET images of mice before and after treatment with either olaparib or iniparib are shown in Figure 2. Coronal and sagittal images demonstrated increased uptake in normal lymph nodes and spine at baseline. Olaparib, a known PARP inhibitor, blocked all visible 18F-FTT uptake in both nodes and spine. Iniparib had little effect on 18F-FTT uptake in the lymph nodes or spine visually. Treatment with olaparib led to a greater reduction in the 18F-FTT AUC compared with treatment with iniparib (Fig 3). In the lymph nodes assessed for PARP enzyme activity, nodes from olaparib-treated mice had less activity than those from iniparib-treated mice (Fig E1 [online]). Treatment with olaparib also led to a greater reduction in 18F-FTT accumulation in the liver as well as several other organs compared with treatment with iniparib (Table 1). 18F-FTT cleared rapidly from the blood and was excreted by both the hepatobiliary and renal systems. Table 1 summarizes the effect of olaparib and iniparib treatment on the evaluable organs from the micro-PET images.
Figure 2:
18F-FTT micro-PET images of athymic nude mice demonstrate nodal and spine activity before and after treatment with olaparib or iniparib. Coronal and sagittal micro-PET (last 10 minutes of 60-minute acquisition) and CT images of normal mice with lymph nodes and spine uptake indicated by yellow arrowheads or white region of interest. Corresponding time-activity curves are also shown. Left and right lymph node standard uptake values (SUV) over time were averaged to create graphs of time-activity curves for lymph nodes.
Figure 3:
Boxplots of effect of olaparib and iniparib on 18F-FTT uptake (expressed as AUC) in axillary lymph nodes and marrow of spine. * indicates P = .0001 when compared with pretreatment value.
Table 1.
Effect of Olaparib and Iniparib on Selected Normal Organs Measured with Micro-PET
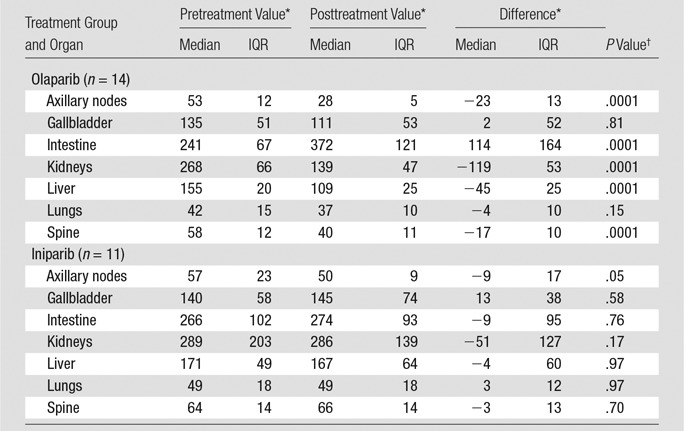
* Data are AUCs for a 60-minute time-activity curve.
†Level of significance was set at P = .0071 with Bonferroni correction for seven comparisons.
18F-FTT Dosimetry Estimates and Metabolism in Mice Suggest Feasibility for Human Clinical Trials
The mouse biodistribution data (Table E1 [online]) showed that the highest residence times were in bone and muscle, followed by blood. On the basis of these biodistribution data, the organ with the highest estimated radiation dose was the bladder wall for both male and female estimates. The estimated human effective dose was 0.013 mSv/MBq in male subjects and 0.015 mSv/MBq in female subjects. On the basis of this estimated effective dose, 370 MBq was chosen as the dose for the initial human studies, which would lead to an estimated maximum effective dose of 5.6 mSv (based on the higher effective dose of the male and female estimates). Metabolism studies in mice demonstrated that only 55% of the parent compound was present at 5 minutes and 13% remained at 30 minutes. In contrast, the liver had 94% parent compound at 5 minutes, with a substantial percentage remaining at 30 minutes (Fig E2 [online]). Because PARP expression has been reported in the liver (25,26), and treatment with olaparib but not iniparib reduced 18F-FTT accumulation in the liver, the high percentage of parent compound in the liver is most likely due to specific binding of 18F-FTT to PARP, preventing its metabolism.
Human Dosimetry and Preliminary Cancer Imaging Results
Eight participants with cancer (median age, 60 years; IQR, 4 years; five men and three women, all white) and eight healthy volunteers (median age, 40 years; IQR, 28 years; three men and five women) participated in this study. Table 2 summarizes the clinical characteristics of the participants with cancer. No significant changes in blood counts or blood chemistry values were noted after tracer injection (Table E2 [online]). One subject, who had just completed a chemotherapy cycle 4 days before study participation, experienced nausea during imaging that was deemed related to recent chemotherapy treatment. No adverse events related to the tracer injection were observed.
Table 2.
Clinical Characteristics of Subjects with Cancer
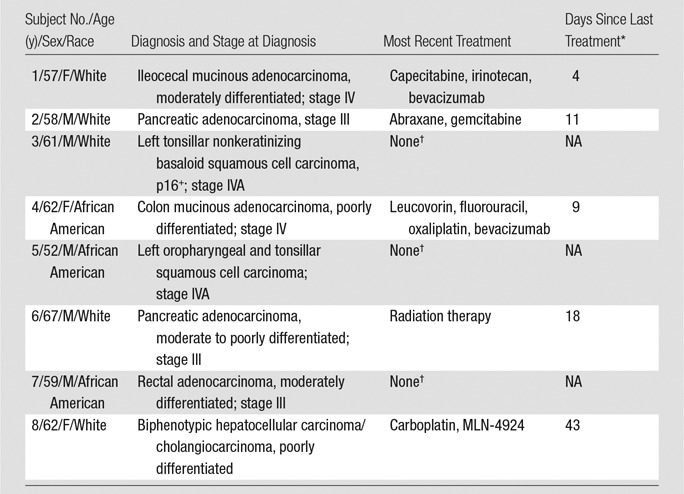
* NA = not applicable.
†These participants were not receiving active therapy at the time of participation. The last chemotherapy cycle for these participants was performed at least 1 year before the subjects underwent imaging for this study.
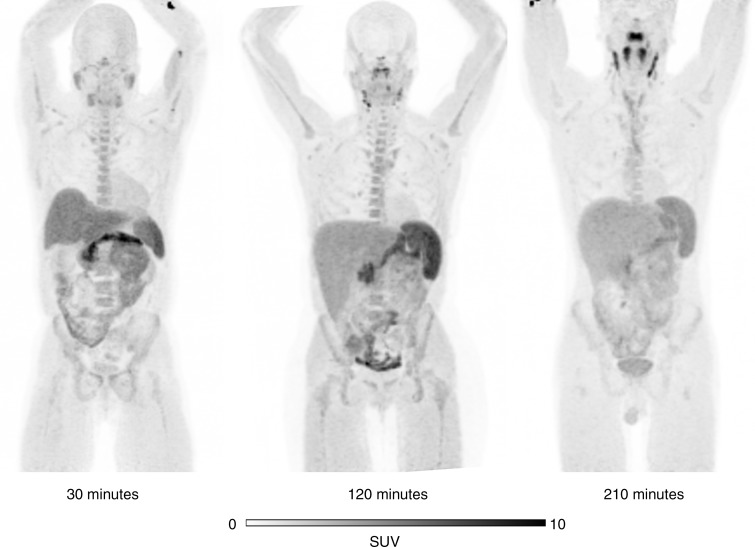
Figure 4 shows representative maximum intensity projection images from different healthy volunteers at several time points after tracer injection. The PET images demonstrated high uptake in the liver but less renal excretion than was anticipated with the animal data. The primary route of excretion was hepatobiliary. The normal organs with the highest uptake were the pancreas, spleen, and liver. Normal lymph nodes were easily visible. No clear differences in the distribution of the tracer were noted between the subjects with cancer and the healthy volunteers.
Figure 4:
Representative maximum intensity projection18F-FTT PET images from three different healthy volunteers demonstrate normal spleen, node, and marrow uptake. All images are scaled to maximum standardized uptake value (SUV) of 10.
Of the subjects with cancer (Table 2), five had measurable disease with another imaging modality, whereas the three subjects who had not undergone any recent treatment had no measurable disease at the time of participation. The two subjects with mucinous adenocarcinomas demonstrated only mildly increased peripheral activity around their tumors, similar to their expected appearance on 18F fluorodeoxyglucuse PET/CT scans (Fig E3 [online]). Of the three remaining subjects with measurable disease, two had visible tumor 18F-FTT uptake above the background activity—one in a recurrent pancreatic ductal adenocarcinoma (Fig 5) and another in a biphenotypic hepatocellular carcinoma/cholangiocarcinoma (Fig 6). In the recurrent pancreatic adenocarcinoma, although 18F-FTT washed out of the tumor between 30 and 150 minutes after tracer injection, visibly increased uptake in the tumor was still demonstrated when compared with background at the later time point. The third subject with a visible tumor had a poorly differentiated pancreatic adenocarcinoma with no visible activity in the residual tumor; however, this tumor had been treated with a full course of radiation therapy that was completed 18 days before the imaging session for this study (Fig 7).
Figure 5:
18F-FTT PET (left), unenhanced CT (middle), and fused transaxial (right) images in 52-year-old man with recurrent pancreatic adenocarcinoma after Whipple procedure (subject 2, Table 2). Images were obtained 30 minutes after tracer injection. Arrows indicate location of recurrent pancreatic cancer. Gray-scale PET images were set to same scale as that shown for color image. SUV = standardized uptake value.
Figure 6:
From left to right, transaxial 18F-FTT PET image, unenhanced CT scan, fused image, and contrast material–enhanced MR image in a 62-year-old woman with metastatic biphenotypic hepatocellular carcinoma/cholangiocarcinoma (subject 8, Table 2). The subject had previously undergone right hepatic trisegmentectomy and treatment with multiple chemotherapy regimens. The most recent chemotherapy regimen is described in Table 2. MR imaging was performed 1 month before 18F-FTT PET/CT and demonstrated new metastatic liver lesions with decreased signal intensity, as seen on MR image (arrow), in addition to enlargement of left hepatic lobe as a result of previous partial hepatic resection. CT (liver window) showed interval enlargement of metastasis, as demonstrated by low-attenuation lesion that is clearly larger than low-signal-intensity lesion seen on corresponding MR image. 18F-FTT image shows increased uptake within this metastasis. PET/CT images were obtained 150 minutes after tracer injection. MR image was obtained 20 minutes after gadoxetate disodium injection. Arrows show locations of metastatic lesions. Gray-scale PET images were set to same scale as that shown for color image. SUV = standardized uptake value.
Figure 7:
Transaxial 18F-FTT PET (left), unenhanced CT (middle), and fused (right) images in 67-year-old man with recurrent pancreatic adenocarcinoma (subject 6, Table 2). 18F-FTT PET/CT was performed 18 days after completing radiation treatment (3000 cGy in 10 fractions over 2 weeks). Images were obtained 90 minutes after tracer injection. Arrows indicate tumor location. Green lines were used to aid in tumor localization given the lack of contrast on CT images and lack of uptake on 18F-FTT PET images. Gray-scale PET images were set to same scale as that shown for color image.
The residence times calculated from images of both participants with cancer and healthy volunteers are summarized in Table E3 [online] and were calculated from percentage injected dose for each organ at each time point from all volunteers (graphs for each organ are shown in Fig E4 [online]). The estimated dosimetry values in Table 3 demonstrate that the critical organ is the spleen and that the maximum of the male and female estimated effected dose for a 370-MBq injection is 6.9 mSv. The variability in the estimates reflects the observed intrasubject variations in organ 18F-FTT uptake.
Table 3.
Human Absorbed Dose Estimates
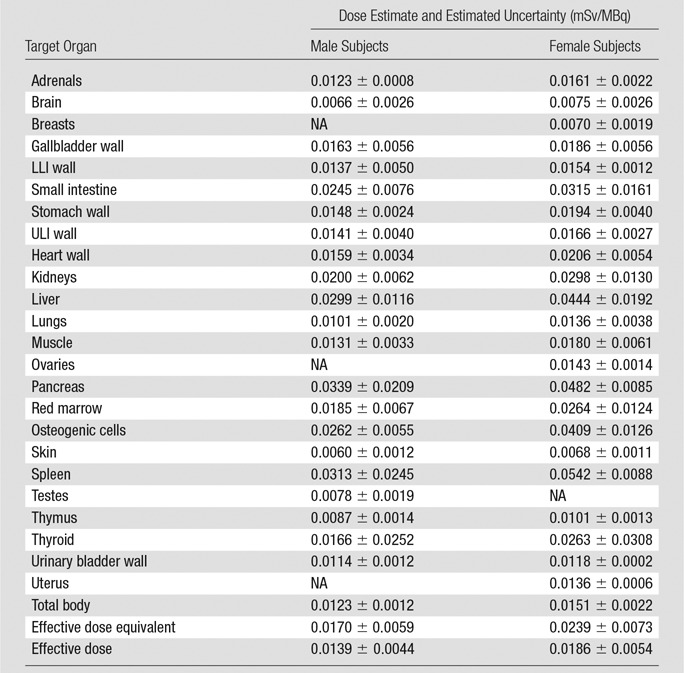
Note.—LLI = lower large intestine, NA = not applicable, ULI = upper large intestine.
Discussion
Our data support our hypothesis that 18F-FTT could serve as a noninvasive marker of PARP expression. The known PARP inhibitor olaparib reduced 18F-FTT uptake in normal organs known to express PARP as well as PARP enzyme activity in normal lymph nodes in mice. In contrast, iniparib, which has no direct effect on PARP activity (21), had a less marked effect on tracer uptake on these same organs. Given recently published data demonstrating that the uptake of 18F-FTT and structurally similar analogs reflect expression of activated PARP1 specifically (20,27), our results suggest that 18F-FTT uptake can be used to detect treatment-induced PARP inhibition. We also demonstrated that 18F-FTT imaging in humans is feasible, with increased tumor uptake observed in two subjects. Together with the fact that the radiation dosimetry profile of 18F-FTT is similar to that of the clinical tracer 18F fluorodeoxiglucose, our data support the feasibility of evaluating 18F-FTT as a quantifiable biomarker of PARP expression in clinical trials.
The 18F-FTT distribution in normal lymph nodes, spinal marrow, spleen, and liver supports the specificity of 18F-FTT binding for PARP. Immune cells, osteoblasts, and normal liver tissue express PARP (25,28,29). The large proportion of parent compound remaining in the liver at 30 minutes was therefore most likely due to specific binding that prevented its metabolism. Substantial defluorination most likely did not occur given the effects of olaparib and iniparib on spinal 18F-FTT uptake. The rapid initial disappearance of the parent compound from the blood may have been due to a combination of both renal clearance and rapid metabolism. The exact metabolite profile of 18F-FTT in humans remains to be determined. In addition, given the normal uptake in the lymph nodes and marrow, the level of increased 18F-FTT that can help differentiate tumor metastases to these sites remains to be determined.
The 18F-FTT distribution on the human images was similar in relative intensities to that on 18F fluorodeoxyglucose images. The increased 18F-FTT uptake in one subject with recurrent pancreatic adenocarcinoma and another with biphenotypic hepatocellular carcinoma/cholangiocarcinoma suggests that these cancers may be differentiated from background activity. A recent study demonstrated that approximately 20% of patients with pancreatic cancer and known germline BRCA1 or BRCA2 mutations who failed gemcitabine treatment respond to olaparib monotherapy (30). Therefore, the identification of this subset of patients with PARP inhibitor–responsive pancreatic cancers would be a potential clinical application for 18F-FTT. Although the high normal pancreas activity may limit detection of the primary tumor, changes in pancreatic tumor uptake may still be helpful in determining treatment responses. In addition, PARP inhibitors also effectively treat hepatocellular carcinoma xenografts in mice (31), and human hepatocellular carcinoma has higher PARP expression than normal liver tissue (25), which suggests that 18F-FTT may also help identify PARP inhibitor–responsive liver cancers. Finally, one subject had no visible 18F-FTT uptake at 18 days after radiation therapy, a time point at which 18F fluorodeoxyglucose would almost certainly be increased. Thus, 18F-FTT may be a useful biomarker of early radiation treatment responses that is not increased by posttreatment inflammation. However, these observations are limited to single examples of each condition. Therefore, further investigations are needed to reproduce these very preliminary results as well as compare 18F-FTT uptake against tissue assays of PARP expression to support additional trials testing the utility of 18F-FTT for predicting treatment responses to PARP inhibitors and radiation therapy in these cancers.
Because 18F-FTT competitively inhibits nicotinamide adenine dinucleotide binding to activated PARP (19), as do most other PARP inhibitors (32,33), 18F-FTT uptake most likely measures activated PARP protein levels. The binding of another PARP-targeted probe, iodine 125 (125I) KX1, which also binds at the nicotinamide adenine dinucleotide binding site, was recently reported to help predict PARP inhibitor treatment sensitivity (27). Two previous studies have demonstrated that PARP activity measured by poly (adenosine diphosphate–ribose) density, and not PARP expression, was the best predictor of response (23,34). However, to measure PARP expression, these studies used a PARP1 antibody that binds at the caspase cleavage site, which is distant from the nicotinamide adenine dinucleotide binding site within the catalytic domain. Because the nicotinamide adenine dinucleotide binding site is necessary for PARylation (35), this most likely explains why 125I-KX1 binding, as a measure of PARP protein expression, helps predict PARP inhibitor sensitivity in vitro. Because 18F-FTT and 125I-KX1 bind to the same site, we hypothesize that 18F-FTT uptake, as a marker of activated PARP protein expression, will also help predict PARP inhibitor treatment responses in patients. This remains to be confirmed in clinical trials.
In conclusion, we have developed a PARP imaging strategy that can help detect the degree of PARP inhibition in vivo. This strategy has the potential to fill crucial unmet needs in the field—namely the quantification of PARP levels in tumors in vivo and the assessment of effective PARP inhibitor dosing. This imaging approach may also be used to sequentially monitor patients receiving PARP inhibitors, potentially enabling clinicians to gauge the efficacy of PARP inhibition over time and to predict early anticancer treatment responses.
Advances in Knowledge
■ Significant reductions in the PET-measured fluorine 18 (18F) fluorthanatrace (FTT) area under the receiver operating characteristic curve (AUC) in normal mouse axillary lymph nodes, which are known to express poly (adenosine diphosphate–ribose)polymerase (PARP), were seen after treatment with the PARP inhibitor olaparib (median difference in 18F-FTT AUC before and after treatment, −23 g/mL · min; interquartile range [IQR], 13 g/mL · min; P = .0001) but not after treatment with iniparib, a cysteine-modifying drug with no effect on PARP activity (median difference in AUC, −9 g/mL · min; IQR, 17 g/mL · min; P = .05; significance at P = .0071), which suggests that 18F-FTT can help detect changes in PARP expression in response to PARP inhibition.
■ Images of healthy volunteers and subjects with cancer, obtained with a 370 MBq/10 mCi injection of 18F-FTT, demonstrate a radiation dosimetry profile that is similar to that of the clinical tracer 18F fluorodeoxyglucose, which supports the potential for routine clinical use of 18F-FTT, with a total effective dose of 5.1 mSv for male subjects and 6.9 mSv for female subjects and the critical organs being the spleen and pancreas.
■ The initial human images in one subject with recurrent pancreatic adenocarcinoma and another with liver cancer suggest that these cancers may be visualized with 18F-FTT.
Implications for Patient Care
■ With the emergence of PARP inhibitors as a new anticancer drug class, With the emergence of PARP inhibitors as a new anticancer drug class, 18F-FTT promises to be a specific biomarker of PARP expression in patients that can help guide the use of PARP inhibitors by confirming drug-target engagement in patients to improve the assessment of appropriate dosing.
■ 18F-FTT may further be used to identify cancers with increased PARP expression, such as the pancreatic and liver cancers imaged in this study, which might respond to PARP inhibition.
APPENDIX
SUPPLEMENTAL FIGURES
Acknowledgments
Acknowledgments
We thank the Washington University Cyclotron Facility for isotope production, the Small Animal Imaging Facility for conducting the micro-PET imaging and biodistribution experiments, and the Center for Clinical Imaging Research for acquiring the human PET/CT images.
Received August 16, 2016; revision requested September 13; revision received September 27; accepted October 4; final version accepted October 20.
Supported by Mallinckrodt Institute of Radiology Department Funding and the Washington University Office of Technology Management Bear Cub Fund. F.J.B. and D.L.C. (in part) are supported by the National Institutes of Health (grant HL121218).
Disclosures of Conflicts of Interest: L.S.M. Activities related to the present article: disclosed no relevant relationships. Activities not related to the present article: has a patent pending. Other relationships: disclosed no relevant relationships. S.D. disclosed no relevant relationships. F.J.B. disclosed no relevant relationships. K.J.S. disclosed no relevant relationships. S.L. disclosed no relevant relationships. J.T.E. disclosed no relevant relationships. S.P. disclosed no relevant relationships. B.T. disclosed no relevant relationships. A.W.G. disclosed no relevant relationships. C.B. disclosed no relevant relationships. W.C. Activities related to the present article: disclosed no relevant relationships. Activities not related to the present article: disclosed no relevant relationships. Other relationships: has a patent pending. D.Z. Activities related to the present article: disclosed no relevant relationships. Activities not related to the present article: disclosed no relevant relationships. Other relationships: has patents pending. R.H.M. Activities related to the present article: disclosed no relevant relationships. Activities not related to the present article: is the founder of TrevaRX Biomedical. Other relationships: has a patent pending. R.L. disclosed no relevant relationships. D.L.C. Activities related to the present article: disclosed no relevant relationships. Activities not related to the present article: disclosed no relevant relationships. Other relationships: has a patent pending.
Abbreviations:
- AUC
- area under the receiver operating characteristic curve
- FTT
- fluorthanatrace
- IQR
- interquartile range
- PARP
- poly (adenosine diphosphate–ribose)polymerase
References
- 1.Gibson BA, Kraus WL. New insights into the molecular and cellular functions of poly(ADP-ribose) and PARPs. Nat Rev Mol Cell Biol 2012;13(7):411–424. [DOI] [PubMed] [Google Scholar]
- 2.Schreiber V, Amé JC, Dollé P, et al. Poly(ADP-ribose) polymerase-2 (PARP-2) is required for efficient base excision DNA repair in association with PARP-1 and XRCC1. J Biol Chem 2002;277(25):23028–23036. [DOI] [PubMed] [Google Scholar]
- 3.Beck C, Robert I, Reina-San-Martin B, Schreiber V, Dantzer F. Poly(ADP-ribose) polymerases in double-strand break repair: focus on PARP1, PARP2 and PARP3. Exp Cell Res 2014;329(1):18–25. [DOI] [PubMed] [Google Scholar]
- 4.Bryant HE, Schultz N, Thomas HD, et al. Specific killing of BRCA2-deficient tumours with inhibitors of poly(ADP-ribose) polymerase. Nature 2005;434(7035):913–917. [DOI] [PubMed] [Google Scholar]
- 5.Senra JM, Telfer BA, Cherry KE, et al. Inhibition of PARP-1 by olaparib (AZD2281) increases the radiosensitivity of a lung tumor xenograft. Mol Cancer Ther 2011;10(10):1949–1958. [DOI] [PMC free article] [PubMed] [Google Scholar]
- 6.Turner NC, Ashworth A. Biomarkers of PARP inhibitor sensitivity. Breast Cancer Res Treat 2011;127(1):283–286. [DOI] [PubMed] [Google Scholar]
- 7.Patel AG, Sarkaria JN, Kaufmann SH. Nonhomologous end joining drives poly(ADP-ribose) polymerase (PARP) inhibitor lethality in homologous recombination-deficient cells. Proc Natl Acad Sci U S A 2011;108(8):3406–3411. [DOI] [PMC free article] [PubMed] [Google Scholar]
- 8.Fong PC, Boss DS, Yap TA, et al. Inhibition of poly(ADP-ribose) polymerase in tumors from BRCA mutation carriers. N Engl J Med 2009;361(2):123–134. [DOI] [PubMed] [Google Scholar]
- 9.Fong PC, Yap TA, Boss DS, et al. Poly(ADP)-ribose polymerase inhibition: frequent durable responses in BRCA carrier ovarian cancer correlating with platinum-free interval. J Clin Oncol 2010;28(15):2512–2519. [DOI] [PubMed] [Google Scholar]
- 10.Pyndiah S, Tanida S, Ahmed KM, Cassimere EK, Choe C, Sakamuro D. c-MYC suppresses BIN1 to release poly(ADP-ribose) polymerase 1: a mechanism by which cancer cells acquire cisplatin resistance. Sci Signal 2011;4(166):ra19. [DOI] [PubMed] [Google Scholar]
- 11.Drew Y. The development of PARP inhibitors in ovarian cancer: from bench to bedside. Br J Cancer 2015;113(Suppl 1):S3–S9. [DOI] [PMC free article] [PubMed] [Google Scholar]
- 12.Bennet N. No survival benefit of olaparib in ovarian cancer patients. Lancet Oncol 2012;13(5):e192. [Google Scholar]
- 13.Ledermann J, Harter P, Gourley C, et al. Olaparib maintenance therapy in platinum-sensitive relapsed ovarian cancer. N Engl J Med 2012;366(15):1382–1392. [DOI] [PubMed] [Google Scholar]
- 14.Gelmon KA, Tischkowitz M, Mackay H, et al. Olaparib in patients with recurrent high-grade serous or poorly differentiated ovarian carcinoma or triple-negative breast cancer: a phase 2, multicentre, open-label, non-randomised study. Lancet Oncol 2011;12(9):852–861. [DOI] [PubMed] [Google Scholar]
- 15.Plummer ER, Middleton MR, Jones C, et al. Temozolomide pharmacodynamics in patients with metastatic melanoma: DNA damage and activity of repair enzymes O6-alkylguanine alkyltransferase and poly(ADP-ribose) polymerase-1. Clin Cancer Res 2005;11(9):3402–3409. [DOI] [PubMed] [Google Scholar]
- 16.Bundred N, Gardovskis J, Jaskiewicz J, et al. Evaluation of the pharmacodynamics and pharmacokinetics of the PARP inhibitor olaparib: a phase I multicentre trial in patients scheduled for elective breast cancer surgery. Invest New Drugs 2013;31(4):949–958. [DOI] [PubMed] [Google Scholar]
- 17.Yang SX, Kummar S, Steinberg SM, et al. Immunohistochemical detection of poly(ADP-ribose) polymerase inhibition by ABT-888 in patients with refractory solid tumors and lymphomas. Cancer Biol Ther 2009;8(21):2004–2009. [DOI] [PubMed] [Google Scholar]
- 18.Reiner T, Lacy J, Keliher EJ, et al. Imaging therapeutic PARP inhibition in vivo through bioorthogonally developed companion imaging agents. Neoplasia 2012;14(3):169–177. [DOI] [PMC free article] [PubMed] [Google Scholar]
- 19.Zhou D, Chu W, Xu J, et al. Synthesis, [18F] radiolabeling, and evaluation of poly (ADP-ribose) polymerase-1 (PARP-1) inhibitors for in vivo imaging of PARP-1 using positron emission tomography. Bioorg Med Chem 2014;22(5):1700–1707. [DOI] [PMC free article] [PubMed] [Google Scholar]
- 20.Edmonds CE, Makvandi M, Lieberman BP, et al. [(18)F]Fluorthanatrace uptake as a marker of PARP1 expression and activity in breast cancer. Am J Nucl Med Mol Imaging 2016;6(1):94–101. [PMC free article] [PubMed] [Google Scholar]
- 21.Liu X, Shi Y, Maag DX, et al. Iniparib nonselectively modifies cysteine-containing proteins in tumor cells and is not a bona fide PARP inhibitor. Clin Cancer Res 2012;18(2):510–523. [DOI] [PubMed] [Google Scholar]
- 22.Patel AG, De Lorenzo SB, Flatten KS, Poirier GG, Kaufmann SH. Failure of iniparib to inhibit poly(ADP-ribose) polymerase in vitro. Clin Cancer Res 2012;18(6):1655–1662. [DOI] [PMC free article] [PubMed] [Google Scholar]
- 23.Michels J, Vitale I, Galluzzi L, et al. Cisplatin resistance associated with PARP hyperactivation. Cancer Res 2013;73(7):2271–2280. [DOI] [PubMed] [Google Scholar]
- 24.Herrero P, Laforest R, Shoghi K, et al. Feasibility and dosimetry studies for 18F-NOS as a potential PET radiopharmaceutical for inducible nitric oxide synthase in humans. J Nucl Med 2012;53(6):994–1001. [DOI] [PubMed] [Google Scholar]
- 25.Nomura F, Yaguchi M, Togawa A, et al. Enhancement of poly-adenosine diphosphate-ribosylation in human hepatocellular carcinoma. J Gastroenterol Hepatol 2000;15(5):529–535. [DOI] [PubMed] [Google Scholar]
- 26.Ogino H, Nozaki T, Gunji A, et al. Loss of PARP-1 affects gene expression profile in a genome-wide manner in ES cells and liver cells. BMC Genomics 2007;8:41. [DOI] [PMC free article] [PubMed] [Google Scholar]
- 27.Makvandi M, Xu K, Lieberman BP, et al. A radiotracer strategy to quantify PARP-1 expression in vivo provides a biomarker that can enable patient selection for PARP inhibitor therapy. Cancer Res 2016;76(15):4516–4524. [DOI] [PMC free article] [PubMed] [Google Scholar]
- 28.Rosado MM, Bennici E, Novelli F, Pioli C. Beyond DNA repair, the immunological role of PARP-1 and its siblings. Immunology 2013;139(4):428–437. [DOI] [PMC free article] [PubMed] [Google Scholar]
- 29.Hegedu˝s C, Robaszkiewicz A, Lakatos P, Szabó É, Virág L. Poly(ADP-ribose) in the bone: from oxidative stress signal to structural element. Free Radic Biol Med 2015;82:179–186. [DOI] [PubMed] [Google Scholar]
- 30.Kaufman B, Shapira-Frommer R, Schmutzler RK, et al. Olaparib monotherapy in patients with advanced cancer and a germline BRCA1/2 mutation. J Clin Oncol 2015;33(3):244–250. [DOI] [PMC free article] [PubMed] [Google Scholar]
- 31.Quiles-Perez R, Muñoz-Gámez JA, Ruiz-Extremera A, et al. Inhibition of poly adenosine diphosphate-ribose polymerase decreases hepatocellular carcinoma growth by modulation of tumor-related gene expression. Hepatology 2010;51(1):255–266. [DOI] [PubMed] [Google Scholar]
- 32.Ferraris DV. Evolution of poly(ADP-ribose) polymerase-1 (PARP-1) inhibitors: from concept to clinic. J Med Chem 2010;53(12):4561–4584. [DOI] [PubMed] [Google Scholar]
- 33.Ruf A, de Murcia G, Schulz GE. Inhibitor and NAD+ binding to poly(ADP-ribose) polymerase as derived from crystal structures and homology modeling. Biochemistry 1998;37(11):3893–3900. [DOI] [PubMed] [Google Scholar]
- 34.Gottipati P, Vischioni B, Schultz N, et al. Poly(ADP-ribose) polymerase is hyperactivated in homologous recombination-defective cells. Cancer Res 2010;70(13):5389–5398. [DOI] [PubMed] [Google Scholar]
- 35.D’Amours D, Desnoyers S, D’Silva I, Poirier GG. Poly(ADP-ribosyl)ation reactions in the regulation of nuclear functions. Biochem J 1999;342(Pt 2):249–268. [PMC free article] [PubMed] [Google Scholar]
Associated Data
This section collects any data citations, data availability statements, or supplementary materials included in this article.


