Abstract
Feedback circuitry with conduction and synaptic delays is ubiquitous in the nervous system. Yet the effects of delayed feedback on sensory processing of natural signals are poorly understood. This study explores the consequences of delayed excitatory and inhibitory feedback inputs on the processing of sensory information. We show, through numerical simulations and theory, that excitatory and inhibitory feedback can alter the firing frequency response of stochastic neurons in opposite ways by creating dynamical resonances, which in turn lead to information resonances (i.e., increased information transfer for specific ranges of input frequencies). The resonances are created at the expense of decreased information transfer in other frequency ranges. Using linear response theory for stochastically firing neurons, we explain how feedback signals shape the neural transfer function for a single neuron as a function of network size. We also find that balanced excitatory and inhibitory feedback can further enhance information tuning while maintaining a constant mean firing rate. Finally, we apply this theory to in vivo experimental data from weakly electric fish in which the feedback loop can be opened. We show that it qualitatively predicts the observed effects of inhibitory feedback. Our study of feedback excitation and inhibition reveals a possible mechanism by which optimal processing may be achieved over selected frequency ranges.
I. INTRODUCTION
Anatomical studies have revealed that feedback is omnipresent in the central nervous system [1]. It is generally agreed that feedback can modify the flow of sensory information from the periphery [2,3]. Experimental studies have demonstrated that feedback can alter intrinsic neuron dynamics and create oscillatory network dynamics [2–5]. There have been a number of theoretical studies dealing with closed-loop delayed feedback and their effects on single neuron and network dynamics [3,5–10]. Mean field equations for the population activity were derived in the early 1970s [11]. Since then numerous theoretical studies have dealt with the population activity of infinite-size networks of noisy neurons [7,9,10,12]. Results for finite-size networks have been obtained using corrections from the thermodynamic limit [10,13] and are thus a priori not valid for arbitrary network size. Furthermore, most studies look at the activity of the entire network [7,9,10,13] while experimental data is typically obtained from at most a few neurons [2,3]. Studies have shown that delayed excitatory and inhibitory feedback can alter network dynamics [7,9,10,13] as well as the network’s transfer function [10]. However, little is known theoretically about the influence of both delayed excitatory and inhibitory feedback on the transmission of information by single neurons whereas experimental data is typically gathered from single neurons.
The novelty of our work lies in deriving an analytical expression for the mutual information rate density as a function of feedback gain, sign, delay, and the number of neurons in the network. This result relies on linear response theory applied to both the stimulus as well as the feedback input. The building block of the theory is the firing rate response of a noisy neuron to sinusoidal input of different frequencies known as the susceptibility. It can be estimated experimentally or derived from a Fokker-Planck analysis of this time dependent problem. This theory is then applied to a network model of stochastic integrate-and-fire (IF) neurons globally coupled by both excitatory and inhibitory feedback. We show the effects of varying model parameters such as feedback strength and delay as well as network size. Since our theory looks at information transmission by single neurons, it is possible to apply it to experimental data. We thus finally illustrate our results using experimental data from the electrosensory lateral line lobe (ELL) of weakly electric fish and discuss the challenges of matching theory to data for such complex neural systems.
The paper is organized as follows: the model and information theoretic quantities of interest are presented in Secs. II and III. The linear response theory is presented in Sec. IV. We then show in Sec. V that feedback can change both the transfer function of a single neuron as well as its output dynamics in a network of integrate-and-fire neurons, in agreement with [10]. We then go beyond transfer function analysis to show that oscillatory dynamics near a specific frequency can increase information transmission for stimuli containing these frequencies. This is, however, at the expense of decreased information transfer at different frequencies. This effect is then shown to dependent on the network’s size as well as the feedback strength and delay. Balanced excitation and inhibition with slightly different delays can interfere in a constructive manner to further enhance information transfer over a narrow range of frequencies without changing the mean firing rate. Experimental results as well as the explanation of information resonances in terms of our theory are presented in Sec. VII. We are not aware of studies that have applied such results on the interplay of feedback, noise, information transfer and network size to a real experiment.
II. IF NEURON NETWORK
For simplicity, each neuron in the network is modeled by perfect integrate-and-fire dynamics [14] driven by additive white noise. Each receives both excitatory and inhibitory delayed feedback from every neuron in the network. There are two separate delays for each of these feedback pathways. The dynamics of neuron k are described by the following equations:
| (1) |
| (2) |
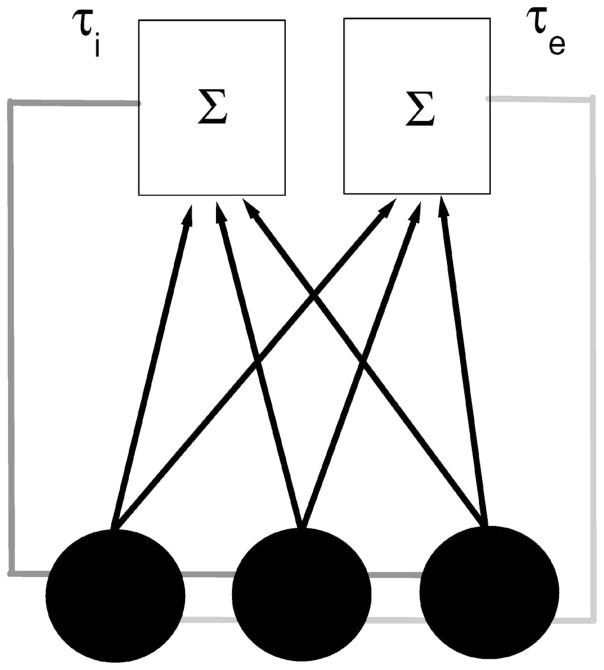
where μ is a constant bias current that is the same for all neurons, ξk(t) are independent and identically distributed Gaussian random variables of mean zero and standard deviation unity, D is the noise intensity, ge and gi are the respective excitatory and inhibitory gains, and Ke(t) and Ki(t) are the sum of the N spike trains convolved respectively with the synaptic kernels αe(t) and αi(t). τe and τi are the excitatory and inhibitory delays, respectively. S(t) is the stimulus, tkj is the jth firing time of neuron k while Mk(t) is the spike count of neuron k at time t. Each time the voltage reaches a threshold value θ, it is reset to 0 and an action potential is said to have occurred. We use delays that range between 10 and 30 msec. These are justified by thalamocortical delay loops [15] as well as values in the electrosensory lateral line lobe of weakly electric fish [16]. A circuit diagram is shown in Fig. 1.
FIG. 1.
Circuit diagram of our model. Each neuron is represented by a circle and sends its output to two kernels (one excitatory, one inhibitory) that sum the outputs from the population. The kernels’ output is then sent back to the neural population with delays τe and τi (gray and light gray, respectively). This example is drawn for N=3 neurons.
III. INFORMATION THEORY
Information theory was originally developed in the context of communication systems [17] and is being used in order to determine the nature of the neural code [18]. We use the indirect method to quantify the amount of information transmitted by a single neuron spike train [18,19]. The mutual information rate MI (in bits/sec) is given by
| (3) |
| (4) |
| (5) |
where I(f) is the mutual information rate density and C(f) is the coherence function. H(f) ≡ Psx(f)/Pss(f) is the transfer function of the system, Psx(f) is the cross-spectrum between the stimulus and the spike train Pss(f) is the power spectrum of the stimulus S(t), and Pxx(f) is the power spectrum of the spike train where ti is the ith spike and M(t) is the spike count at time t. Equation (4) requires that the stimulus S(t) has a Gaussian probability distribution. It can be shown that equation (4) gives the maximum amount of information that can be decoded by linear means [19]. Thus, Eq. (4) is exact for a linear system with additive noise [18]. A nonlinear decoder such as a noiseless neuron could potentially outperform a linear one especially if the encoding system has strong nonlinearities [18–20]. Equation (4) thus in general gives a lower bound on the rate of information transmission. However, we note that calculating the exact mutual information rate for a nonlinear excitable system is difficult and that analytical expressions only exist for rate modulated Poisson processes [21]. This is why we use linear response theory to compute C(f) and thus I(f).
Throughout this study, we use low-pass filtered Gaussian white noise as an input stimulus with a flat power spectrum of intensity α up to a cutoff frequency fc. The stimulus thus has variance 2αfc. Such stimuli have been used widely to characterize the neural response to different frequencies [18,22,23]. We note that the coherence C(f) is a function of both the transfer function H(f) as well as the output spike train power spectrum Pxx(f). Both quantities can thus influence the amount of information transmitted by a neuron.
IV. LINEAR RESPONSE THEORY
In this section, we derive analytical expressions for the transfer function H(f), spike train power spectrum Pxx(f), and the coherence function C(f) with linear response theory [25]. According to linear response theory [24–27], the spike train X(t) of a single neuron in the network in response to a time dependent input I(t) is approximated by
| (6) |
where X0(t) is the unperturbed spike train (i.e., the spike train when I(t) ≡ 0) and χ(t) is the susceptibility in response to the input that will in general both depend on the noise intensity D. The “*” denotes the convolution operation. We note that for a stochastic nonlinear system, equation (6) is usually 〈X(t)〉=〈X0(t)〉+χ* I(t) where 〈⋯〉 denotes an average over noise realizations. However, Eq. (6) will hold approximately for large D [8,24]. Moreover, it is assumed that the system behaves like a linear system in which the transfer function is given by the susceptibility χ(t).
Taking the Fourier transform of Eq. (6) gives
| (7) |
As done previously [8], we treat the feedback as an additional input to the system. Thus, for the model considered here, I(t) will have the following form:
| (8) |
Applying Eqs. (2) and (8) in Eq. (6) and taking the Fourier transform of both sides gives
| (9) |
| (10) |
where X0k(t) is the baseline activity of neuron k in the absence of stimulation or coupling by feedback. We will assume that the baseline activities of any neuron pair in the network are not correlated with each other. We note that at this point the spike trains X0k(t) are still unknown. We will first use Eqs. (9) and (10) in order to derive expressions for the power spectra of a single neuron as well as its transfer function. We will then give functional forms expressions for the various quantities needed to compute these expressions.
We first obtain an expression for the mean network activity by summing Eq. (9) from k=1 to N and dividing by N which gives upon rearranging:
| (11) |
Equation (9) now becomes
| (12) |
We obtain the following expression for the output spike train power spectrum PXkXk(f) of neuron k using Eq. (12) and the definition where 〈⋯〉 denotes an average over realizations of the internal noise:
| (13) |
Here is the baseline power spectrum of neuron k that is independent of k since we are considering an homogeneous network. As done previously [8], we split the feedback input into constant and time dependent parts. The constant part gives an effective bias current μ̃ which can be determined from μ̃= μ+(ge−gi) r0(μ̃) where r0(μ̃) is the firing rate of a single uncoupled integrate-and-fire neuron.
We note that the spike train power spectrum, being a second order quantity, cannot strictly be inferred from the susceptibility which is only a first order quantity. However, in deriving Eq. (13), we have assumed that the system behaves like a linear system with transfer function given by the susceptibility with the feedback treated as an input to the system. We note that this approximation has been used successfully several times in the literature [27,28] but that there are examples in which it can fail [29].
An expression analogous to Eq. (13) has been derived in the limit N → ∞ for leaky integrate-and-fire neurons coupled by inhibitory feedback [8,10]. Our results extend those of [8] in that we consider the effects of both excitatory and inhibitory feedback together on information transmission in networks of arbitrary size.
We can also derive an expression for the transfer function H(f) ≡ 〈X̃k(f)S̃*(f)〉/Pss(f) that is also independent of k since we are considering an homogeneous network:
| (14) |
with ϕ̃(f) given by Eq. (10).
Using the definition of the coherence function between spike train Xj(t) and the stimulus S(t) as well as Eqs. (13) and (14), we get
| (15) |
from which one gets the mutual information rate density I(f) using Eq. (4) and the mutual information rate MI using Eq. (3).
Finally, in order to apply Eq. (15) to the integrate-and-fire network defined by Eqs. (1) and (2), we need expressions for the susceptibility χ(t) as well as the baseline power spectrum P0(f). We can calculate the power spectrum under the assumption of independent interspike intervals using the following formula derived in [31]:
| (16) |
where 〈I〉 is the mean interspike interval and F1(f) is the Fourier transform of the interspike interval distribution P(I). For the integrate-and-fire model, P(I) is given by the well-known inverse Gaussian function:
| (17) |
Taking the Fourier transform of Eq. (17) and using Eq. (16) gives
| (18) |
Further, an expression for the Fourier transform of the susceptibility χ̃(f) has already been derived for the integrate-and-fire neuron [30]:
| (19) |
Thus we can obtain analytical expressions for the mutual information density and the power spectrum using Eqs. (13), (15), (18), and (19) that can be compared with numerical simulations of the integrate-and-fire network in different parameter regimes.
We note that the expressions for the spike train power spectrum as well as the coherence are general and thus could, in principle, be applied to other neuron models and we will show an example of application to experimental data.
V. SHAPING OF INFORMATION TUNING CURVES BY DELAYED FEEDBACK
A. Effects of feedback gain
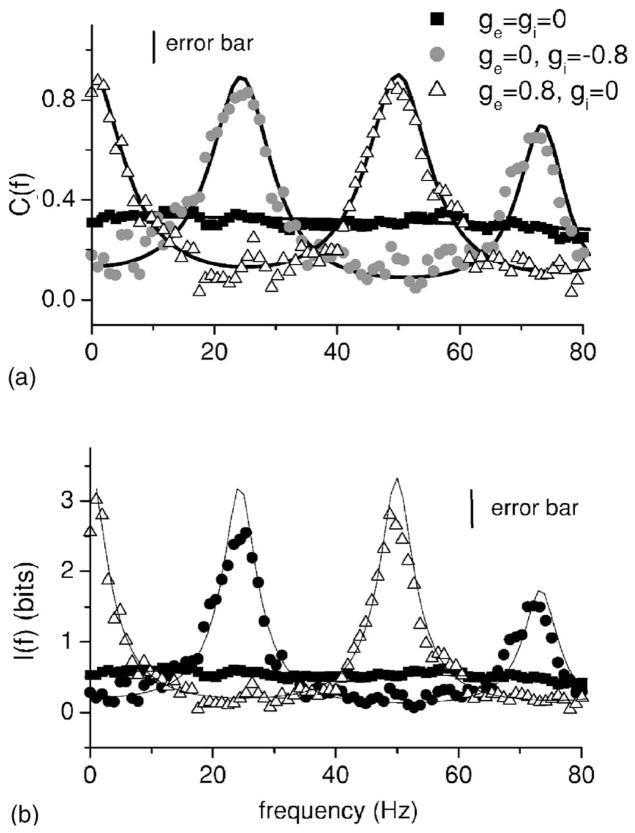
Figure 2(a) shows the coherence C(f) from numerical simulations of Eqs. (1) and (2) as well as the values of the mutual information rate density and the coherence derived from linear response theory obtained using Eqs. (4) and (15), respectively. Parameters were chosen such that the response was broadband over a wide range of frequencies in the absence of feedback (squares) in order to minimize the effects of intrinsic dynamics such as potential resonances. The noise and signal are of the same order of magnitude and this is done to mimic conditions seen in vivo. Good agreement between theory and numerical simulations is seen. Excitatory feedback (hollow triangles) is seen to increase the response at f =0 and near f =50 Hz and 100 Hz. These peaks correspond to integer multiples of the inverse delay. On the other hand, inhibitory feedback (circles) is seen to increase the response near f =25 Hz and f =75 Hz. Figure 2(b) shows the information density I(f). It is seen the both the coherence C(f) and the information density I(f) have the same shape which is not surprising given Eq. (4). For this reason, we will restrict ourselves to showing the coherence function from now on. Thus, excitatory and inhibitory feedback have opposite effects on neural information frequency tuning by increasing and decreasing the amount of information transmitted in complementary frequency ranges.
FIG. 2.
(a) Input-output coherence C(f) as a function of frequency f for no-feedback (squares), inhibitory feedback (circles), and excitatory (triangles). Throughout this study, the solid lines are the theoretical curves obtained from Eqs. (13)–(15) under the corresponding conditions. Excitatory and inhibitory feedback are seen to have opposite effects on information tuning. (b) Mutual information rate density I(f). Parameter values for the no-feedback case were μ=0.3, D=0.01, θ=1, α=0.01, f c =800 Hz, ge = gi =0, and N=100. In the case of inhibitory feedback, we used gi =−0.8 and τi =20 msec. In the case of excitatory feedback, we used ge =0.8, τe =20 msec, and μ=0.1. Throughout this study, we used αe(t) =αi(t) =63.66 exp(−50t2). We note that the particular shape of the function used does not qualitatively affect the nature of our results as long as their power spectrum does not decay at the frequency of interest. Firing rates for individual neurons were around 80 Hz. In both panels, the vertical line indicates the error bar on the simulation data. These represent maximum error bars for the simulation data and were always calculated from the scatter in the estimates obtained using independent noise realizations. Error bars in subsequent figures were always estimated in that way.
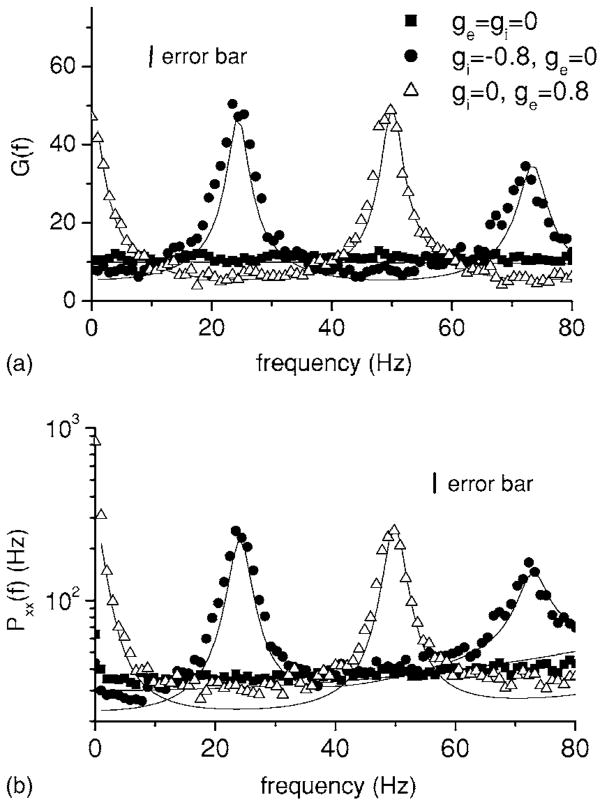
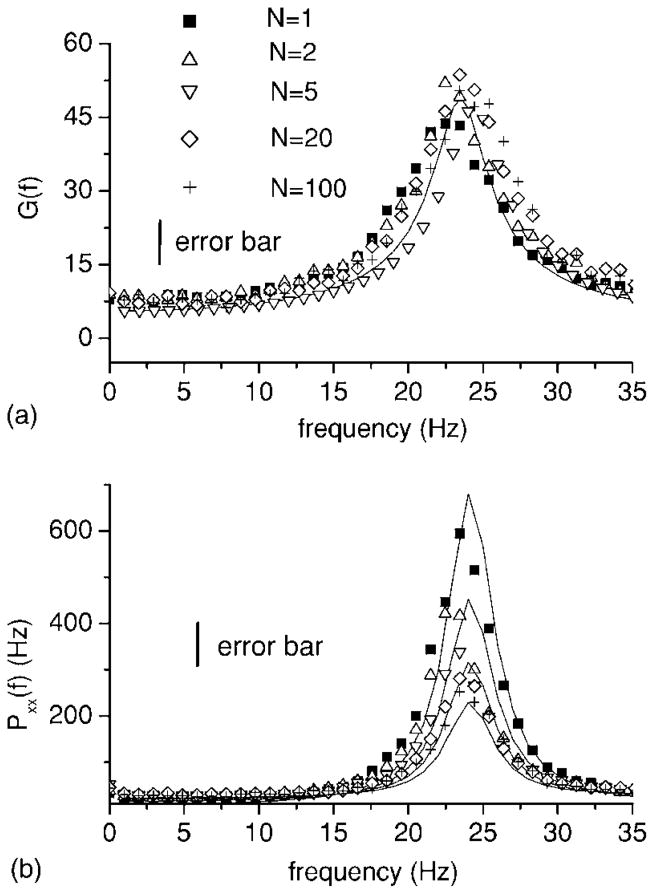
We note that similar results were seen for the power spectra of the network activity as well as system gain for both infinite size and finite size networks of integrate-and-fire neurons [7,10]. Our results are obtained for single neurons in the network however. In order to understand this effect and to compare with previous results, we plot both the system gain G(f) =|H(f)| [Fig. 3(a)] as well as the spike train power spectrum PXkXk(f) [Fig. 3(b)]. We observe that inhibitory (circles) and excitatory feedback (triangles) each have the same qualitative effect on the gain as well as the power spectrum. For example, inhibitory feedback causes a reduction in both the system gain and power spectrum at zero Hz. However, the reduction in gain is greater than the reduction in the power spectrum, hence the overall coherence is reduced. Excitatory feedback has the opposite effect, increasing the system gain and power spectrum near f =0. Thus, as shown previously [7,10], feedback can shape the transfer function by creating resonances. These in turn will lead to peaks in the spike train power spectrum, which are characteristic of oscillatory dynamics. We show here that these resonances are also seen in the mutual information rate density and thus can increase the amount of information transmitted about a time-varying stimulus.
FIG. 3.
System gain G(f)=|H(f)| (a) and output spike train power spectrum (b) for one neuron in a network of 100 neurons as a function of frequency f for the same conditions as in Fig. 2. The solid curves are computed from Eqs. (14) and (13). Excitatory feedback (triangles) will tend to increase the response near f =0 and f =50 Hz while inhibitory feedback (circles) will tend to increase the response near f =25 Hz and f =75 Hz. Parameter values are the same as in Fig. 2. Error bars are shown for the simulation data.
It is well known that both inhibitory feedback [5–7,11,32,33] as well as excitatory feedback [7,10] can create oscillatory network dynamics and shape the transfer function. We have shown here analytically the consequences of these dynamics on information transfer. At the single neuron level, inhibitory and excitatory delayed feedback can shape the neural transfer function, the power spectrum, and the coherence and mutual information rate density functions.
B. Effects of network size
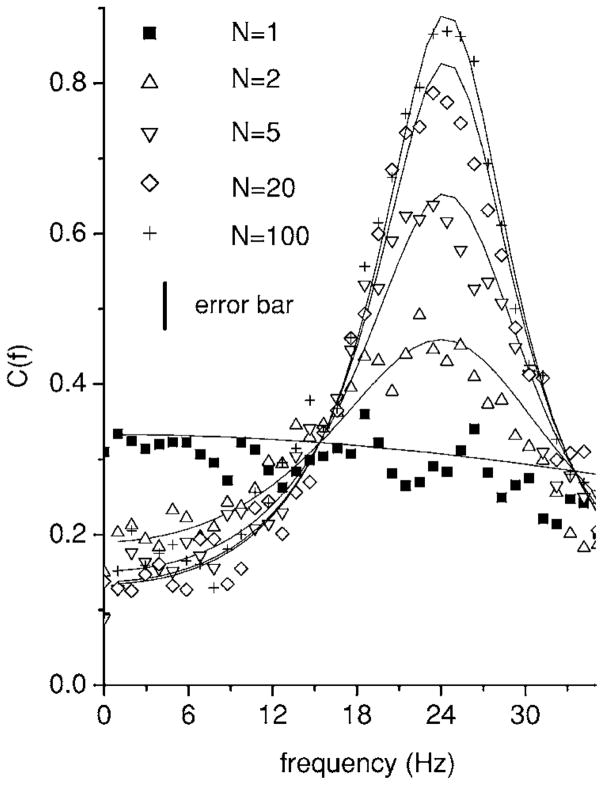
We now explore the effects of the network size N on this shaping. Figure 4 shows the coherence C(f) for different N in the case of inhibitory feedback. One observes that the enhancement of the coherence near f =25 Hz grows with N. In particular, the coherence with N=1 is similar to that with no feedback present (compare with Fig. 2) as predicted by linear response theory. This can be seen from Eq. (15) where setting N=1 gives
FIG. 4.
Coherence C(f) as a function of frequency f for different values of system size N, in the presence of inhibitory feedback. The coherence near f =25 Hz is seen to increase as a function of N. This is however at the expense of the coherence near f =0. The solid curves are computed from Eq. (15). Parameter values were μ=0.3, D=0.01, α=0.01, θ=1, fc =800 Hz, ge =0, gi =−0.8, and τi =20 msec. Error bars are shown for the simulation data.
| (20) |
For N=1, all dependence on ϕ̃(f) and thus all dependence on feedback input vanishes, and the coherence is equal to its value when gi = ge =0 (i.e., no feedback). Note that this is not because the feedback has no effect. Rather, as we will see, the feedback alters the transfer function and spike train power spectrum in a similar fashion, causing no change in the coherence C(f) that is related to the ratio of the two [note that Pss(f) is constant throughout].
As N increases however, the coherence increases and saturates for N large. In order to explain this effect, we show the system gain and the spike train power spectrum as a function of network size N in Figs. 5(a) and 5(b), respectively.
FIG. 5.
System gain G(f) (a) from Eq. (14) and output spike train power spectrum (b) from Eq. (13) as a function of system size N. Although the system gain is independent of system size (a), the power spectrum decreases as a function of N (b). Parameter values are the same as in Fig. 4. The stimulus is Gaussian white noise with fc=800 Hz. Error bars are shown for the simulation data.
Figure 5(a) shows that the system gain is independent of network size, as predicted by the theory. However, this is not the case for the spike train power spectrum: the power at f =25 Hz decreases as a function of N [Fig. 5(b)], thus increasing the coherence C(f). This is due to the average network activity term in Eq. (9). For N=1, this term is purely influenced by the single neuron’s activity in the past that is governed both by the stimulus S(t) and the noise ξ1(t). As N increases, the influence of the stimulus S(t) remains since it is a common input to all neurons in the network. However, the influence of the intrinsic noise sources ξk(t) is reduced since they are uncorrelated by assumption and this is reflected in decreasing fluctuations in around its time varying mean that decay as . This has the effect of reducing the power spectrum.
The delay and the sign of the feedback gain can cause both constructive and destructive interference at some frequencies between the feedforward and feedback signals. The former yields increased information transfer while the latter causes decreased information transfer.
C. Effects of delay
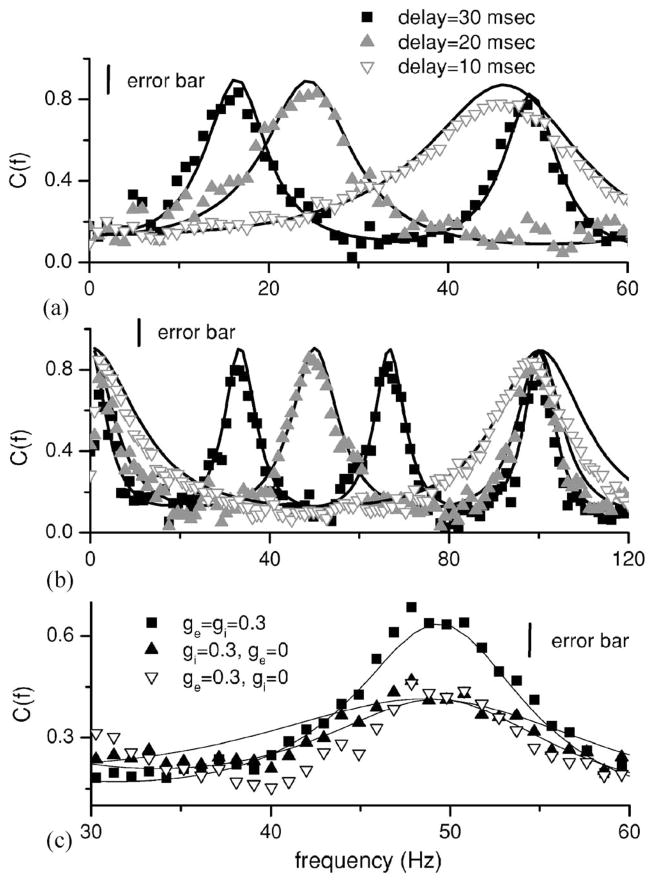
Finally, we explore the effects of varying the delays τe and τi. Figure 6(a) shows the coherence C(f) for different values of τi. It is seen that the maximum in information tuning shifts with the delay τi. In fact, the first maximum in tuning is located at f≈(2τi)−1 while the second maximum is located at f≈1.5(τi)−1. Moreover, Fig. 6(b) shows that the first maximum in tuning (other than the one at the origin) for excitatory feedback is located at frequency . Attenuation and enhancement by excitatory and inhibitory feedback are thus broadly tunable by changing the delays τe and τi.
FIG. 6.
Interaction of balanced excitation and inhibition. (a) Effects of varying the delay τi on the resonance which is located at a frequency (2τi)−1. We used μ =0.3, D=0.01, θ =1, fc=800 Hz, ge=0, gi=−0.8, and N=100. (b) Effects of varying the delay τe on the resonance, which is located at a frequency . We used μ =0.3, D=0.01, θ =1, α =0.01, fc=800 Hz, ge=0.8, gi=0, and N =100. (c) Effects of balanced excitation and inhibition. We used μ =0.3, D=0.01, α =0.01, θ =1, fc=800 Hz, N=20, τe=20 msec, and τi=30 msec. Error bars are shown for the simulation data.
D. Interaction of excitatory and inhibitory delayed feedback
Typically, feedback consists of parallel excitatory and inhibitory components emanating from a common population. This is the case for example for the cortico-thalamic loop [34]. In this general situation, one might expect an interaction between the individual shaping effects for each kind of feedback, and that the net effect will depend on the relative delays for each pathway. One may generally expect that the excitatory feedback will lead the inhibitory one, since the latter often results from an interposed population of inhibitory interneurons. Different relative delays will lead to different superpositions of constructive interference from each individual pathway. In particular, for the case of balanced excitatory and inhibitory feedback with τe=2/3τi, the constructive interference from each pathway occurs over the same frequency ranges, leading to super-resonances in the coherence, and thus in the information transfer. This is shown in Fig. 6(c) where the creation of such a superresonance near f =50 Hz is observed. Thus, a given neuron in this network with mixed delayed feedback can significantly enhance the coherence over a particular frequency range, all the while maintaining a constant mean firing rate, since it receives zero net current. We note that previous studies have looked at the effects of both excitatory and inhibitory feedback on spike train dynamics and system gain [9,10] but that results were obtained for the population activity. Our results below will show that they hold for the single neuron and we extend previous results by showing that these resonances manifest themselves in the coherence as well as the mutual information rate density.
VI. LIMITS OF THE APPROACH
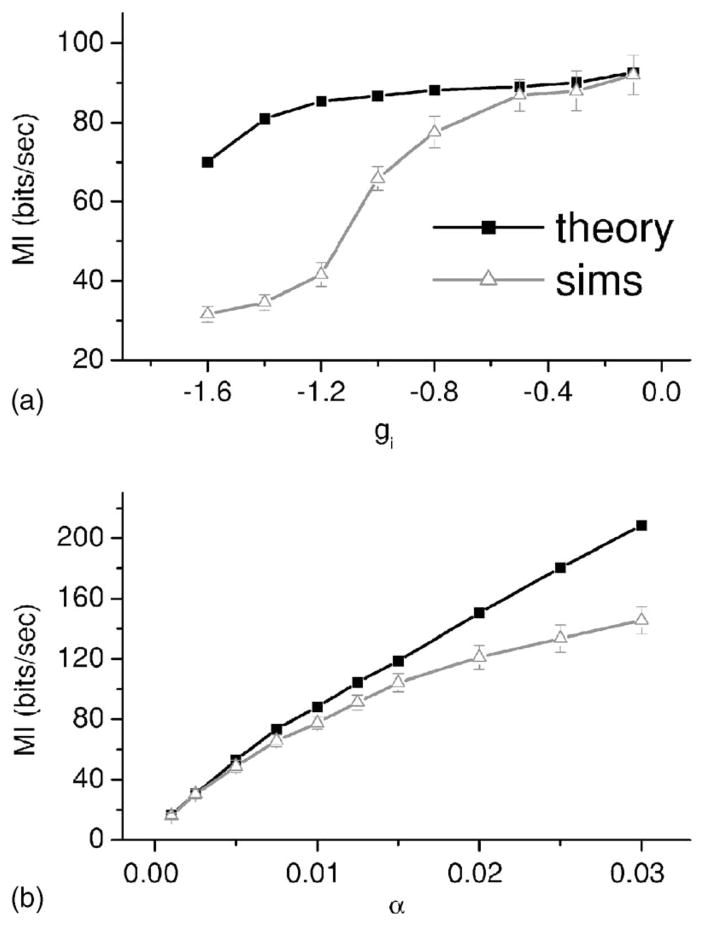
The linear response theory approach used here is expected to fail in parameter regimes where significant nonlinearities are caused by either the fluctuating input S(t), the feedback, or both. In order to test the limits of the approach, we varied both the feedback gain as well as the stimulus intensity. Figure 7(a) shows the mutual information rate MI obtained from numerical simulations as well as from the theory as a function of feedback gain. While both estimates agree well for small feedback strength, significant differences start to develop as the feedback gain approaches unity in magnitude. In particular, the theory tends to overestimate the information rate MI. Figure 7(b) shows MI as a function of stimulus intensity α. Again, both estimates agree well for small α as expected. However, significant differences appear for α >0.015 and the theory is again seen to overestimate the information rate. This overestimation has been observed before [27] and is due to the fact that nonlinearities will tend to reduce estimates of the coherence and thus of the mutual information rates themselves [24].
FIG. 7.
(a) Mutual information rate MI from numerical simulations (gray triangles) and from linear response theory (black squares) as a function of gain g(i). Other parameter values are the same as in Fig. 2 except N=20. (b) Mutual information rate MI from numerical simulations as a function of stimulus intensity α. Other parameter values are the same as in Fig. 2 except N=20. In both cases, deviations between numerical simulations and the theory are seen as nonlinearities increase due to feedback alone (a) and feedforward and feedback input (b). Error bars are shown on the simulation data.
This raises an important question: in what regime do real neurons in the brain operate? While neurons are clearly nonlinear devices, they are subjected to intense synaptic input in the brain that might linearize their transfer function. In order to provide some answers, we apply the theory to in vivo experimental data in the next section.
VII. APPLICATION OF LINEAR RESPONSE THEORY TO IN VIVO DATA
A. Experimental protocol
In this section, we will apply the theoretical equation (15) to experimental data obtained from sensory neurons in weakly electric fish. We will see that the results of the previous section provide a qualitative explanation for our experimental results. These fish use modulations of their self-generated electric field (EOD) to detect prey and communicate with conspecifics [35]. Electroreceptive neurons on their skin encode amplitude modulations of the EOD [36] and send this information to pyramidal cells in the electrosensory lateral line lobe (ELL) [37]. Pyramidal cells receive massive feedback input from higher brain centers as well [38]. The pyramidal cell network is thus ideal in order to study the effects of feedback on sensory processing [3,8,16,39].
The experimental protocol was described previously in detail [39,40]. Briefly, the fish is paralyzed by intramuscular curare injection and artificially respirated. Random amplitude modulations of its own EOD are delivered by electrodes far on each side of the animal and give rise to spatially uniform stimuli on each side. Spike trains from pyramidal cells were obtained from extracellular recordings. We used low-pass filtered white noise with fc=120 Hz. Pyramidal cells receive feedback input from two sources: one direct and one indirect [38]. Reversible blockade of indirect feedback input to pyramidal cells was achieved by pharmacology [39].
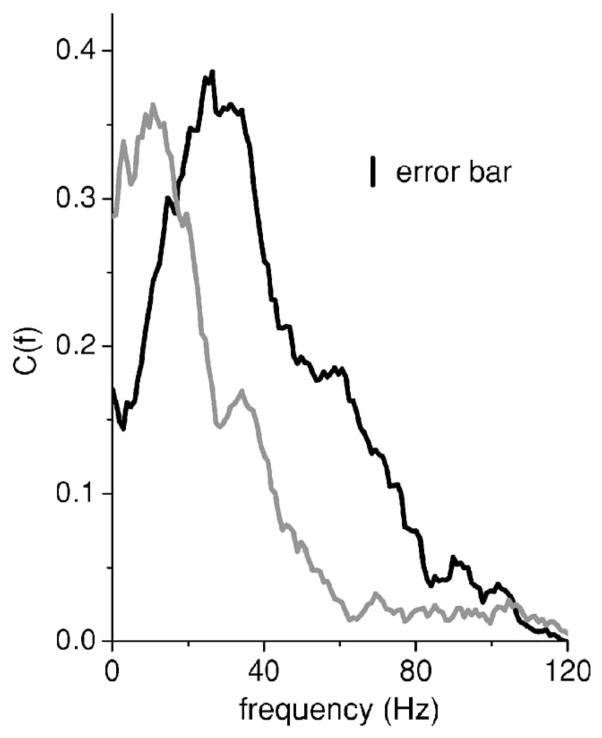
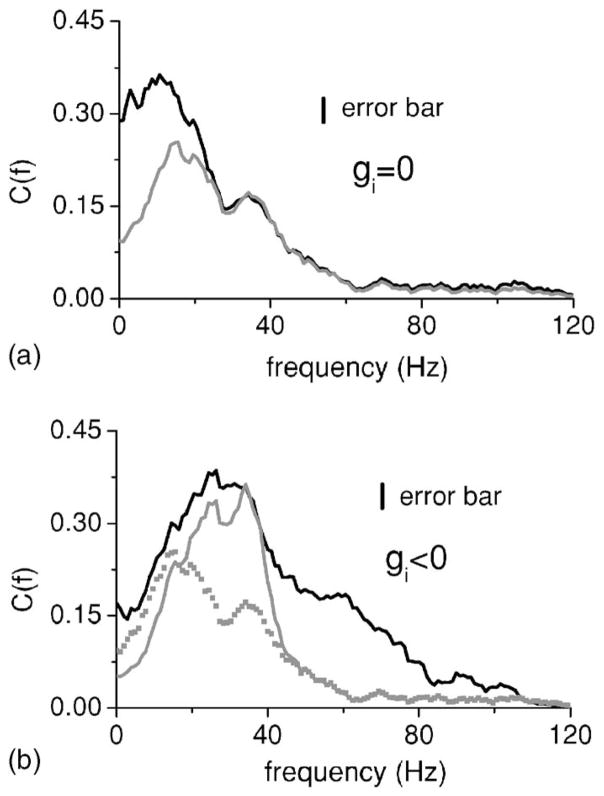
Data was gathered from Npyr=8 pyramidal cells. Figure 8 shows the coherence between the stimulus and obtained spike train from one pyramidal cell under control (i.e., intact feedback) (black) as well as during blockade (gray). Blocking this feedback input to this pyramidal cell radically changed its coherence function C(f), increasing it at low frequencies and decreasing the high frequency response. We can assume that this feedback is dominantly negative (see below). One could thus postulate that the effects of feedback input is to lower the coherence at low frequencies. Note that all pyramidal cells recorded from showed a qualitatively similar shift in their tuning after pharmacological treatment [39]. This was quantified by computing the average coherence values between 0–20 Hz and 40–60 Hz, Clow and Chigh, respectively [41]. Blocking feedback increased Clow by 53% on average (p<10−3, pairwise t test, n=8) and reduced Chigh by 53% on average (p=0.004, pairwise t test, n=8). Note that this is expected from our results for inhibitory feedback as seen in Figs. 2 and 6.
FIG. 8.
The coherence between the stimulus and the spike train of an ELL pyramidal cell under control (black) and pharmacological blockade of feedback (gray). Blocking feedback is seen to increase the coherence at frequencies <20 Hz and at the same time decrease the coherence at frequencies >20 Hz. The stimulus used had a cutoff frequency fc=120 Hz. Error bars are shown as a vertical line.
B. Assumptions
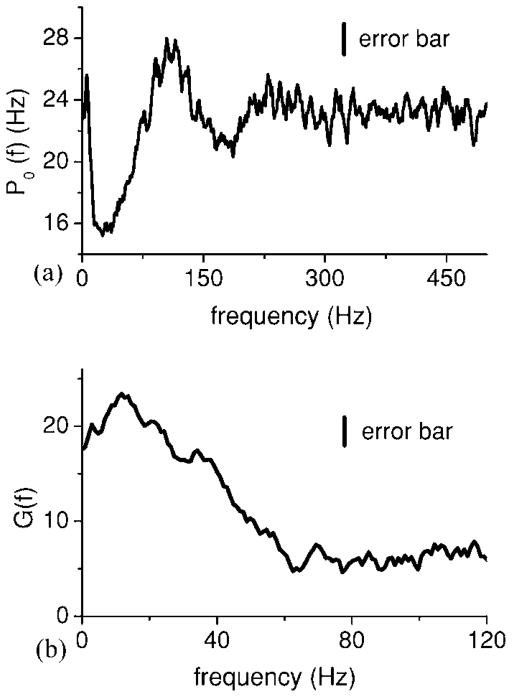
In order to apply Eq. (15) to this data, we need expressions for the baseline power spectrum P0(f) and the susceptibility χ̃(f). Although we are measuring the output of only one neuron, the biological situation actually corresponds to an active network of neurons. Both can be measured experimentally: we measured P0(f) from spontaneous activity (i.e., no stimulus) for this cell. The feedback pathways in the ELL require global stimulation (i.e., stimulation of the entire body surface) in order to be active [39]. Thus, we assume that the spontaneous activity is without feedback input as well. We measure the transfer function by computing 〈X̃(f)S̃*(f)〉/〈S̃(f)S̃*(f)〉 when feedback input was blocked. Figure 9(a) shows the baseline power spectrum P0(f) while Fig. 9(b) shows the absolute value of the Fourier transform of the susceptibility |χ̃(f)| or system gain G(f). Although there are heterogeneities in the pyramidal cell network [39,40], we will assume that the pyramidal cell network is homogeneous for the purpose of applying the theory.
FIG. 9.
(a) Baseline power spectrum P0(f) of this ELL pyramidal cell. One sees significant structure in the 0–120 Hz frequency range. (b) System gain G(f) under feedback blockade. Error bars are shown as a vertical bar.
We now use existing in vitro physiological and anatomical data in order to constrain the other parameters. Although the indirect feedback pathway makes both excitatory and inhibitory connections unto pyramidal cells, previous results [39,42] have shown that it had a net inhibitory role on sensory processing. We will thus assume for simplicity that ge =0 and thus only gi will be allowed to vary. The delay τi can be estimated from anatomy and is around τi =10 msec. The number of pyramidal cells has been estimated to be around N=1000 [43]. The function αi(t) can be estimated from the synaptic PSPs recorded in vitro [44]. We thus take the following form for αi (t):
| (21) |
with τ =5 msec [44]. The only unconstrained parameter is thus gi. It was found empirically that using gi=−3.5 gave the best agreement with the data. Using the measured values for P0(f), χ̃(f), αi(t), N, τi, we predicted the response of this pyramidal cell to stimuli with intact feedback.
C. Results
Figure 10(a) shows the prediction from Eq. (15) with blocked feedback (gray) as well as the raw data (black) with blocked feedback. This was done in order to test the validity of the theory at first without considering the effects of feedback. There is good qualitative agreement between the two curves as they have the same qualitative shape although the theory underestimates the coherence for frequencies below 30 Hz. The low coherence from the theory comes from the fact that the baseline power spectrum from this pyramidal cell had high power at low frequencies. Figure 10(b) shows the prediction from Eq. (15) (gray) as well as the raw data (black) with intact feedback. Although there are discrepancies at frequencies >40 Hz, the theory is able to qualitatively predict some of the increased response to high frequencies and the decreased response to low frequencies seen with the feedback intact. We note that linear response theory tends to overestimate the coherence function as nonlinearities will tend to reduce it [24].
FIG. 10.
(a) Comparison between data (black) and the prediction from Eq. (15) (gray) with feedback blocked (i.e., gk=0). There is a good qualitative agreement between the two curves. (b) Comparison between data (black) and the prediction from Eq. (15) in the presence of feedback (gray). The prediction with no feedback is also shown for comparison (gray squares). Again, good qualitative agreement with the data is seen in that the coherence at low frequencies is reduced and that the coherence at high frequencies is increased (compare with Fig. 8). Note the quantitative agreement between the peak of the black and gray lines. Error bars are shown as a vertical line for the experimental data.
Thus, we have shown that the theory developed in this paper could be applied successfully at least qualitatively to experimental data in order to predict the effects of feedback. Furthermore, comparison between Fig. 10 and Fig. 2(a) with inhibitory feedback shows a good qualitative agreement with the results from integrate-and-fire network model in the sense that, in both cases, inhibitory feedback is seen to reduce the coherence at low frequencies and increase it at high frequencies.
VIII. DISCUSSION
Neurons in vivo are constantly bombarded by synaptic input that can significantly alter their response properties in the absence of a recurrent feedback loop [45,46]. However, if recurrent feedback loops exist, then this synaptic bombardment is at least partly influenced by the neuron’s activity in the past. Our results show that delayed excitatory and inhibitory feedback alone or in combination can alter the dynamics as well as the information transfer properties of single neurons. In particular, both kinds of feedback will produce oscillations near specific frequencies in the spike train, as well as frequency-dependent changes in gain. This leads to resonances in the coherence, thus maximizing information transfer over certain frequency ranges. Other studies have computed either the system gain or power spectrum of the network activity for both excitatory and inhibitory delayed feedback [7,10]. Our results were obtained using the mutual information density and coherence function thus showing that resonances in both the gain and power spectrum actually increase the amount of information transmitted about a stimulus containing frequencies near these resonances.
It is well known from linear control theory that feedback can alter the transfer function of linear systems [47]. What was not clear prior to our study is how information about time-varying signals is conveyed by networks of noisy nonlinear elements (such as neurons) with delayed mixed feedback and how this is affected by the network size. Analyzing both the feedback dynamics as well as the gain of the noisy neurons has enabled us to demonstrate how feedback can alter frequency and information tuning of the network. Linear response theory reveals here that increased coherence at certain frequencies occurs at the expense of decreased coherence at other frequencies. Application of this theory to in vivo experimental data is straightforward and can lead to qualitatively correct predictions about the effects of inhibitory delayed feedback. Other approaches are valid only for infinite size networks [7] and use additional terms to deal with finite size networks [10] that are a priori not valid for small network size. We have shown that our approach was valid for any N as N is simply a parameter in the formulas presented here. The only limitation to our approach is that the feedback and stimulus strengths must be small in order to minimize the contributions of nonlinear terms. We also note that our approach is limited to frequencies that are smaller than the inverse time constant of the synaptic kernels [30].
While neurons are clearly nonlinear devices due to their spiking mechanisms, noise has been shown to linearize the neuronal transfer function [48] and neurons are subjected to a significant amount of noise in vivo [45]. This raises the interesting question as to whether this amount of noise is sufficient to have them operate in an essentially linear regime when subjected to naturalistic stimuli. The results presented here indicate that this is partially true for pyramidal cells in the ELL of weakly electric fish as nonlinearities are present and reduce linear estimates such as the coherence function as predicted from theory [24]. While this may not seem surprising at first glance since neurons are intrinsically nonlinear devices due to voltage-activated ion channels, linear response theory was sufficient to at least qualitatively explain the effects of feedback input to these cells observed in vivo.
Although the integrate-and-fire neuron model lacks a leak term and other currents, the predictions from the integrate-and-fire neuron network were in qualitative agreement with the experimental data. We furthermore note that similar effects to the ones seen with the integrate-and-fire neuron network can been observed with leaky integrate-and-fire and Hodgkin-Huxley neuron models although they require more parameter fitting (data not shown). Also, the effects of inhibitory feedback on the spike train power spectrum in an infinite size network observed here are qualitatively similar to those observed in [7,8] which used leaky integrate-and-fire neuron models.
The theory showed that the shaping of the coherence and information density functions occurred through averaging of the noise. Such noise shaping has been previously studied with respect to the spectrum of the output spike train in single neurons [49,50] and in neural nets with recurrent inhibition [50,51] as inspired by the electronics literature [52]. We note that only inhibitory connections with no explicit delay were taken into account in [51]. In our study, we have taken into account excitatory and inhibitory feedback with explicit delays, as well as the linear response of the intrinsically noisy nonlinear neuron to time-varying inputs. We have demonstrated that the noise shaping actually extends to the neural coherence function, and thus to the information throughput.
The architecture and connectivity of feedback pathways varies greatly depending on the particular brain area studied. The framework used here can be applied to an arbitrary number of neurons and be extended to any connectivity patterns. The only assumption is that the strength of both the feedback connections and stimulus be relatively weak and the noise not too small [25].
It is known that balanced feedforward excitation and inhibition can lead to gain control [53] as well as irregular firing [54] without affecting the mean firing rate. We have shown here that balanced feedback excitation and inhibition could, for physiologically reasonable parameter choices, enhance information transfer over certain frequency ranges. Thus, with balanced feedback excitation and inhibition, a neuron’s firing rate could remain the same while significantly changing its information transfer properties.
Acknowledgments
We thank B. Lindner for useful discussions. M.J.C. would like to thank Dr. J. Bastian for his help in gathering the data. This research was supported by the Canadian Institutes of Health Research (M.J.C, A.L., L.M.) and the Natural Science and Engineering Research Council (A.L.).
References
- 1.Cajal RS. Histologie du système nerveux de l’Homme et des vertébrés. Maloine; Paris: 1909. [Google Scholar]
- 2.Sillito AM, et al. Nature (London) 1994;369:479. doi: 10.1038/369479a0. [DOI] [PubMed] [Google Scholar]
- 3.Doiron B, Chacron MJ, Maler L, Longtin A, Bastian J. Nature (London) 2003;421:539. doi: 10.1038/nature01360. [DOI] [PubMed] [Google Scholar]
- 4.Macleod K, Laurent G. Science. 1996;274:976. doi: 10.1126/science.274.5289.976. [DOI] [PubMed] [Google Scholar]
- 5.Contreras D, et al. Science. 1996;274:771. doi: 10.1126/science.274.5288.771. [DOI] [PubMed] [Google Scholar]
- 6.Laing C, Longtin A. Neural Comput. 2003;15:2779. doi: 10.1162/089976603322518740. [DOI] [PubMed] [Google Scholar]
- 7.Treves A. Network. 1993;4:259. [Google Scholar]
- 8.Doiron B, Lindner B, Longtin A, Maler L, Bastian J. Phys Rev Lett. 2004;93:048101. doi: 10.1103/PhysRevLett.93.048101. [DOI] [PubMed] [Google Scholar]
- 9.Brunel N. J Comput Neurosci. 2000;8:183. doi: 10.1023/a:1008925309027. [DOI] [PubMed] [Google Scholar]
- 10.Mattia M, Del Giudice P. Phys Rev E. 2002;66:051917. doi: 10.1103/PhysRevE.66.051917. [DOI] [PubMed] [Google Scholar]; Phys Rev E. 2004;70:052903. [Google Scholar]
- 11.Wilson HR, Cowan JD. Biophys J. 1972;12:1. doi: 10.1016/S0006-3495(72)86068-5. [DOI] [PMC free article] [PubMed] [Google Scholar]
- 12.Amit DJ, Tsodyks M. Network. 1991;2:259. [Google Scholar]; Gerstner W. Phys Rev E. 1995;51:738. doi: 10.1103/physreve.51.738. [DOI] [PubMed] [Google Scholar]
- 13.Brunel N, Hakim V. Neural Comput. 1999;11:1621. doi: 10.1162/089976699300016179. [DOI] [PubMed] [Google Scholar]; Spiridon M, Gerstner W. Network. 1999;10:257. [PubMed] [Google Scholar]
- 14.Tuckwell HC. Nonlinear and Stochastic Theories. Cambridge University Press; Cambridge, UK: 1988. [Google Scholar]
- 15.Steriade M. TINS. 1999;22:337. doi: 10.1016/s0166-2236(99)01407-1. [DOI] [PubMed] [Google Scholar]
- 16.Berman NJ, Maler L. J Exp Biol. 1999;202:1243. doi: 10.1242/jeb.202.10.1243. [DOI] [PubMed] [Google Scholar]
- 17.Shannon CE. Bell Syst Tech J. 1948;27:379. [Google Scholar]
- 18.Rieke F, et al. Spikes: Exploring the Neural Code. MIT; Cambridge, MA: 1996. [Google Scholar]
- 19.Gabbiani F. Network. 1996;7:61. doi: 10.1080/0954898X.1996.11978655. [DOI] [PubMed] [Google Scholar]
- 20.Roddey JC, Girish B, Miller JP. J Comput Neurosci. 2000;8:95. doi: 10.1023/a:1008921114108. [DOI] [PubMed] [Google Scholar]; Passaglia CL, Troy JB. J Neurophysiol. 2004;91:1217. doi: 10.1152/jn.00796.2003. [DOI] [PMC free article] [PubMed] [Google Scholar]
- 21.Goychuk I. Phys Rev E. 2001;64:021909. doi: 10.1103/PhysRevE.64.021909. [DOI] [PubMed] [Google Scholar]
- 22.Theunissen F, et al. J Neurophysiol. 1996;75:1345. doi: 10.1152/jn.1996.75.4.1345. [DOI] [PubMed] [Google Scholar]
- 23.Wessel R, Koch C, Gabbiani F. J Neurophysiol. 1996;75:2280. doi: 10.1152/jn.1996.75.6.2280. [DOI] [PubMed] [Google Scholar]
- 24.Lindner B, Chacron MJ, Longtin A. Phys Rev E. 2005;72:021911. doi: 10.1103/PhysRevE.72.021911. [DOI] [PMC free article] [PubMed] [Google Scholar]
- 25.Risken H. The Fokker-Planck Equation. Springer; Berlin: 1996. [Google Scholar]
- 26.Lindner B, Schimansky-Geier L. Phys Rev Lett. 2001;86:2934. doi: 10.1103/PhysRevLett.86.2934. [DOI] [PubMed] [Google Scholar]
- 27.Chacron MJ, Lindner B, Longtin A. Phys Rev Lett. 2004;92:080601. doi: 10.1103/PhysRevLett.92.080601. [DOI] [PubMed] [Google Scholar]
- 28.Dykman MI, et al. Nuovo Cimento D. 1995;17:661. [Google Scholar]; Neiman A, Schimansky-Geier L, Moss F. Phys Rev E. 1997;56:R9. [Google Scholar]; Neiman A, Silchenko A, Anishchenko V, Schimansky-Geier L. Phys Rev E. 1998;58:7118. [Google Scholar]
- 29.McNamara B, Wiesenfeld K. Phys Rev A. 1989;39:4854. doi: 10.1103/physreva.39.4854. [DOI] [PubMed] [Google Scholar]
- 30.Fourcaud N, Brunel N. Neural Comput. 2002;14:2057. doi: 10.1162/089976602320264015. [DOI] [PubMed] [Google Scholar]
- 31.Holden AV. Models of the Stochastic Activity of Neurons. Springer; Berlin: 1976. [Google Scholar]
- 32.Bressloff PC, Coombes S. Neural Comput. 2000;12:91. doi: 10.1162/089976600300015907. [DOI] [PubMed] [Google Scholar]
- 33.van Vreeswijk C, Hansel D. Neural Comput. 2001;13:959. doi: 10.1162/08997660151134280. [DOI] [PubMed] [Google Scholar]
- 34.Krahe R, Gabbiani F. Nat Rev Neurosci. 2004;5:13. doi: 10.1038/nrn1296. [DOI] [PubMed] [Google Scholar]
- 35.Turner RW, Maler L, Burrows M. J Exp Biol. 1999;202:1167. doi: 10.1242/jeb.202.10.1255. [DOI] [PubMed] [Google Scholar]
- 36.Bastian J. J Comp Physiol [A] 1981;144:465. [Google Scholar]
- 37.Maler L. J Comp Neurol. 1979;183:323. doi: 10.1002/cne.901830208. [DOI] [PubMed] [Google Scholar]; Maler L, Sas EK, Rogers J. J Comp Neurol. 1981;195:87. doi: 10.1002/cne.901950107. [DOI] [PubMed] [Google Scholar]
- 38.Sas EK, Maler L. J Comp Neurol. 1983;221:127. doi: 10.1002/cne.902210202. [DOI] [PubMed] [Google Scholar]; Sas EK, Maler L. Anat Embryol (Berl) 1987;177:55. doi: 10.1007/BF00325290. [DOI] [PubMed] [Google Scholar]
- 39.Bastian J, Chacron MJ, Maler L. Neuron. 2004;41:767. doi: 10.1016/s0896-6273(04)00071-6. [DOI] [PubMed] [Google Scholar]; Chacron MJ, Maler L, Bastian J. J Neurosci. 2005;25:5521. doi: 10.1523/JNEUROSCI.0445-05.2005. [DOI] [PMC free article] [PubMed] [Google Scholar]
- 40.Bastian J, Chacron MJ, Maler L. J Neurosci. 2002;22:4577. doi: 10.1523/JNEUROSCI.22-11-04577.2002. [DOI] [PMC free article] [PubMed] [Google Scholar]
- 41.Chacron MJ, Doiron B, Maler L, Longtin A, Bastian J. Nature (London) 2003;423:77. doi: 10.1038/nature01590. [DOI] [PubMed] [Google Scholar]
- 42.Bastian J. J Neurosci. 1986;6:553. doi: 10.1523/JNEUROSCI.06-02-00553.1986. [DOI] [PMC free article] [PubMed] [Google Scholar]
- 43.Shumway C. J Neurosci. 1989;9:4400. doi: 10.1523/JNEUROSCI.09-12-04400.1989. [DOI] [PMC free article] [PubMed] [Google Scholar]
- 44.Berman NJ, Maler L. J Neurophysiol. 1998;80:3214. doi: 10.1152/jn.1998.80.6.3214. [DOI] [PubMed] [Google Scholar]
- 45.Destexhe A, Paré D. J Neurophysiol. 1999;81:1531. doi: 10.1152/jn.1999.81.4.1531. [DOI] [PubMed] [Google Scholar]
- 46.Anderson JS, et al. Science. 2000;290:1968. doi: 10.1126/science.290.5498.1968. [DOI] [PubMed] [Google Scholar]
- 47.Desoer CA, Vidyasagar M. Feedback Synthesis: Input-Output Properties. Academic Press; New York: 1975. [Google Scholar]
- 48.Stemmler M. Network. 1996;7:687. [Google Scholar]; Chialvo DR, Longtin A, Muller-Gerking J. Phys Rev E. 1997;55:1798. [Google Scholar]; Chacron MJ, Longtin A, St-Hilaire M, Maler L. Phys Rev Lett. 2000;85:1576. doi: 10.1103/PhysRevLett.85.1576. [DOI] [PubMed] [Google Scholar]
- 49.Shin J. Int J Electron. 1993;74:359. [Google Scholar]
- 50.Shin J. Neural Networks. 2001;14:907. doi: 10.1016/s0893-6080(01)00077-6. [DOI] [PubMed] [Google Scholar]
- 51.Mar DJ, et al. Proc Natl Acad Sci USA. 1999;96:10450. doi: 10.1073/pnas.96.18.10450. [DOI] [PMC free article] [PubMed] [Google Scholar]
- 52.Norsworthy SR, Schreier R, Temes GC, editors. Delta-Sigma Data Converters. IEEE Press; Piscataway, NJ: 1997. [Google Scholar]
- 53.Chance FS, Abbott LF, Reyes AD. Neuron. 2002;35:773. doi: 10.1016/s0896-6273(02)00820-6. [DOI] [PubMed] [Google Scholar]
- 54.Softky WR, Koch C. J Neurosci. 1993;13:334. doi: 10.1523/JNEUROSCI.13-01-00334.1993. [DOI] [PMC free article] [PubMed] [Google Scholar]; Salinas E, Sejnowski TJ. J Neurosci. 2000;20:6193. doi: 10.1523/JNEUROSCI.20-16-06193.2000. [DOI] [PMC free article] [PubMed] [Google Scholar]; Gerstner W. Spiking Neuron Models-Single Neurons, Populations, Plasticity. Cambridge University Press; Cambridge, UK: 2002. [Google Scholar]


