Abstract
It is well known that some neurons tend to fire packets of action potentials followed by periods of quiescence (bursts) while others within the same stage of sensory processing fire in a tonic manner. However, the respective computational advantages of bursting and tonic neurons for encoding time varying signals largely remain a mystery. Weakly electric fish use cutaneous electroreceptors to convey information about sensory stimuli and it has been shown that some electroreceptors exhibit bursting dynamics while others do not. In this study, we compare the neural coding capabilities of tonically firing and bursting electroreceptor model neurons using information theoretic measures. We find that both bursting and tonically firing model neurons efficiently transmit information about the stimulus. However, the decoding mechanisms that must be used for each differ greatly: a non-linear decoder would be required to extract all the available information transmitted by the bursting model neuron whereas a linear one might suffice for the tonically firing model neuron. Further investigations using stimulus reconstruction techniques reveal that, unlike the tonically firing model neuron, the bursting model neuron does not encode the detailed time course of the stimulus. A novel measure of feature detection reveals that the bursting neuron signals certain stimulus features. Finally, we show that feature extraction and stimulus estimation are mutually exclusive computations occurring in bursting and tonically firing model neurons, respectively. Our results therefore suggest that stimulus estimation and feature extraction might be parallel computations in certain sensory systems rather than being sequential as has been previously proposed.
Keywords: electroreceptor, burst, information theory, feature detection, neuron
1. Introduction
Some neurons have the ability to fire packets of action potentials followed by long periods of quiescence, a feature known as bursting that is in contrast to repetitive “tonic” firing of action potentials. It is known that some neurons can display both bursting and tonic firing modes (Turner et al., 1994; Wang and Rinzel, 1995; Sherman, 2001) depending on the particular input. Moreover, neurons at the same stage of processing can often be subdivided into bursting and tonically firing subgroups (Goldberg, 2000; Bastian and Nguyenkim, 2001). Although the particular dynamics that can lead to bursting behavior are generally well understood (Wang and Rinzel, 1995; Izhikevich, 2000), their role in sensory processing remains poorly understood. Furthermore, the relative computational advantages of bursting and tonically firing neurons have not been clearly established. While it has been shown that both tonically firing and bursting neurons can encode information (Reinagel et al., 1999), one possible function of bursting is to detect specific stimulus features and some results do support this hypothesis (Gabbiani et al., 1996; Sherman, 2001; Kepecs et al., 2002). On the other hand, bursting behavior might simply be used to improve synaptic reliability (Lisman, 1997).
Our study quantitatively establishes distinct roles for bursting and tonically firing neurons. We use the well-characterized electroreceptor neurons of the weakly electric fish Apteronotus leptorhynchus (Turner et al., 1999). It has been shown experimentally that some electroreceptors fire in a tonic manner while others display bursting dynamics (Bastian, 1981; Xu et al., 1996). These neurons are driven by the same sensory input and thus provide an ideal framework for examining neural coding by bursting and tonically firing neurons.
We compare results on stimulus estimation and feature extraction obtained from two neurons: one that tends to fire packets of action potentials (bursts), henceforth referred to as B and one that is tonically firing, henceforth referred to as T. Our study uses the stimulus reconstruction technique (Rieke et al., 1996) and a novel measure of feature extraction (Chacron, 2003). We also use information theory (Borst and Theunissen, 1999) to quantify the amount of information transmitted by each neuron. This information can be computed in two ways: the direct method of computing the mutual information makes no assumptions on the nature of the neural code while the indirect method assumes a linear decoder (Rieke et al., 1996; Borst and Theunissen, 1999) and thus computes a lower bound to the rate of information transmission (Theunissen et al., 1996). We compare results obtained using both methods to estimate the amount of information that can be decoded through both linear and non-linear means. However, the direct method of estimating information transfer requires vast amounts of data. We thus use model neurons that both qualitatively and quantitatively reproduce experimental data from both bursting (Chacron et al., 2001a) and tonically firing (Chacron et al., 2000, 2001a) electroreceptor neurons. This approach has the advantage that we have more control over the responses of each model neuron to identical stimuli. We can therefore look only at the effects of bursting vs. tonic firing on information transfer without concomitant changes in mean firing rate that have been shown to affect information transfer (Wessel et al., 1996; Borst and Haag, 2001).
2. Materials and Methods
2.1. The Model
We use an accurate phenomenological model of P-unit activity. The model was shown to successfully reproduce baseline and stimulated dynamics of non-bursting P-unit activity (Chacron et al., 2000, 2001b). A simple extension to the model was shown to reproduce baseline activity for a bursting P-unit and was further biophysically justified (Chacron et al., 2001a). Briefly, the model is described by the following equations and firing rules (see ref. Chacron et al. (2001b) for a full description and biophysical justification using the same notation):
where v is the membrane potential, θ is the threshold, and τv, τw, θ0 are parameters. An action potential is said to have occurred when voltage equals threshold. Immediately after, the voltage is reset to zero while the threshold is incremented by a constant Δθ from its value at the firing time. After the absolute refractory period Tr, the threshold decays exponentially until the next action potential. The model is similar to the leaky integrate-and-fire neuron except that the threshold is also a dynamical variable. The current Isyn is given by:
where X(t) is a filtered version of the electric organ discharge (EOD) amplitude A(t) minus its baseline value A0, β and γ are constants, and fEOD is the EOD frequency. Θ denotes the Heaviside function (Θ(x) = 1 if x ≥ 0 and Θ(x) = 0 otherwise) and is used here for half-wave rectification by synapses. The amplitude modulation A(t) is transformed into X(t) using a filter developed from experimental data by Nelson et al. (1997). λ1, λ2 are noise terms needed to accurately model the variability seen experimentally in these P-units: they are Ornstein-Uhlenbeck (i.e. low-pass filtered Gaussian white noise) processes (Gardiner, 1985) with respective time constants τ1, τ2 and intensities D1, D2 (Chacron et al., 2001b). Ib is an additive current used to produce bursting dynamics that works as follows: Ib activates instantaneously (i.e. it is incremented by a constant ΔIb) after a delay d following an action potential. The current then inactivates exponentially with time constant τb (see Chacron et al. (2001a) for a full description and biophysical justification of the current Ib). The current Ib is thus governed by the equation:
where tlast is the time at which the last action potential occurred and δ is the delta function. Parameter values are given in Table 1. The filter values were the same as those used in Chacron et al. (2001b).
Table 1.
| T | B | |
|---|---|---|
| dt | 0.025 ms | 0.025 ms |
| τv | 1 ms | 1 ms |
| τθ | 7.75 ms | 9.2 ms |
| A0 | 0.8 mV | 0.8 mV |
| γ | 0.3266 (mV)−1 | 0.3266 (mV)−1 |
| β | 0.5 s/spikes | 0.5 s/spikes |
| D1 | 4 ms−2 | 6.25 ms−2 |
| D2 | 9 × 10⁻⁶ ms−2 | 1.6 × 10⁻⁵ ms−2 |
| τ1 | 0.025 ms | 0.025 ms |
| τ2 | 50000 ms | 50000 ms |
| θ0 | 0.03 | 0.03 |
| Δθ | 0.05 | 0.05 |
| ΔIb | 0 | 1.5 |
| τb | 0.09 ms | 0.09 ms |
| D | 0.4 ms | 0.4 ms |
2.2. Burst Criterion
Our criterion for distinguishing a burst event was the following: two consecutive spikes were considered part of a burst if the interspike interval was less than 1.5 EOD cycles. This criterion is natural in our case as bursts are firings on consecutive EOD cycles, as reflected in the bimodal nature of the interspike interval histogram for the bursting P-unit. Furthermore, spike timing jitter in the pyramidal neurons that electroreceptor neurons synapse onto is on the order of the EOD cycle (Chacron et al., 2003b) suggesting that these bursts might be decoded by the higher brain. Such a criterion has already been used to classify bursts (Gabbiani et al., 1996; Kepecs et al., 2002).
2.3. Information Theory and Stimulus Estimation
Information theory was originally developed in the context of communication theory (Shannon, 1948). There are several ways of determining estimates for the mutual information rate (Borst and Theunissen, 1999). We first describe the indirect method, that aims at estimating the mutual information indirectly through the stimulus reconstruction technique. The goal is to estimate the stimulus that gave rise to a particular train of action potentials (Rieke et al., 1996) through the use of reconstruction filters. Linear stimulus reconstruction aims at determining the optimal linear filter that minimizes the mean square error ε2 between the original stimulus s and the reconstructed stimulus sest when convolved with the spike train. The quality of the reconstruction is assessed by computing ε2. It can be shown that (Gabbiani, 1996), for Gaussian stimuli, the reconstruction error is always less than or equal to the stimulus standard deviation σ which will be henceforth referred to as the stimulus intensity. We can thus compute the coding fraction CF = 1−ε/σ which measures the fraction of the stimulus that can be reconstructed from the spike train (Gabbiani and Koch, 1996).
An estimate for the mutual information rate based on linear decoding can be obtained (Rieke et al., 1996). It is given by:
where C(f) ≡ |Psx(f)|2/[Pxx(f) Pss(f)] is the coherence function. Pss(f) and Pxx(f) are respectively the stimulus and spike train power spectra while Psx(f) is the cross-spectrum between the spike train x and the stimulus s. These were calculated with a binwidth of half an EOD cycle. Iindirect is a lower bound for the mutual information rate because it assumes that all information can be decoded in a linear fashion.
We thus also use the direct method of estimating information transfer (Strong et al., 1998) that makes no assumptions on the nature of the neural code. The methods used to compute this measure are based on the difference between the response entropy rate H(R) and the response entropy rate given the stimulus H(R/S) and have been described in detail elsewhere (Strong et al., 1998; Chacron et al., 2001b, 2003a).
2.4. Feature Detection
For neurons to be feature detectors, their bursts must be strongly correlated to certain features in the stimulus. It has previously been shown that the E-type pyramidal cells receiving excitatory input from electroreceptive afferents (Gabbiani et al., 1996; Metzner et al., 1998) perform feature detection of rising phases in the time-varying stimulus. We thus focus on the rising phase during which the P-receptor afferents preferentially fire (Bastian, 1981). Hence, bursts should occur preferentially during the rising phase. We define κ1 as the fraction of bursts that occur on a rising phase (i.e. the number of bursts that occurred during a rising phase divided by the total number of bursts). However, we must also address the issue of reliability (i.e. are most rising phases associated to at least one burst). We hence define κ2 as the fraction of rising phases during which a burst occurred (i.e. the number of rising phases during which a burst occurred divided by the total number of rising phases). We take κ = κ1 * κ2 as a measure of feature detection and encoding by bursts (Chacron, 2003). It is thus a number between 0 and 1 that indicates the efficiency of a bursting neuron at encoding features such as rising phases in our case. We calculated κ based on a 100 second long simulation with a time-varying stimulus. Rising phases were taken as portions of the stimulus during which the time-derivative was positive. If a burst started during a rising phase, then it was considered correlated with that rising phase.
3. Results
3.1. Calibration
It is important for comparison purposes to ensure that both model neurons have near identical averaged responses in the absence and presence of stimuli.
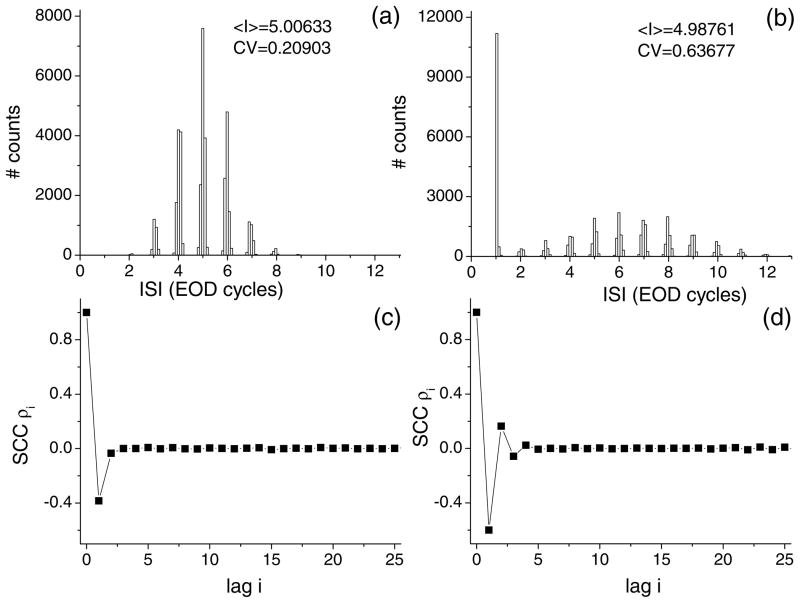
ISI histograms for baseline activity (i.e. with the EOD only) are shown in Fig. 1. Both show modes around multiples of the EOD period characteristic of phase-locking in these units and are similar to representative units of both classes (Xu et al., 1996; Chacron et al., 2000, 2001a). T (Fig. 1(a)) tends to fire single spikes but skip a variable number of EOD cycles between each firing (Xu et al., 1996; Chacron et al., 2000, 2001a). On the other hand, B has a high peak at one EOD cycle and has another local maximum at 6 EOD cycles (Fig. 1(b)): this implies that B tends to fire action potentials on consecutive EOD cycles (bursts) followed by a variable period of quiescence. We take an ISI threshold criterion to distinguish bursts from single spikes (Gabbiani et al., 1996; Kepecs et al., 2002) and set the ISI threshold value to 1.5 EOD cycles. Parameters for the model were chosen such that both units have the same firing rate for baseline activity. However, the inter-spike interval histogram for B has a higher co-efficient of variation (the standard deviation to mean ratio) than the ISI histogram for T (Fig. 1). The inter-spike interval serial correlation coefficients are shown in Figs. 1(c) and (d) for T and B respectively. Tonically firing electroreceptors typically have a negative serial correlation coefficient at lag one (Chacron et al., 2000, 2001a). On the other hand, bursting electroreceptors show correlation coefficients that alternate in sign and decay over a few lags (Chacron et al., 2001a). These ISI correlations have been shown to play an important role in information transfer (Chacron et al., 2001b, 2004; Longtin et al., 2003). Furthermore, negative ISI correlations tend to reduce spike train variability while positive correlations will tend to increase variability (Middleton et al., 2003). B is thus more variable than T.
Figure 1.
Baseline activity obtained for both model neurons. (a) Unimodal ISI histogram obtained for T. 〈I〉 is the mean ISI and CV is the coefficient of variation defined as the standard deviation-to-mean ratio of the ISI distribution. (b) Bimodal ISI histogram obtained for B. Note that 〈I〉 is approximately the same for T and B. B is however more variable than T as indicated by the higher CV value. (c) ISI correlation coefficients as a function of lag for T. The coefficient at lag one is negative as is typically seen experimentally in these units. (d) ISI correlation coefficients as a function of lag for B. These coefficients decay over a few lags and alternate in sign as is seen experimentally. The EOD frequency was set to 1000 Hz.
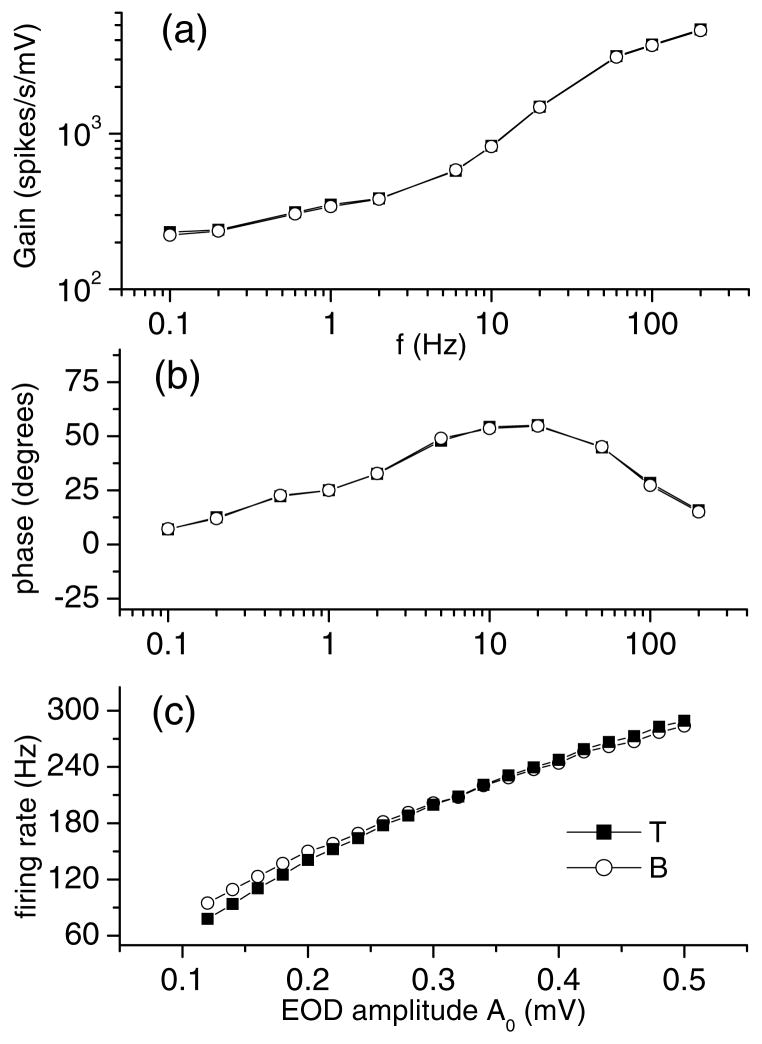
To further ensure a fair comparison for time varying input, the gain and phase response curves (Nelson et al., 1997) were calculated for both models for sinusoidal amplitude modulations of the EOD with frequencies ranging from 0.1 to 200 Hz (Figs. 2(a) and (b)). Such methods have been used to quantify the response of electroreceptors for different frequencies experimentally and to calibrate models (Nelson et al., 1997; Kreiman et al., 2000). We use it here to ensure that both model neuron’s responses match over the behaviorally relevant frequency range of amplitude modulations. The values of gain and phase obtained for B and T agree well and further lie in the physiological range (Nelson et al., 1997). The frequency of firing is approximately related linearly to the EOD amplitude (Fig. 2(c)) over the entire range used in this study, and again the curves obtained for each model neuron agree well.
Figure 2.
Calibration for both models as a function of stimulus frequency and intensity. (a) Gain as a function of the frequency of the sinusoidal amplitude modulation for both units. The curves are similar to those obtained experimentally and the values are in the physiological range. (b) Phase difference between the stimulus and the response as a function of frequency. The curve is again quantitatively similar to those obtained experimentally. (c) Firing rate as a function of baseline EOD amplitude A0 for both units. The curves are approximately linear and equal over the entire range of amplitude modulations used in this study.
3.2. Information Theory: Linear versus Nonlinear Coding
It is important to compute the mutual information in a way that makes fewer assumptions on the neural code. The direct method of estimating information (Strong et al., 1998) will provide such an estimate. Alternatively, one can use the indirect method to obtain a lower bound on information transfer since this measure relies on linear decoding (Gabbiani, 1996; Rieke et al., 1996). One can thus use the direct method to gauge the goodness of the lower bound estimate obtained with the indirect method (Borst and Theunissen, 1999). A difference between the lower bound and the direct method indicates that some features of the stimulus might be decoded in a non-linear manner.
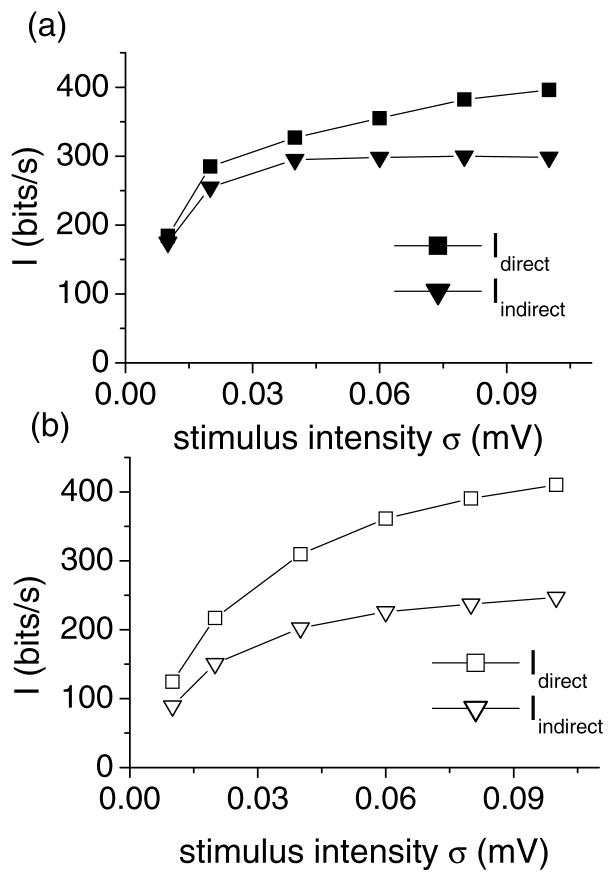
Both estimates Idirect and Iindirect are shown for T in Fig. 3(a). Comparing the two estimates reveals that at least 75% of Idirect (300 bits/sec out of 400 bits/sec) can be decoded by linear means. Figure 3(b) shows the same quantities for B. The same comparison reveals that for B the minimum available information that can be decoded by linear means is now only 50% (200 bits/sec out of 400 bits/sec).
Figure 3.
Mutual information rates for tonic and bursting neurons. (a) Mutual information rates Idirect and Iindirect as a function of stimulus intensity for a 100 Hz cutoff frequency for the tonically firing neuron T. (b) Mutual information rates Idirect and Iindirect as a function of stimulus intensity for a 100 Hz cutoff frequency for the bursting neuron B.
Our results are consistent with those obtained in Buracas et al. (1998) which show a difference between the direct and indirect methods of estimating information rates. Our results further imply that information from bursting neurons can only be efficiently decoded by non-linear means while linear decoding will be effective for tonic neurons.
3.3. Stimulus Reconstruction
We first used the stimulus reconstruction technique (Gabbiani, 1996; Rieke et al., 1996) to assess the ability of each unit to transmit information about a time-varying stimulus. The quality of the reconstruction is assessed by computing the coding fraction (Gabbiani, 1996) which is the fraction of the stimulus time course encoded by the neuron. We used low-pass filtered Gaussian stimuli of various intensities and cutoff frequencies (Chacron et al., 2003b) to assess the quality of encoding of these neurons at various behaviorally relevant frequencies: this type of stimulus has been already widely used in studies of information transfer by neurons (Gabbiani et al., 1996; Rieke et al., 1996; Wessel et al., 1996; Kreiman et al., 2000). The animal must detect a wide range of stimulus frequencies. This comprises low frequency (such as those caused by prey or by other fish of the same sex: as low as 2 Hz) (Heiligenberg, 1991; Nelson and MacIver, 1999) as well as high frequency (such as electrocommunication signals and those caused by fish of the other sex: greater than 100 Hz) (Zupanc and Maler, 1993). We thus varied the cutoff frequency of the stimulus between 2 and 200 Hz to assess the quality of encoding over the frequency range. We also varied the stimulus intensity between 0.01 to 0.1 mV to assess the quality of encoding for weak vs. strong stimuli.
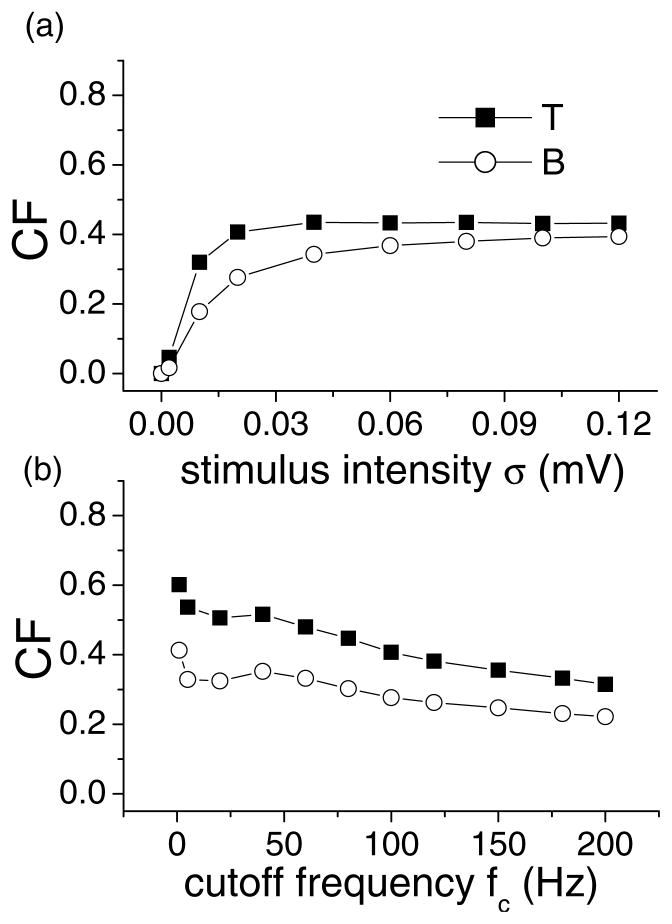
The coding fractions obtained for both types of units are shown in Fig. 4. The coding fraction is seen to increase with stimulus intensity for constant cutoff frequency (Fig. 4(a)). Stronger stimuli reduce the intrinsic variability of the neuron and thus allow for a better estimate of the stimulus. Our results are consistent with previously obtained ones (Kreiman et al., 2000) was found the same trend in an experimental study of a related species of electric fish. Our results show that the coding fraction for B was lower than for T. The difference between the two is maximal for low stimulus intensity σ. At a constant σ, the coding fraction estimates obtained for B and T decrease as a function of cutoff frequency (Fig. 4(b)). Most strikingly, T always showed better stimulus estimation than B. Thus, the extra variability of the bursting unit is detrimental to stimulus reconstruction over the entire frequency and intensity range.
Figure 4.
Stimulus estimation for a bursting and tonically firing neuron. (a) Coding fraction as a function of stimulus intensity for a 100 Hz cutoff frequency. (b) Coding fraction as a function of cutoff frequency for a 0.02 mV intensity. The tonic neuron outperforms the bursting one over a broad intensity and frequency ranges.
3.4. Feature Detection
In order to compare B and T abilities at detecting particular features, we used a novel feature detection measure κ (see Chacron (2003) and methods) that takes into account the following: (1) if bursts are to code for certain features in the stimulus, they must be correlated only to that feature; (2) the mechanism must be reliable (i.e. most if not all features should be encoded by bursts). As it has been shown that bursts could encode the rising phases of the stimulus (Gabbiani et al., 1996; Kepecs et al., 2002), we thus measure the probability of a burst occurring during the rising phase of the stimulus κ1 (correlation) and the probability of a rising phase having at least one burst associated to it κ2 (reliability). The measure κ = κ1 * κ2 can thus take values between zero and one and measures the efficiency of encoding features by bursts (Chacron, 2003).
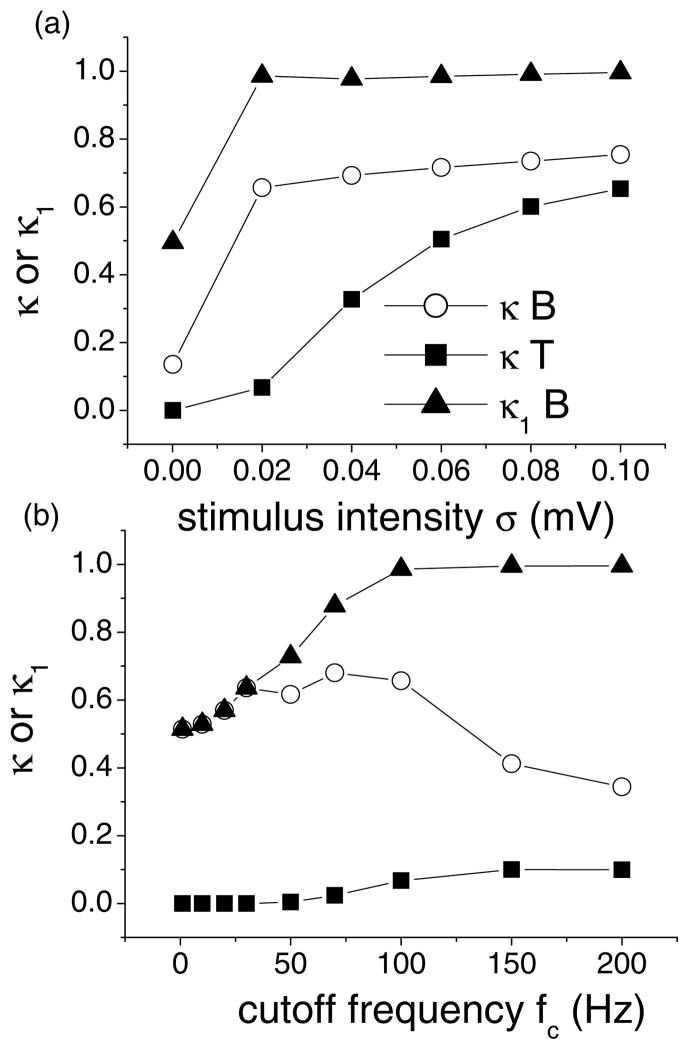
We calculated κ for both units as a function of stimulus cutoff frequency and intensity. The results are shown in Fig. 5. For constant cutoff frequency (Fig. 5(a)), B significantly outperforms T over the entire intensity range. Looking at the measure κ1 (correlation) for B, we see that it is equal to 0.5 for low cutoff frequencies (Fig. 5(b)). However, it increases and becomes nearly one for high cutoff frequencies. There is thus a gradual transition from disorder (the bursts occur randomly) to order (the bursts occur almost exclusively on the rising phase of the stimulus) as the effective stimulus intensity increases with cutoff frequency because of the high-pass filtering characteristics included in both models (Nelson et al., 1997; Chacron et al., 2001b). This is due to a competition between the stimulus and the intrinsic burst mechanism of B. B also significantly outperforms T over a wide range of cutoff frequencies (Fig. 5(b)).
Figure 5.
Feature detection for a bursting and tonically firing neuron. (a) κ for B and T and κ1 for B as a function of intensity for a 100 Hz cutoff frequency. (b) κ for B and T and κ1 for B as a function of cutoff frequency for a 0.02 mV intensity. It is seen that the bursting neuron B outperforms the tonic one T.
The situation is very different for T. It is possible to get stimulus-evoked bursting but this occurs only for sufficiently high intensity and cutoff frequency values: there is thus a “burst threshold” before which there is no bursting and after which we get evoked bursting since our criterion for distinguishing bursts is only based on ISI values rather than intrinsic dynamics. These “bursts” are purely stimulus-driven and are thus perfectly correlated to the stimulus. The measure κ1 is thus always equal to one (Fig. 5(b)) and thus κ = κ2 is a measure of reliability of detecting features by bursts. Reliability κ2 is very much an issue for T as indicated by the low κ values obtained over the entire frequency range for low intensity (Fig. 5(b)). For high cutoff frequencies, we are then in a regime where the stimulus dominates: thus both B and T perform similarly.
We conclude that B is always better at encoding features of the stimulus than T, even in regimes where it is possible to get evoked bursting from T. This is because the reliability of B is always greater or equal than that of T, due to the intrinsic bursting mechanism and because a transition occurs in B in which the bursts occur preferentially on the rising phase of the stimulus.
3.5. From Stimulus Estimation to Feature Extraction
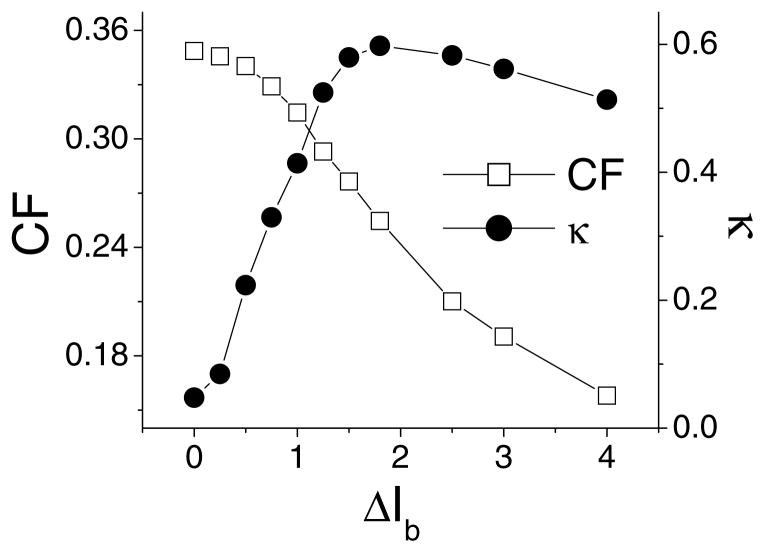
In order to verify whether stimulus estimation and feature extraction are mutually exclusive as suggested in the visual system (Sherman, 2001), we varied the parameter “ΔIb” (see methods) controlling the amount of positive feedback in the model and thus controlling bursting (see methods). The coding fraction CF and κ are plotted as a function of ΔIb in Fig. 6. When ΔIb = 0, we are in a tonically firing mode and coding fraction is high while κ is relatively low. As ΔIb is increased, we rapidly transition into a bursting regime: it is then observed that the coding fraction decreased while κ increases. κ then saturates, while the coding fraction continues to decrease. This shows that stimulus estimation and feature extraction might indeed be anti-correlated in these sensory neurons as the bursting parameter is varied.
Figure 6.
From stimulus estimation to feature detection. Coding fraction and feature measure κ as a function of bursting parameter ΔIb. We used a intensity of 0.02 mV and a cutoff frequency of 100 Hz. Turning a tonically firing neuron into a bursting one reduces its ability to estimate a stimulus while increasing its ability to detect particular features.
4. Discussion
4.1. Comparison of Bursting and Tonic Dynamics
We have compared results obtained from two models of electroreceptors: one was bursting while the other was tonic. Parameter values were chosen such that the two units had the same firing rates. Moreover, the gain and phase values for sinusoidal modulations of the EOD amplitude over the behaviorally relevant range of 0.1–200 Hz were essentially the same for each model. This helped ensure that the mean firing rate response was the same for both models over the frequency range of stimuli used in this study; hence the only difference between the two models was the fact that one tended to fire packets of action potentials (bursts) and thus had a higher variability than the other neuron.
4.2. Bursting Neurons are Non-Linear
We have compared the direct and indirect methods of information transfer in order to gauge the amount of information that could be decoded linearly. Our results show that information from a bursting neuron must be decoded non-linearly while a linear decoder could suffice for a tonically firing one. The decoding scheme proposed in Lisman (1997) is non-linear in nature and our results are consistent with the hypothesis that bursts could reduce synaptic unreliability.
4.3. Stimulus Reconstruction vs. Feature Extraction
We first considered the issue of encoding the detailed time course of a stimulus and thus used the stimulus reconstruction technique. The coding fraction obtained for tonic firing was higher than the one obtained for bursting over the entire frequency and intensity range used for this study. This agreed with other results on bursting in the LGN (Reinagel et al., 1999). This further agreed with the fact the bursting neurons are poor stimulus estimators (Gabbiani et al., 1996) due to their higher variability.
We then used a measure of efficiency in signaling particular features of the stimulus. Our results showed that the bursting neurons had a significantly greater efficiency than tonic ones. Varying a parameter in the model that controlled bursting showed that stimulus estimation and feature extraction were indeed mutually exclusive as proposed by Sherman (2001).
It has generally been thought that sensory neurons at the periphery should be able to encode the detailed time course of the stimulus, while neurons at a higher stage would extract certain features (Gabbiani et al., 1996; Metzner et al., 1998). However, sensory neurons at the periphery display considerable variability in several sensory systems (Xu et al., 1996; Goldberg, 2000). As this variability includes differential bursting dynamics, we thus suggest that stimulus estimation and feature extraction might not only occur in sequence as previously proposed (Gabbiani et al., 1996) but might rather be parallel computations that can occur simultaneously within different elements of the same neural network as early as the periphery.
4.4. Conclusion
In conclusion, we have compared information theoretic results from two phenomenological accurate models of electroreceptor neurons of weakly electric fish. Information from bursting neurons must be decoded by nonlinear means. Thus, bursting dynamics were shown to be detrimental to stimulus estimation and beneficial to feature extraction. These two parallel streams of information must be differently decoded in higher brain centers and further studies are needed in order to elucidate the different mechanisms by which this could occur.
Acknowledgments
We thank J. Lewis, J. Bastian, and B. Doiron for useful discussions. This work was supported by NSERC (M.J.C. and A.L.) and CIHR (A.L. and L.M.) Canada.
Contributor Information
MAURICE J. CHACRON, Department of Physics, University of Ottawa, Ontario, Canada; Deparment of Cellular and Molecular Medicine, University of Ottawa, Ontario, Canada
ANDRÉ LONGTIN, Department of Physics, University of Ottawa, Ontario, Canada.
LEONARD MALER, Deparment of Cellular and Molecular Medicine, University of Ottawa, Ontario, Canada.
References
- Bastian J. Electrolocation I. How the electroreceptors of Apteronotus albifrons code for moving objects and other electrical stimuli. Journal of Comparative Physiology A. 1981;144:465–479. [Google Scholar]
- Bastian J, Nguyenkim J. Dendritic Modulation of Burst-like firing in sensory neurons. Journal of Neurophysiology. 2001;85:10–22. doi: 10.1152/jn.2001.85.1.10. [DOI] [PubMed] [Google Scholar]
- Borst A, Theunissen F. Information theory and neural coding. Nature neuroscience. 1999;2:947–957. doi: 10.1038/14731. [DOI] [PubMed] [Google Scholar]
- Borst A, Haag J. Effects of mean firing on neural information rate. Journal of Computational Neuroscience. 2001;10:213–221. doi: 10.1023/a:1011225232120. [DOI] [PubMed] [Google Scholar]
- Buracas GT, Zador AM, DeWeese MR, Albright TD. Efficient discrimination of temporal patterns by motion-sensitive neurons in primate visual cortex. Neuron. 1998;20:959–969. doi: 10.1016/s0896-6273(00)80477-8. [DOI] [PubMed] [Google Scholar]
- Chacron MJ. PhD Thesis. University of Ottawa; Ottawa: 2003. Dynamics Leading to Optimized Information Transfer. [Google Scholar]
- Chacron MJ, Longtin A, Maler L. Simple models of bursting and non-bursting electroreceptors. Neurocomputing. 2001a;38:129–139. [Google Scholar]
- Chacron MJ, Longtin A, Maler L. Negative interspike interval correlations increase the neuronal capacity for encoding time-varying stimuli. Journal of Neuroscience. 2001b;21:5328–5343. doi: 10.1523/JNEUROSCI.21-14-05328.2001. [DOI] [PMC free article] [PubMed] [Google Scholar]
- Chacron MJ, Lindner B, Longtin A. Noise Shaping by Interval Correlations Increases Information Transfer. Physical Review Letters. 2004;92:080601. doi: 10.1103/PhysRevLett.92.080601. [DOI] [PubMed] [Google Scholar]
- Chacron MJ, Longtin A, Maler L. The effects of spontaneous activity, background noise, and the stimulus ensemble on information transfer in neurons. Network: Computation in Neural Systems. 2003a;14:803–824. [PubMed] [Google Scholar]
- Chacron MJ, Longtin A, St-Hilaire M, Maler L. Suprathresh-old stochastic firing dynamics with memory in P-type electroreceptors. Physical Review Letters. 2000;85:1576–1579. doi: 10.1103/PhysRevLett.85.1576. [DOI] [PubMed] [Google Scholar]
- Chacron MJ, Doiron B, Maler L, Longtin A, Bastian J. Non-classical receptive field mediates switch in a sensory neuron’s frequency tuning. Nature. 2003b;423:77–81. doi: 10.1038/nature01590. [DOI] [PubMed] [Google Scholar]
- Gabbiani F. Coding of time varying signals in spike trains of linear and half-wave rectifying neurons. Network: Computation in Neural Systems. 1996;7:61–85. doi: 10.1080/0954898X.1996.11978655. [DOI] [PubMed] [Google Scholar]
- Gabbiani F, Koch C. Coding of time-varying signals in spike trains of integrate-and-fire neurons with random threshold. Neural Computation. 1996;8:44–66. [Google Scholar]
- Gabbiani F, Metzner W, Wessel R, Koch C. From stimulus encoding to feature extraction in weakly electric fish. Nature. 1996;384:564–567. doi: 10.1038/384564a0. [DOI] [PubMed] [Google Scholar]
- Gardiner CW. Handbook of Stochastic Methods. Berlin: Springer; 1985. [Google Scholar]
- Goldberg JM. Afferent diversity and the organisation of central vestibular pathways. Experimental Brain Research. 2000;130:277–297. doi: 10.1007/s002210050033. [DOI] [PMC free article] [PubMed] [Google Scholar]
- Heiligenberg W. Neural Nets in Electric Fish. Cambridge MA: MIT Press; 1991. [Google Scholar]
- Izhikevich EM. Neural Excitability, spiking, and bursting. International Journal of Bifurcations and Chaos. 2000;10:1171–1269. [Google Scholar]
- Kepecs A, Wang XJ, Lisman J. Bursting neurons signal input slope. Journal of Neuroscience. 2002;22:9053–9062. doi: 10.1523/JNEUROSCI.22-20-09053.2002. [DOI] [PMC free article] [PubMed] [Google Scholar]
- Kreiman G, Krahe R, Metzner W, Koch C, Gabbiani F. Robustness and variability of neuronal coding by amplitude sensitive afferents in the weakly electric fish eigenmania. Journal of Neurophysiology. 2000;84:189–224. doi: 10.1152/jn.2000.84.1.189. [DOI] [PubMed] [Google Scholar]
- Lisman JE. Bursts as a unit of neural information: Making unreliable synapses reliable. Trends in Neurosciences. 1997;20:38–43. doi: 10.1016/S0166-2236(96)10070-9. [DOI] [PubMed] [Google Scholar]
- Longtin A, Laing C, Chacron MJ. Correlations and memory in neurodynamical systems. In: Rangarajan G, Ding M, editors. Long-Range Dependent Stochastic Processes. Berlin: Springer; 2003. pp. 286–308. [Google Scholar]
- Metzner W, Koch C, Wessel R, Gabbiani F. Feature extraction by burst-like spike patterns in multiple sensory maps. Journal of Neuroscience. 1998;18:2283–2300. doi: 10.1523/JNEUROSCI.18-06-02283.1998. [DOI] [PMC free article] [PubMed] [Google Scholar]
- Middleton JW, Chacron MJ, Lindner B, Longtin A. Firing Statistics of a neuron driven by long-range correlated noise. Physical Review E. 2003;68:021920. doi: 10.1103/PhysRevE.68.021920. [DOI] [PubMed] [Google Scholar]
- Nelson ME, MacIver MA. Prey capture in the weakly electric fish Apteronotus leptorhynchus: Sensory acquisition strategies and electrosensory consequences. Journal of Experimental Biology. 1999;202:1195–1203. doi: 10.1242/jeb.202.10.1195. [DOI] [PubMed] [Google Scholar]
- Nelson ME, Xu Z, Payne JR. Characterization and modeling of P-type electrosensory afferent responses to amplitude modulations in a wave-type electric fish. Journal of Comparative Physiology A-Sensory Neural & Behavioral Physiology. 1997;181:532–544. doi: 10.1007/s003590050137. [DOI] [PubMed] [Google Scholar]
- Reinagel P, Godwin D, Sherman SM, Koch C. Encoding of visual information by LGN bursts. Journal of Neurophysiology. 1999;81:2558–2569. doi: 10.1152/jn.1999.81.5.2558. [DOI] [PubMed] [Google Scholar]
- Rieke F, Warland D, de Ruyter van Steveninck RR, Bialek W. Spikes: Exploring the Neural Code. MIT; Cambridge, MA: 1996. [Google Scholar]
- Shannon CE. The mathematical theory of communication. Bell Systems Technical Journal. 1948;27:379–423. 623–656. [Google Scholar]
- Sherman SM. Tonic and burst firing: Dual modes of thalamocortical relay. Trends in Neurosciences. 2001;24:122–126. doi: 10.1016/s0166-2236(00)01714-8. [DOI] [PubMed] [Google Scholar]
- Strong SP, Koberle R, de Ruyter van Steveninck RR, Bialek W. Entropy and information in neural spike trains. Physical Review Letters. 1998;80:197–200. [Google Scholar]
- Theunissen F, Roddey JC, Stufflebeam S, Clague H, Miller JP. Information Theoretic analysis of dynamical encoding by four identified interneurons in the cricket cercal system. Journal of Neurophysiology. 1996;75:1345–1364. doi: 10.1152/jn.1996.75.4.1345. [DOI] [PubMed] [Google Scholar]
- Turner RW, Maler L, Burrows M. Electroreception and electrocommunication. Journal of Experimental Biology. 1999;202:1167–1458. [Google Scholar]
- Turner RW, Maler L, Deerinck T, Levinson SR, Ellisman MH. TTX-sensitive dendritic sodium channels underlie oscillatory discharge in a vertebrate sensory neuron. The Journal of Neuroscience. 1994;14:6453–6471. doi: 10.1523/JNEUROSCI.14-11-06453.1994. [DOI] [PMC free article] [PubMed] [Google Scholar]
- Wang XJ, Rinzel J. Oscillatory and bursting properties of neurons. In: Arbib MA, editor. The Handbook of Brain Theory and Neural Networks. MIT Press; Cambridge, MA: 1995. pp. 686–691. [Google Scholar]
- Wessel R, Koch C, Gabbiani F. Coding of time-varying electric field amplitude modulations in a wave-type electric fish. Journal of Neurophysiology. 1996;75:2280–2293. doi: 10.1152/jn.1996.75.6.2280. [DOI] [PubMed] [Google Scholar]
- Xu Z, Payne JR, Nelson ME. Logarithmic time course of sensory adaptation in electrosensory afferent nerve fibers in a weakly electric fish. Journal of Neurophysiology. 1996;76:2020–2032. doi: 10.1152/jn.1996.76.3.2020. [DOI] [PubMed] [Google Scholar]
- Zupanc GKH, Maler L. Evoked chirping in the weakly electric fish Apteronotus leptorhynchus: A quantitative biophysical analysis. Canadian Journal of Zoology. 1993;71:2301–2310. [Google Scholar]


