

Abstract
Increased adipocyte size is hypothesized to signal the recruitment of adipose progenitor cells (APCs) to expand tissue storage capacity. To investigate depot and sex differences in adipose growth, male and female C57BL/6J mice (10 wk-old) were challenged with high-fat (HF) or low-fat (LF) diets (D) for 14 wk. The HFD increased gonadal (GON) depot weight by adipocyte hypertrophy and hyperplasia in females but hypertrophy alone in males. In both sexes, inguinal (ING) adipocytes were smaller than GON, and depot expansion was due to hypertrophy. Matrix metalloproteinase 3 (Mmp3), an antiadipogenic factor, and its inhibitor Timps modulate the extracellular matrix remodeling needed for depot expansion. Mmp3 mRNA was depot different (ING > GON), higher in females than males and mainly expressed in APCs. In males, HFD-induced obesity increased tissue and APC Mmp3 mRNA levels and MMP3 protein and enzymatic activity. In females however, HFD significantly decreased MMP3 protein without affecting its mRNA levels. MMP3 activity also decreased (significant in ING). Timp4 mRNA was expressed mainly in adipocytes, and HFD-induced obesity tended to increase the ratio of TIMP4 to MMP3 protein in females, whereas it decreased it in males. Overexpression of Mmp3 in 3T3-L1 preadipocytes or rhMMP3 protein added to primary human preadipocytes inhibited differentiation, whereas rhTIMP4 improved adipogenesis and attenuated the inhibitory effect of rhMMP3. These data suggest that HFD-induced obesity downregulates APC MMP3 expression to trigger adipogenesis, and adipocyte TIMP4 may modulate this process to regulate hyperplastic vs. hypertrophic adipose tissue expansion, fat distribution, and metabolic health in a sex- and depot-dependent manner.
Keywords: matrix metalloproteinase 3, adipocyte size, adipose progenitor, tissue inhibitor of matrix metalloproteinase 4, hyperplasia
male c57bl/6j mice fed a high-fat (HF) diet develop obesity and insulin resistance. Their adipose tissues, especially the gonadal (GON; epididymal), become infiltrated with activated macrophages that mediate inflammation and excessive extracellular matrix (ECM) remodeling. After ~14 wk of a very high-fat diet (HFD; 60% fat by calories), more than 80% of the epididymal adipocytes die and are replaced by smaller and presumably more insulin-sensitive adipocytes by week 20, as systemic insulin sensitivity is also improved (41). The inflammatory response to HFD of male inguinal (ING) subcutaneous (sc) adipose tissue is less marked than GON. In contrast to males, HF feeding provokes only minimal inflammation and remodeling in female GON (parametrial) and has even less of an effect in ING. Accordingly, age-matched female compared with male mice are far less susceptible to metabolic complications caused by HFD-induced obesity (12, 32).
Multiple lines of evidence suggest that the ability to recruit adipose progenitor cells (APCs) permits healthy adipose tissue expansion to accommodate the storage of excess energy, and the process requires remodeling of the ECM (35, 43). A long-standing hypothesis posits that the recruitment of APCs is triggered by a signal from adipocytes when they reach a critical or maximal size (5). However, the nature of this signal remains unknown. Therefore, we hypothesized that the signal may target ECM remodeling.
Matrix metalloproteinases (MMPs) are a family of zinc-dependent proteases that regulate tissue remodeling via ECM protein degradation, releasing sequestered growth factors that activate cell surface receptors (37). MMPs are known to be expressed in the stromal vascular fraction (SVF) of male mouse adipose tissues and by fibroblastic cells within the stroma of the mammary gland (which includes preadipocytes) (3, 29), where they play a critical role in the regulation of mammary development and involution by degrading the basement membrane of both epithelial cells and adipocytes (1, 26). In contrast, MMP12 [matrix metalloproteinase 12 (macrophage elastase)] is made predominately by adipose tissue macrophages (3), but a recent study indicates that it may not play a major role in adipose inflammation and ECM/elastin remodeling in obesity (31). Mmp3 has an inhibitory role in hyperplastic adipose expansion. Mmp3-null female mice showed accelerated differentiation and hypertrophy of adipocytes in the mammary (ING) fat pad after lactation (1), and male Mmp3-null mice exhibit hypertrophic obesity on HFD (28). Mmp3 mRNA is expressed mainly in preadipocytes in human adipose tissue (7). Consistent with an inhibitory effect of MMP3 on adipogenesis, its expression (mRNA and protein) declines markedly within 3 days of the addition of an adipogenic cocktail (7), but its expression in mouse preadipocytes has not been examined previously. In the current study, we used fluorescence-activated cell sorting (FACS) to identify the cell type(s) expressing Mmp3 mRNA in adipose tissues of male and female mice.
Tissue inhibitor of MMPs (TIMPs) are expressed abundantly in adipose tissues (29). They regulate proliferation, apoptosis, MMP activation, and immunological functions (40, 44). All four TIMPs inhibit MMP3, and TIMP1 and -2 inhibit MMP12 (30). The balance of the activities of MMPs and TIMPs is thought to contribute to dynamic changes in normal adipose tissue growth and remodeling over time and in response to challenges such as HFD. Available evidence suggests sex and depot differences in the adipose tissue expression of Mmps and Timps that exert complex phenotypic effects. Timp1- and -2-null mice exhibit sex-dependent influences on obesity phenotypes (8, 14, 24). The phenotype of adipose tissue in Timp4 knockout (KO) is unknown but is of particular interest because in male GON its mRNA is expressed in adipocytes and is downregulated by HFD (29). Given the importance of TIMPs in modulating the activity of MMPs, we assessed the expression of all four Timps in male and female mice in the current study.
The objectives of the current study were to 1) assess sex differences in key Mmps and all four Timps and their responses to HFD, 2) examine sex and depot differences in adipose cellularity in relationship to HFD-induced changes in Mmp3 expression at mRNA and protein levels (total and active forms) and Mmp3 activity, 3) compare changes in Mmp3, Mmp12, and Timp1–4 in male and female GON with those in a true visceral depot, the mesenteric (MES), which is associated with the intestine and portally draining, 4) compare changes in the two major sc depots [ING vs. dorsal (DSC)] because in females the ING depot includes mammary glands, 5) determine the cell type(s) in adipose tissues that express Mmp3 and Timps, and 6) assess the effects of Mmp3 and Timp4 on adipogenesis using 3T3-L1 preadipocytes and human preadipocytes. Our results suggest that diet effects on the balance of APC Mmp3 and adipocyte Timp4 may contribute to sex and depot differences in the regulation of adipose tissue growth and remodeling.
MATERIALS AND METHODS
Animals and Procedures
Age-matched 8-wk-old C57BL/6J male (n = 30) and female (n = 30) mice were purchased from The Jackson Laboratory. Three mice per cage were housed at a controlled temperature (22°C) and a 12-h light-dark cycle (light on from 0700 to 1900) with free access to food and water. At 10 wk of age, mice were body weight matched into groups fed with either high-fat diet (HFD; 45% of calories, mainly as lard, D12451) or low-fat diet (LFD; 10% of calories, D12450H; Research Diets, New Brunswick, NJ) for 14 wk. Diets were matched for the quantity of sucrose (17% of calories in each diet group). Body weights were recorded weekly. All procedures were approved by Boston University School of Medicine Animal Care and Use Committee.
At the end of the LF/HF feeding, mice were food deprived for 4 h and then decapitated after CO2 anesthesia. All females were euthanized at proestrus phase. Trunk blood was collected and serum separated and stored at −80°C. Liver and fat pads [GON, ING, DSC, retroperitoneal (RP), and MES] were dissected rapidly and aliquoted into ~100-mg pieces that were either snap-frozen in liquid nitrogen and then stored at −80°C or fixed in alcoholic Z-fix (Anatech). One piece of liver was fixed in the same way for microscopy. Carcass, liver, and individual fat pad weights were recorded.
RNA Isolation and Quantitative Real-Time PCR
Adipose tissues were homogenized in Trizol reagent (Life Technologies, Carlsbad, CA) using a Mixer Mill MM400 (Retsch, Haan, Germany). RNA was extracted from isolated adipocytes, total stromal vascular cells (SVC), and sorted cell populations using Trizol. RNA quantity and quality were measured spectrophotometrically (Nano-Drop, Waltham, MA). One microgram of total RNA was reverse transcribed using the Transcriptor First Strand cDNA synthesis kit, and quantitative real-time PCR (qPCR) was performed on LightCycler 480 (Roche, Indianapolis, IN) with Taqman probes (Applied Biosystems, Foster City, CA); cyclophilin A was used as a reference gene, and relative expression levels (arbitrary units) are presented.
Serum Measurements
Serum insulin, leptin, and adiponectin [total and high molecular weight (HMW)] were measured by enzyme-linked immunosorbent assay (ALPCO Diagnostics, Salem, NH). Serum glucose concentration was determined by enzymatic photometric test using glucose oxidase/peroxidase enzyme and O-dianisidine (Sigma, St. Louis, MO). Serum free fatty acid (Roche diagnostics), triacylglycerol (TAG), and true glycerol (Sigma) were measured with respective enzymatic spectrophotometric kits.
Histology, Tissue Lipid Extraction, and Adipocyte Size and Number Calculations
Fixed adipose tissue or liver was embedded in paraffin and sliced in 5-μm-thick sections and stained with hematoxylin and eosin. Images were acquired with a Nikon TE 200 microscope equipped with an Olympus DP72 camera (Tokyo, Japan). For each fat depot, morphological data were collected from at least 300 adipocytes from at least three random fields in multiple sections cut 50 μm apart. Morphometric analysis was performed with Photoshop CS 5.0 and its plugin IPTK 5.0 software (Reindeer Graphics). Dead adipocytes surrounded by crown-like structures were not sized. The mean adipocyte volume was calculated according to Goldrick formula (9), when distribution is normal or otherwise calculated as volume-weighted mean adipocyte size according to Jo et al. (17). The mean adipocyte weight was calculated as adipocyte volume multiplied by the density of TAG (0.915 g/ml). Lipid from adipose tissue or liver pieces was extracted according to Folch et al. (6), and the percentage of lipid in each fat depot was assessed by dividing lipid weight by wet tissue weight. Total adipocyte number was calculated as depot weight multiplied by percentage of lipid divided by the mean adipocyte weight.
Isolation of SVCs and FACS
ING and GON fat pads were excised, and SVCs were isolated by collagenase digestion and washed as described previously (22). Pooled GON or ING adipose tissues from three to six mice per group were used for FACS. In addition, an independent cohort of age-matched male (n = 10) and female (n = 10) mice fed a chow diet were used for additional flow cytometry experiments. Although adipocytes tended to be smaller in chow-fed compared with LF-fed mice, the number of adipocytes and APCs per depot were similar so the data were combined with the LF-fed mice.
SVCs were resuspended in ice-cold flow cytometry staining buffer (eBioscience, San Diego, CA) supplemented with Fc block-purified anti-mouse CD16/32 antibody at 10 μg/ml. Antibodies were incubated with cell suspension for 90 min on ice, followed by washing with ice-cold PBS and then 5 min of DAPI (4′,6-diamidino-2-phenylindole) staining. Cells were resuspended in flow cytometry staining buffer and sorted on Moflo Legacy cell sorter (Beckman-Coulter, Brea, CA). The isolation strategy was based on the method of Rodeheffer et al. (36), with some modifications. First, based on forward scatter and side scatter, single cells were selected. Second, dead cells were excluded based on their uptake of DAPI. Third, live cells were further separated based on cell surface markers. Antibodies were purchased from eBioscience (CD45-FITC, CD31-FITC, Ter119-FITC, Sca-1-PE, CD34-Alexa700, and purified Fc block-CD16/32) and Biolegend (San Diego, CA; CD29-PE/cy5). The lineage-specific (Lin+) population was first collected based on its staining of either hematopoietic or endothelial markers CD45, CD31, and Ter119, followed by collection of the CD29+, Sca-1+, and CD34+ population from the Lin− population. The order of CD34 and Sca-1 sorting was switched to include the entire CD29+/Sca-1+ cell population before isolating for the CD34+ population because Sca-1 is a more general stem cell marker. The total number of SVCs and each sorted population were counted. Values for APC number are presented per depot or relative to the number of adipocytes in the depot.
Western Blotting
GON or ING adipose tissues from LF- or HF-fed mice of both sexes were homogenized in three times the volume of tissue weight lysis buffer using glass-on-glass tissue grinder (Kontes, Vineland, NJ) and then centrifuged at 14,000 g for 10 min at 4°C. The internatant below fat cake was transferred into a new tube. An equal volume of tissue lysates was mixed with NuPAGE LDS sample buffer (Life Technologies) heated at 95°C for 10 min and loaded 10% Bis-Tris gels (Life Technologies) at 10 μl/lane (equivalent to 5 μl of homogenate or ~1.67 mg tissue weight). For MMP3 blots, gels were run in MOPS-SDS buffer to efficiently separate the proactive and active forms of MMP3. For TIMP4, gels were run in MES-SDS buffer. After transferring and blocking in 5% nonfat milk, membranes were incubated with antibodies directed against MMP3 (1:1,000; Novus biologicals, Littleton, CO) and TIMP4 (1:200; Santa Cruz Biotechnology, Dallas, TX) overnight at 4°C. Appropriate horseradish peroxidase-conjugated secondary antibodies were used at 1:10,000. Chemiluminescence signals were detected, and ImageJ was used to quantify the densitometry of bands.
For quantitation, densitometry values were normalized to tissue weight (per mg tissue) and also to the calculated number of adipocytes per milligram tissue. Values for homogenate protein, total ERK, or fatty acid-binding protein (FABP4) per adipocyte were affected by sex, depot, and/or diet, and therefore, these normalizations could not be used to compare treatment or group effects (not shown).
MMP3 Activity Assay
MMP3 activity in the tissue homogenate was measured by the MMP3 Activity Fluorometric Assay Kit purchased from Biovision (San Francisco, CA). Using tissue samples available from mice that were not used for Western analysis, ~20–30 mg of GON or ING fat tissues were homogenized in the assay buffer at three times the volume of the tissue weight, and 5 μl/reaction homogenate was used. Assays were performed and data collected per the manufacturer’s protocol. In this assay, MMP3 hydrolyzes a specific fluorescence resonance energy transfer substrate to release a quenched fluorescent group, which can then be detected fluorometrically. The reaction was linear with time and amount of homogenates added, and the activity was inhibited by a specific MMP3 inhibitor provided with the kit.
Construction of Tetracycline-Regulated Mmp3 Expression Lentivirus and Overexpression in 3T3-L1 Cells
Mouse Mmp3 cDNA (BC006725) inserted in pSport6 vector was purchased from ATCC (Manassas, VA) and then transferred to pENTRY vector with BP clonase (Life Technologies). Lentivirus vector containing tetracycline (Tet)-controlled expression was constructed by replacing CMV promoter in pLenti6 vector (Life Technologies) with Tet-responsive element minimal promoter. Mmp3 gene was then transferred to this lenti vector by LR clonase reaction, resulting in the vector pL6TRE-Mmp3, and lentivirus was produced as described previously (13). Adenovirus expressing Tet-off protein, purchased from Clontech (Mountain View, CA), was amplified in human embryonic kidney-293 cells and purified (2). 3T3-L1 preadipocytes were infected with pL6TRE-Mmp3 lentivirus, selected with blasticidin (10 µg/ml), and replated to 12-well plates after selection. Cells were infected with Tet-off adenovirus at 125 MOI with AdenoBooster solution (ATCGbio Lifetechnology, Vancouver, BC, Canada) and differentiated in the absence or presence of doxycycline (1 µg/ml), following a standard protocol (22).
Effects of Exogenous MMP3 and TIMP4 on the Differentiation of Human Preadipocytes
Adipose stromal cells were isolated by collagenase digestion of human abdominal subcutaneous (sc) adipose tissue cultured and differentiated as described previously (21). Two-day postconfluent cells were induced to differentiate in the complete differentiation media (which contained IBMX, dexamethasone, rosiglitazone, and T3) in the absence or presence of recombinant human MMP3 (rhMMP3; 10 ng/ml and 100 ng/ml; R & D Systems) and/or recombinant human TIMP4 (rhTIMP4, 500 ng/ml; R & D Systems) for 4 days and maintained in the maintenance media (DMEM-F-12 supplemented with 10 nM insulin and 10 nM dexamethasone) until harvest. Expression levels of PPARγ and ATGL proteins on day 12 were measured as markers of differentiation by Western analysis.
Variables that were not normally distributed (goodness of fit test) were log-transformed before statistical analysis. Depot, sex and diet effects, and their interactions were determined by two-way ANOVA (JMP 10 Software). One-way repeated-measures ANOVA was used to assess depot effects within each sex. If the main effects or interactions were significant, post hoc comparisons by two-sided paired (depot differences) or unpaired t-tests (sex and diet effects) were carried out. A one-sided t-test was used when the direction of the effect was predicted (e.g., adipocyte number increases with HFD) as specified. Linear regression (least-square fit) was used to assess the relationships between selected variables. All data are reported as means ± SE for the number of samples indicated.
RESULTS
HFD Increased Body Fat in Both Sexes and Worsened Metabolic Profiles in Males
Age-matched LF-fed males (M) were fatter than females (F) [9.0 (M) vs. 5.3% (F), body fat estimated from the sum of fat pads (GON + MES + ING + DSC + RP)/body weight × 100; Table 1]. The relative contribution of the sc depots (ratio of sum of ING and DSC to total dissected fat), a measure of fat distribution, was higher in females independent of diet. HF feeding increased the contribution of GON to total fat in females but decreased it in males (sex × diet interaction, P < 0.01). As expected, the wet weights of all fat pads were higher in age-matched males than females independent of diet. The HFD produced significant increases in the relative weights (%total fat) of the GON and RP of females but not males. Body weight and body fat percentage increased in both sexes, and there was no sex difference in %body fat after HF feeding, suggesting that females gained more percent body fat than males on HFD (diet × sex interaction, P = 0.07). HF feeding increased liver weight and liver fat content in males but had little effect in females. Histological analysis confirmed that the HF-fed males developed more severe liver steatosis than the females (data not shown), similar to previous findings (32).
Table 1.
Body weight, adiposity, and liver weight
| Female |
Male |
||||
|---|---|---|---|---|---|
| LF (n = 17) | HF (n = 10) | LF (n = 12) | HF (n = 12) | Sex × Diet Interaction | |
| Week 0 BW, g | 19.2 ± 0.3* | 19.4 ± 0.4* | 25.7 ± 0.4 | 25.7 ± 0.4 | N/A |
| Week 14 BW, g | 22.9 ± 0.5* | 29.3 ± 1.7*# | 35.5 ± 0.8 | 44.1 ± 0.9# | P = 0.77 |
| %Weight gain over 14 wk | 19.2 ± 1.6* | 50.7 ± 7.1*# | 38.4 ± 2.1 | 71.5 ± 3.3# | P = 0.11 |
| Gonadal fat pad, mg | 418 ± 40* | 1,432 ± 242# | 1,286 ± 110 | 1,900 ± 131# | P = 0.002 |
| Mesenteric fat pad, mg | 173 ± 16 (n = 13)* | 464 ± 70*# | 488 ± 60 (n = 8) | 1,186 ± 156 (n = 8)# | P = 0.89 |
| Retroperitoneal fat pad, mg | 92 ± 8* | 328 ± 58*# | 354 ± 29 | 577 ± 23# | P = 0.01 |
| Inguinal fat pad, mg | 351 ± 27* | 982 ± 144*# | 722 ± 76 | 1,527 ± 102# | P = 0.37 |
| Dorsal sc fat pad, mg | 210 ± 15* | 555 ± 81*# | 396 ± 46 | 742 ± 45# | P = 0.33 |
| Liver weight, mg | 1,095 ± 48* | 1,129 ± 68* | 1,452 ± 56 | 2011 ± 163# | P = 0.02 |
| %Liver fat content | 9.4 ± 0.7 (n = 11) | 9.2 ± 0.5 (n = 9)* | 9.0 ± 1.1 | 16.3 ± 2.3 (n = 10)# | P = 0.02 |
| Brown adipose tissue, mg | 85 ± 4* | 117 ± 13*# | 190 ± 25 | 317 ± 17# | P = 0.08 |
| Gonadal fat pad, %BW | 1.8 ± 0.1* | 4.6 ± 0.6# | 3.6 ± 0.3 | 4.4 ± 0.3 | P = 0.0004 |
| Mesenteric fat pad, %BW | 0.8 ± 0.1 (n = 13)* | 1.5 ± 0.2*# | 1.4 ± 0.2 (n = 8) | 2.6 ± 0.3 (n = 8)# | P = 0.92 |
| Retroperitoneal fat pad, %BW | 0.4 ± 0.0* | 1.1 ± 0.1# | 1.0 ± 0.1 | 1.3 ± 0.1# | P = 0.003 |
| Inguinal fat pad, %BW | 1.5 ± 0.1* | 3.2 ± 0.3# | 2.0 ± 0.2 | 3.4 ± 0.2# | P = 0.30 |
| Dorsal sc fat pad, %BW | 0.9 ± 0.1 | 1.8 ± 0.2# | 1.1 ± 0.1 | 1.7 ± 0.1# | P = 0.26 |
| Liver, %BW | 4.8 ± 0.1* | 3.9 ± 0.0# | 4.1 ± 0.1 | 4.5 ± 0.3 | P = 0.0004 |
| %Total fat, %BW | 5.3 ± 0.3 (n = 13)* | 12.2 ± 1.3# | 9.0 ± 0.9 (n = 8) | 13.9 ± 0.5# | P = 0.07 |
| Gonadal, %total fat | 32.9 ± 0.5* | 37.1 ± 1.0# | 39.5 ± 1.0 | 32.8 ± 3.1# | P = 0.001 |
| Mesenteric, %total fat | 14.3 ± 0.6 | 12.5 ± 0.5*# | 15.3 ± 0.9 | 18.9 ± 2.1 | P = 0.02 |
| Retroperitoneal, %total fat | 7.2 ± 0.3* | 8.3 ± 0.4*# | 11.0 ± 0.5 | 10.1 ± 0.5 | P = 0.02 |
| Inguinal, %total fat | 28.4 ± 0.7* | 27.0 ± 1.3 | 22.5 ± 0.8 | 25.7 ± 1.4 | P = 0.03 |
| Dorsal sc, %total fat | 17.3 ± 0.5* | 15.1 ± 0.5*# | 11.7 ± 0.5 | 12.5 ± 0.2 | P = 0.004 |
| sc Fat, %(Ing + Dsc)/total fat | 46 ± 1* | 42 ± 1# | 34 ± 1 | 38 ± 1 | P = 0.002 |
Data are shown as means ± SE. BW, body weight; LF, low fat; HF, high fat; sc, subcutaneous. Total fat is the sum of 5 depots. Post hoc t-tests were used to compare sex differences within diet and diet effects within sex when main effects or interaction were significant (P < 0.05).
Significant differences between sexes within diet based on post hoc t-test (P < 0.05);
significant differences between diets within sex based on post hoc t-test (P < 0.05).
LF-fed males had higher levels of serum insulin and TAG than females (Table 2). The HFD significantly increased serum insulin levels in males but not females. Serum levels of total adiponectin and percentage of HMW, a marker of insulin sensitivity, were significantly lower in males than females fed LF or HF diets. Serum leptin levels were higher in males, even when considered in relationship to their percent body fat (sex × diet interaction, P < 0.001).
Table 2.
Serum measurements
| Female |
Male |
||||
|---|---|---|---|---|---|
| LF (n = 11) | HF (n = 9) | LF (n = 10) | HF (n = 10) | Sex × Diet Interaction | |
| Glucose, mg/dl | 160 ± 3* | 203 ± 13# | 198 ± 10 | 237 ± 14# | P = 0.81 |
| Insulin, ng/ml | 0.57 ± 0.08* | 0.86 ± 0.17* | 1.80 ± 0.34 | 8.04 ± 1.67# | P = 0.01 |
| FFA, mM | 0.51 ± 0.03 | 0.49 ± 0.02* | 0.52 ± 0.04 | 0.38 ± 0.02# | P = 0.046 |
| TG, mM | 0.21 ± 0.02* | 0.24 ± 0.02* | 0.42 ± 0.03 | 0.48 ± 0.06 | P = 0.77 |
| Glycerol, mg/dl | 0.05 ± 0.00 | 0.06 ± 0.01*# | 0.05 ± 0.00 | 0.05 ± 0.00 | P = 0.03 |
| Total adiponectin, µg/ml | 68 ± 2* | 79 ± 3*# | 30 ± 1 | 36 ± 5 | P = 0.50 |
| HMW adiponectin, µg/ml | 25.4 ± 1.9* | 29.8 ± 2.8* | 8.5 ± 1.0 | 7.9 ± 0.8 | P = 0.17 |
| HMW/total adiponectin | 0.73 ± 0.04* | 0.75 ± 0.05* | 0.57 ± 0.06 | 0.49 ± 0.05 | P = 0.35 |
| Leptin, ng/ml | 3.3 ± 0.9* | 6.5 ± 1.5* | 10.0 ± 2.5 | 38.6 ± 6.2# | P = 0.0008 |
Data are shown as means ± SE. LF, low fat; HF, high fat; FFA, free fatty acids; TG, triglycerides; HMW, high molecular weight.
Significant differences between sexes within diet based on post hoc t-test (P < 0.05);
significant differences between diets within sex based on post hoc t-test (P < 0.05).
Sex- and Depot-Dependent Effects of the HFD on Adipocyte Size and Number
In both diet groups, females had smaller adipocytes than males in GON, MES, and DSC depots; no sex differences were found in ING. In both sexes, the increase in depot weight with HF feeding over the time period examined (from 10 to 24 wk of age) was accounted for largely by adipocyte hypertrophy in all adipose depots examined (Table 3). Additionally, the diet-induced changes in calculated fat cell number (FCN) in GON varied by sex (sex × diet interaction, P = 0.002); in males, the HFD decreased GON FCN (P = 0.02), and there was a similar trend in ING (sex × diet interaction, P = 0.09), whereas in females the HFD increased GON FCN (P < 0.05 by 1-sided t-test). FCN was not changed by HFD in other female depots.
Table 3.
Fat cell size and number
| Female |
Male |
||||
|---|---|---|---|---|---|
| LF | HF | LF | HF | Sex × Diet Interaction | |
| GON FCW | 0.09 ± 0.01 (n = 8)* | 0.22 ± 0.05 (n = 7)*# | 0.20 ± 0.03 (n = 6) | 0.43 ± 0.04 (n = 7)# | P = 0.14 |
| MES FCW | 0.03 ± 0.01 (n = 8)* | 0.10 ± 0.03 (n = 6)*# | 0.10 ± 0.01 (n = 7) | 0.27 ± 0.05 (n = 8)# | P = 0.12 |
| ING FCW | 0.06 ± 0.01 (n = 8) | 0.17 ± 0.04 (n = 6)# | 0.08 ± 0.01 (n = 6) | 0.27 ± 0.03 (n = 7)# | P = 0.10 |
| DSC FCW | 0.05 ± 0.00 (n = 7)* | 0.16 ± 0.02 (n = 7)*# | 0.11 ± 0.02 (n = 6) | 0.26 ± 0.02 (n = 7)# | P = 0.13 |
| GON FCN | 4.44 ± 0.78 (n = 8) | 7.27 ± 1.36 (n = 7)Δ | 6.33 ± 1.12 (n = 6) | 3.53 ± 0.12 (n = 7)# | P = 0.002 |
| MES FCN | 3.77 ± 0.78 (n = 5) | 3.90 ± 0.50 (n = 6) | 6.40 ± 2.66 (n = 4) | 4.57 ± 0.43 (n = 4) | P = 0.30 |
| ING FCN | 5.51 ± 0.86 (n = 8) | 5.94 ± 0.71 (n = 6) | 8.33 ± 1.67 (n = 6) | 5.21 ± 0.68 (n = 7) | P = 0.09 |
| DSC FCN | 3.53 ± 0.42 (n = 7) | 3.18 ± 0.47 (n = 7) | 3.74 ± 0.65 (n = 6) | 2.75 ± 0.25 (n = 7) | P = 0.34 |
Data are shown as means ± SE. LF, low fat; HF, high fat; GON, gonadal; MES, mesenteric; ING, inguinal; DSC, dorsal subcutaneous; FCW, fat cell weight (µg lipid/cell); FCN, fat cell nos. in millions.
Significant differences between sexes within diet based on post hoc t-test (P < 0.05);
significant differences between diets within sex based on post hoc t-test (P < 0.05); ΔP < 0.05 (1-sided post hoc t-test).
HFD Induced an Inflammatory Response with Increased Mmp12 Expression in Males but Not in Females
Expression levels of inflammation marker genes were lower in all depots of females compared with males, and the HFD increased their expression only in the GON depot of females (Fig. 1, A–C). In males, as expected, HFD increased mRNAs for Cd11c, F4/80, and Mmp12 in all four depots, and the magnitude of HFD effect was larger in visceral depots (GON and MES) than sc (ING and DSC). Expression levels of these inflammation-related genes were closely correlated (not shown), most likely because macrophages express these genes. The magnitude of the inflammatory response to HFD was lower in female than male GON (~8-fold in females vs. ~20-fold in males), and in agreement with our prior results (12), the HFD increased the number of crown-like structures in male GON compared with other depots (data not shown).
Fig. 1.

Sex-, depot-, and diet-dependent effects on expression of Mmp12, Cd11c, F4/80, and matrix metalloproteinase 3 (Mmp3) in adipose tissue. Adipose tissues were obtained from male (open bars) and female (cross-hatched bars) mice after 14 wk of diet [n = 8–9 for all depots except dorsal (DSC; n = 5)] and expression levels of Cd11c (A), F4/80 (B), Mmp12 (C), and Mmp3 (D) were measured. Data for each depot were first analyzed by ANOVA for sex, diet, and their interaction, followed by post hoc t-tests if F-tests were significant. Sex effects for each gene (P < 0.01) were significant for all depots, except for F4/80 in inguinal (ING) for Mmp3 in mesenteric (MES). The diet effect was significant (P < 0.001) for all depots, with the exception of Mmp3 in MES (P = 0.06) and ING and DSC (P < 0.05). Furthermore, the sex × diet interaction was also significant for Cd11c, F4/80 (except for ING), and Mmp3 in gonadal (GON) and MES. *Significant sex effect by post hoc t-test; #significant diet effect by post hoc t-test (P < 0.05). Differences among depots within each sex and diet group were determined by 1-way ANOVA with repeated measures using paired values, followed by post hoc comparison of means by paired t-tests; F values were significant for all sex and diet groups. Bars with different letters show depot differences within diet groups [A,B,C,Dhigh fat (HF); a,b,c,dlow fat (LF; P < 0.05); BΔ, P = 0.06, vs. A (GON); cΔ, P = 0.06, compared with b (MES)].
Mmp3 mRNA Levels Were Higher in sc Depots (Both ING and DSC), Higher in Females than in Males, and Increased by HFD in All Depots Only in the Males
We had noted a depot difference (ING > GON) in Mmp3 mRNA expression in our previous microarray study of HFD-fed mice (12). Because Mmp3 is implicated in the regulation of adipogenesis (1), we assessed whether this sex difference was also present in mice fed the LFD.
Sex differences.
As measured by qPCR (Fig. 1D), Mmp3 mRNA levels were higher in LF-fed females than males in all depots (except MES), and the magnitude of the sex difference varied among depots (4.4-fold in GON and 2.8-fold in ING).
Diet effects.
The HFD did not significantly affect Mmp3 mRNA expression in female adipose depots, except in the GON, yet it increased Mmp3 mRNA in all adipose depots of males.
Depot differences.
The high Mmp3 mRNA levels in ING were not related to mammary tissue present in this depot, as they were also higher in DSC. In HF-fed mice, Mmp3 expression was higher in both sc depots (ING and DSC) compared with the visceral depots (MES and GON) and the sex differences (F > M) held in both sc depots.
Mmp3 mRNA Was Expressed in Adipose Progenitor Cells
The relative abundance of Mmp3 mRNA was consistently enriched, by two- to 10-fold, in SVCs compared with total tissue in both males and females (n = 3 preparations/group; data not show), in agreement with reported results in males (29). In addition, the sex, depot, and diet effects that we observed in Mmp3 mRNA at the tissue level (Fig. 1) reflected changes in the SVC fraction (data not shown).
To determine the cell type(s) that expresses Mmp3 mRNA, the SVCs were separated by FACS. The gating strategy is shown in Fig. 2, A and B. The number of APCs and Lin+ cells within each depot, sex, and diet group was determined, and expression of Mmp3 and -12 and markers of cell types in each fraction were measured. For these experiments, adipose samples (pooled tissues from 3 to 6 mice of each sex; n = 3 pools) from 24-wk-old HF, LF, or chow-fed mice were used; results for chow and LF-fed groups were similar and pooled. Mmp3 was expressed in the APC fraction, which was enriched for stem cell markers CD34 and Sca-1 as well as the adipogenic transcription factor Zfp423 (Fig. 2, C and D) (21). The APC fraction of LF groups did not express macrophage markers (neither Mmp12 nor F4/80), which were enriched, as expected, exclusively in the Lin+ cells (Fig. 2, E and F).
Fig. 2.

Mmp3 is expressed in adipose progenitor cells (APCs); Mmp12 in Lin+ cells. A: scheme of the fluorescence-activated cell sorting (FACS) strategy. B: illustration of the gating strategy with representative example. Gene expression [quantitative PCR (qPCR)] measured in sorted cell populations [Mmp3 (C), Zfp423 (D), Mmp12 (E), and F4/80 (F); n = 3/group (2 chow fed and 1 LF fed in LF group]. *Sex effect (P < 0.05) by t-test; #diet effect by t-test. Depot differences within diet groups were indicated by different letters. ΔP < 0.06 by t-test.
Sex and depot differences in APC number.
It is difficult to directly compare APC numbers between depots and sexes because the HFD markedly increases the number of macrophages and other immune cells, especially in the male GON depot. Thus, calculation of APCs as a percentage of the total number of cells in the stromal fraction in this situation is misleading. Expression of APC numbers per gram of adipose tissue is also problematic because the number of adipocytes per gram differs depending on adipocyte size and adipocyte size differed by sex and diet (Table 3). Therefore, we calculated the relative abundance of APCs per depot and per 100 adipocytes to provide estimates of the size of the APC pool that is independent of adipocyte size (Fig. 3). There were approximately two- to threefold more APCs normalized to the number of adipocytes in the GON and ING of LF females than males. In females, HF feeding did not change APC number per depot or per adipocyte in GON or ING. In contrast, in males the HFD increased APC number per adipocyte and per depot two- to threefold in both GON and ING. Thus, after HFD, there were substantially more GON APCs in males than in females.
Fig. 3.

APC numbers in GON and ING: depot, diet, and sex differences. Calculation of the size of APC pool expressed as APC number per 100 adipocytes (A) and per depot (B). When sex, diet, or sex × diet interactions were significant by MANOVA within depots, post hoc t-tests (P ≤ 0.05) were used to assess group differences: *Sex effects; #diet effects (P < 0.05); #ΔP = 0.06. The main effect of depot was also significant (not shown). Values are expressed as means ± SE; n = 3 for each group. F, females; M, males.
Mmp3 mRNA Expression in APCs Contributes to Sex and Depot Differences in Tissue Expression
Sex differences.
We next asked whether the sex differences in tissue Mmp3 mRNA expression were related to their relative abundance in APCs or changes in APC numbers. The sex difference in LF ING tissue Mmp3 mRNA expression (~3-fold, F > M; Fig. 1D) was due partly to a significant sex difference in the number of APCs (F > M; Fig. 3) without a sex difference in the relative abundance of Mmp3 mRNA in APCs (Fig. 2C). The sex difference in LF GON tissue Mmp3 expression (4.4-fold, F > M, Fig. 1A) was related to a significantly higher APC abundance relative to adipocyte number (2- to 3-fold, F > M; Fig. 3) and a 10-fold higher relative abundance of Mmp3 mRNA in APCs (Fig. 2C). After HF feeding, there was no sex difference in the relative abundance of Mmp3 in APCs in either depot.
Diet effects.
In males, the HFD increased the relative abundance of APC Mmp3 mRNA expression in GON (~10-fold) and the number of APCs in GON and ING (2- to 3-fold), contributing to higher tissue expression of Mmp3 after HFD. In females, the HFD did not affect APC Mmp3 mRNA levels or APC numbers in either ING or GON depots.
Depot differences.
Expression of Mmp3 mRNA was higher in ING than GON adipose tissue of both M and F (Fig. 1), and this difference was paralleled by its relative abundance in the APC fraction (4-fold or higher, Fig. 2C). The increase in APC number and expression of Mmp3 mRNA in APC in male GON contributed to the lower fold depot difference in tissue Mmp3 mRNA expression in the HFD group [~2.5- (HFD) vs. ~10-fold (LFD)].
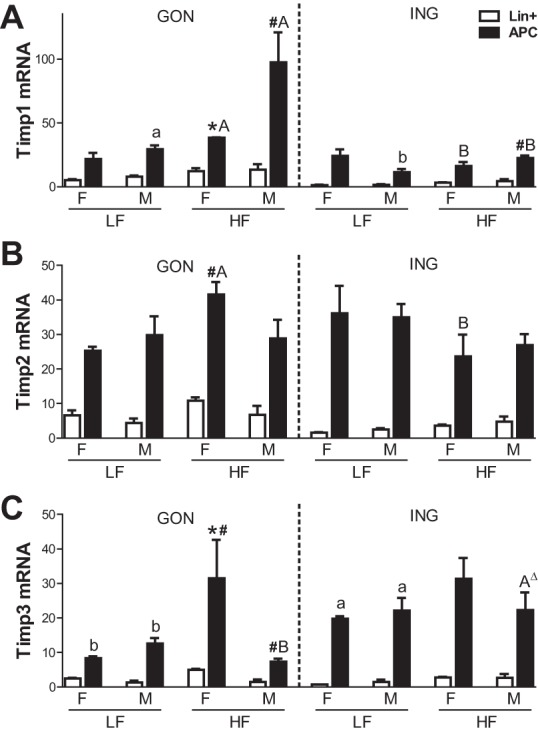
Sex-, Depot-, and Diet-Dependent Regulation of Tissue Inhibitors of MMP mRNA Expression
Because the activities of MMPs are regulated by their inhibitors, TIMPs, we measured the expression of all four Timp mRNAs.
Sex differences.
Timp1 and Timp4 mRNA exhibited the most pronounced sex differences (Fig. 4). In LF-fed mice, Timp1 mRNA expression was approximately twofold higher in female than in male ING only. After HF feeding, Timp1 mRNA was approximately two- to fourfold higher in males than in females in GON, MES, and DSC depots, and there was no longer any sex difference in the ING. Timp4 mRNA levels were lower in LF-fed females than in males in all four depots but did not differ after HF feeding. Timp2 mRNA did not show clear sex, depot, or diet effects, although there was a trend for sex × diet interaction in the MES (P = 0.07; n = 6).
Fig. 4.

Sex-, depot-, diet-dependent effects on gene expression of tissue inhibitor of MMPs (Timps) in adipose tissue. qPCR [Timp1 (A), Timp2 (B), Timp3 (C), and Timp4 (D)] performed on the same samples and analyzed as described in Fig. 1. Bars with difference letters show depot differences within diet (P < 0.01). *Sex difference within diet, P < 0.05; #diet effect, P < 0.05 by post hoc t-test when main effects or interactions significant. BΔ, P = 0.07, compared with GON; bΔ, P = 0.06, compared with GON.
Diet effects.
Timp1 and 4 exhibited sex- and depot-dependent responses to HFD. The HFD increased Timp1 mRNA expression in all four depots of males, in parallel to mRNAs for inflammatory markers, Mmp12, Cd11c, and F4/80, but had no effect in females. The HFD decreased Timp4 gene expression in all depots, except in the DSC in the males, yet increased it in the females (MES, ING, and DSC) (sex × diet interactions significant for all depots, P < 0.01). The HFD also decreased Timp3 mRNA levels in male GON.
Depot differences.
In males, Timp1 expression was higher in GON than in ING. In HF females, Timp4 mRNA levels were higher in sc (ING and DSC) than in visceral (GON or MES) depots.
Sex, Depot, and Diet Influenced mRNA Expression Levels of Timps in APCs
Timp1, -2, and -3 were expressed mainly in the SVC, whereas Timp4 was more highly expressed in the adipocyte fraction (Wu Y, Lee MJ, and Fried SK, unpublished observation), consistent with a previous report (29). FACS analysis demonstrated that Timp1, -2 and -3 were relatively more abundant in the APCs rather than Lin+ cells within adipose tissue (Fig. 5). Timp4 was barely detectable in APCs or Lin+ cells (data not shown). Similar to data in the total adipose tissue, mRNA levels of Timp1, -2, and -3 in APCs varied with sex, depot, and diet. In male GON, the HFD increased Timp1 expression in APCs by approximately threefold, creating a sex difference (M > F). Similarly, the HFD increased Timp3 expression in the female GON APCs by approximately threefold but decreased it in the male GON APCs. With the exception of HF-fed females, Timp3 expression was higher in APCs from the ING than from the GON depot (depot effect, P < 0.001).
Fig. 5.
Expression of Timp 1, 2, and 3 in sorted cell populations. Timp mRNA levels were measured by qPCR in the cells described in Fig. 4. Symbols are as indicated in the legend to Fig. 4. Δ indicates P < 0.09 by T-test.
Higher MMP3 Protein Expression in Female ING Depots Was Decreased by HFD
For Western analysis of tissue homogenates, an equal quantity of tissue was loaded per lane.
Sex differences.
Data were expressed per mg of tissue or normalized to the calculated number of adipocytes to avoid confounding by sex- and depot-differences in adipocyte size. With both calculations, the protein levels of the pro- and active forms of MMP3 in ING and GON were higher in LF-fed females than males (Fig. 6 and Table 4).
Fig. 6.

MMP3 and TIMP4 protein expression in gonadal and inguinal adipose tissues. Western blot data presented are based on loading same weight of adipose tissue/sample.
Table 4.
Expression of MMP3 and TIMP4 protein and MMP3 activity
| Female |
Male |
|||||||
|---|---|---|---|---|---|---|---|---|
| GON |
ING |
GON |
ING |
|||||
| LF | HF | LF | HF | LF | HF | LF | HF | |
| Active MMP3/103 adipocytes | 473 ± 141c | 77 ± 29a,c | 601 ± 90c | 90 ± 31a,c | 199 ± 72 | 856 ± 342 | 95 ± 27 | 345 ± 74a |
| Active MMP3/mg tissue | 3,426 ± 535c | 442 ± 184a | 6,267 ± 663c | 812 ± 299a | 1,054 ± 608 | 1,767 ± 888 | 897 ± 250 | 1,003 ± 273 |
| Active MMP3/estimated APC No. | 263 ± 43 | 43 ± 16a | 501 ± 106c,f | 85 ± 30a,e | 119 ± 48 | 204 ± 81b | 95 ± 27 | 203 ± 44a |
| TIMP4/103 adipocytes | 547 ± 285 | 131 ± 41 | 948 ± 257c,f | 496 ± 83 | 446 ± 83 | 1,135 ± 665 | 193 ± 4d | 215 ± 103e |
| TIMP4/mg tissue | 4,250 ± 1,593 | 646 ± 25b | 10,484±264c | 4,558 ± 2,027a,c | 2,144 ± 24 | 2,455 ± 1,671 | 1,803 ± 593 | 533 ± 151 |
| TIMP4/active MMP3 | 1.10 ± 0.31 | 2.19 ± 0.97 | 1.50 ± 0.11d | 5.26 ± 2.3g | 3.63 ± 1.4 | 1.13 ± 0.26 | 2.40 ± 1.2d | 0.66 ± 0.25b,f |
| MMP3 activity/mg tissue | 1.9 ± 0.05 | 1.3 ± 0.23c | 3.6 ± 0.06c | 2.0 ± 0.12a | 1.7 ± 0.08 | 3.7 ± 0.08a | 1.7 ± 0.04 | 2.7 ± 0.06b |
| MMP3 activity/depot | 3,276 ± 1,331 | 1,764 ± 672b | 1,389 ± 136 | 1,264 ± 582 | 4,371 ± 868 | 9,386 ± 1,044a | 1,455 ± 192 | 4,262 ± 577a |
Data are means ± SE; n = 3/group. Post hoc t-tests: diet effect within depot,
P ≤ 0.05,
P < 0.1.
Sex difference within depot and diet (2-tailed Student's t-test),
P < 0.05. Depot effect within sex and diet by paired t-test (dP = 0.052),
P < 0.02,
P < 0.1.
Diet × sex interaction, P = 0.06; post hoc least squares mean for sex difference in HF ING, P < 0.05.
Note: the MMP3 activity per depot comparison is only valid to test the diet effect, so other comparisons were not made.
Diet effects.
The HFD decreased active MMP3 protein in both depots of females but increased it in males. Because the HFD also markedly increased APC numbers in male GON, we calculated the MMP3 protein relative to the number of APCs based on data in Fig. 3 and still observed a diet-induced increase in both fat pads of males.
Depot differences.
Active MMP3 protein levels were higher in the ING than GON of LF- or HF-fed females when the data were expressed relative to the estimated number of APCs, but there was no significant difference relative to adipocyte number or tissue weight. No depot difference in MMP3 protein was apparent in males, regardless of how the data were expressed.
TIMP4 Protein Expression Was Regulated by Depot, Diet, and Sex
Because TIMP4 is expressed mainly in adipocytes, data were expressed per adipocyte as well as per milligram of tissue.
Sex differences.
In the LF groups, ING TIMP4 protein per adipocyte or per milligram of tissue was approximately fourfold higher in females than males. There was no statistically significant sex difference after HF feeding.
Diet effects.
Due to within group variability and a small number of animals analyzed, the HFD did not significantly affect TIMP4 protein per adipocyte in GON of males or females. Expressed per milligram of tissue, there was an interaction between diet and sex (diet effect P < 0.01 by ANOVA, diet × sex P = 0.07). The HFD tended to decrease TIMP4 per milligram of tissue in both depots of females [P = 0.09 (GON), P = 0.051 (ING)] but had no effects in males. Because the HFD markedly decreased MMP3 protein in females, the ratio of TIMP4 to active MMP3 protein tended to increase. However, the HFD decreased the TIMP4/active MMP3 ratio in males in both depots (diet × sex interaction in both depots, P = 0.08 in GON, P = 0.06 in ING; Table 4).
Depot differences.
In LF females, Timp4 per adipocyte tended to be higher in ING than GON of females (P = 0.09), but in males it was lower in ING than in GON (P < 0.05).
HFD Increased MMP3 Activity in Males
To assess MMP3 activity directly, we assayed its enzymatic activity in tissue homogenates (Table 4). The HFD increased MMP3 activity per milligram in both ING and GON of males but decreased it in females (diet × sex interaction, P < 0.02). Because adipocyte size was not measured in these mice, we also compared MMP3 activity results expressed “per depot.” In males, the HFD significantly increased Mmp3 activity per depot in both GON and ING but tended to decrease it in female GON.
Overexpression of MMP3 in 3T3-L1 Cells Inhibited Adipogenesis
We next tested whether MMP3 regulated adipogenesis using an overexpression approach in a well-established cell model. 3T3-L1 preadipocytes were transfected with a Tet-off doxycycline-inhibited lentivirus and differentiated in the absence or presence of doxycycline (1 μg/ml), following a standard protocol. Overexpression of MMP3 (3- to 5-fold; Fig. 7A) reduced differentiation, as evidenced by lower expression of Fabp4 and Pparγ mRNA, FABP4 protein (Fig. 7, B–D), and lipid droplet accumulation, determined with Oil Red O staining (Fig. 7E).
Fig. 7.
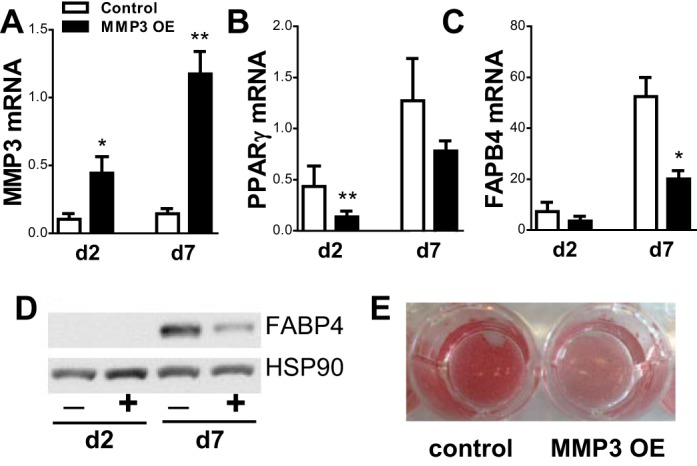
Overexpression of MMP3 in 3T3-L1 cells inhibits adipogenesis. Deoxycycline was removed at confluence, inducing overexpression of MMP3. A–D: expression levels of MMP3 (A) and markers of differentiation peroxisome proliferator-activated receptor-γ (PPARγ; B), fatty acid-binding protein 4 (FABP4) mRNA (C), and FABP4 protein (D). E:Oil Red O staining of control and overexpressed adipocytes 7 days postdifferentiation. *P < 0.05 and **P < 0.01; n = 4–5. HSP90, heat shock protein 90.
rhTimp4 Promoted Differentiation of Primary Human Preadipocytes and Attenuated the Inhibitory Effect of rhMMP3
To test the hypothesis that secreted MMP3 and TIMP4 modulate adipogenesis in primary adipocytes, we added recombinant human MMP3 (rhMMP3) and TIMP4 (rhTIMP4) to human preadipocytes during differentiation induction. Addition of rhMMP3 decreased adipogenesis by 25 ± 5 (10 ng/ml) and 58 ± 17% (100 ng/ml), as determined by PPARγ protein levels on day 12 of differentiation (Fig. 8). rhTIMP4 (500 ng/ml) added in the absence of exogenous rhMMP3 improved adipogenesis twofold. In addition, rhTIMP4 attenuated the antiadipogenic effects of rhMMP3.
Fig. 8.

Addition of TIMP4 blocks the antiadipogenic effects of MMP3 in human preadipocytes. Two-day postconfluent human preadipocytes were differentiated with recombinant human (rh)MMP3 (0, 10, and 100 ng/ml) in the absence or presence of rhTIMP4 (500 ng/ml) and maintained until day 12 of differentiation. A: representative images of 4 independent experiments. B and C: protein expression levels of adipose triglyceride lipase (ATGL) and PPARγ were measured on day 12 of differentiation (B), and PPARγ protein levels relative to HSP90 were quantified (C); n = 4–5. *P < 0.05, effects of rhMMP3; #P < 0.05, effects of rhTIMP4.
DISCUSSION
A limited capacity for adipose tissue expansion via recruitment and differentiation of APCs is considered a key factor in adipose inflammation and thereby the development of metabolic complications of obesity (10). Depot and sex differences in adipose tissue expansion via hyperplasia are well documented. A large body of literature (5, 23, 41, 45) indicates that the male GON (epididymal) depot lacks the capacity for net hyperplasia (i.e., increased mature adipocyte number) and expands mainly by hypertrophy. Excess hypertrophy is thought to result in pathological remodeling in association with macrophage recruitment, inflammation, and adipocyte death (39). In the current work, by measuring net changes in adipocyte numbers in response to a 45% HFD, we document expansion by hyperplasia in female but not male GON, which actually appeared to decrease at the time point studied. We highlight a potential mechanism that could signal APC recruitment when a critical, large adipocyte size is reached. The timing of this signal is sex and depot dependent in a manner that is consistent with the classic hypothesis that a critical adipocytes size stimulates APC differentiation (5). Our results highlight the potential importance of sex and depot differences in the regulation of Mmp3 and Timp4 as determinants of APC differentiation and thus the ability of each depot to expand by hyperplasia.
MMP3 Is Expressed in APCs and May Play a Critical Role in Determining Sex- and Depot-Dependent Hyperplasia
A novel finding in our study is that mouse APCs express Mmp3, consistent with a previous report in human preadipocytes (7). Consistent with the hypothesis that MMP3 expressed in APCs restrains adipogenesis in mouse adipose tissue in vivo, the HFD markedly decreased MMP3 protein in female GON and increased fat cell number. In contrast, the HFD increased MMP3 protein and activity in male GON and decreased the number of mature fat cells. Supporting evidence for a critical role of MMP3 as an inhibitor of APC differentiation was provided by findings that overexpression of Mmp3 inhibited differentiation of 3T3-L1 preadipocytes and that addition of rhMMP3 in primary human preadipocytes inhibited differentiation in a dose-dependent manner, which also suggests translational relevance. Future studies are needed to establish the in vivo importance of MMP3 in regulating the recruitment of APCs and hyperplastic growth in mice as well as humans.
Our finding that Mmp3 was expressed almost exclusively in APCs suggests that it acts in an autocrine or local manner to restrict progression toward differentiation and lipid filling. Compared with LF-fed males, LF-fed females had a higher ratio of APCs to adipocytes in both GON and ING. This finding suggests that female depots are poised to expand their adipose tissue by hyperplasia as needed to safely store energy in response to a positive energy balance, as illustrated in Fig. 9, A and B. APCs isolated from ING compared with the GON depots of both sexes had much higher expression levels of Mmp3 mRNA in association with smaller adipocytes, suggesting that ING adipose tissue expansion would proceed by hypertrophy, as observed.
Fig. 9.

Model for sex differences in adipose tissue growth in response to HF feeding. A: in female GON LF-fed mice, there is a larger pool of preadipocytes than in males. In male GON, the high-fat diet (HFD) increases number of APCs, and their progression toward differentiation is restrained by high MMP3 expression, creating an autocrine loop that restrains adipogenesis. As activated macrophages accumulate in the tissue, inflammatory cytokines from activated macrophages also may contribute to the inhibition of adipogenesis in a paracrine loop, and growth proceeds by hypertrophy of existing adipocytes, which become dysfunctional and die. In female GON, the HFD causes a decrease in MMP3 expression that triggers an increase in adipocyte number by APC differentiation, but the number of APCs remains constant, presumably as they also proliferate. Although the HFD did not significantly affect TIMP4 protein at the time point studied, the ratio of TIMP4 to MMP3 protein tended to increase in females but decreased in males (as also observed in ING; B). We postulate that TIMP4 may serve as a signal of adipocyte enlargement that further inhibits MMP3 secreted by preadipocytes, permitting the differentiation of preadipocytes and the appearance of new, smaller adipocytes (hyperplasia) in females that can fill over time, resulting in healthy tissue expansion. B: In LF-fed mice, ING adipocytes are smaller than GON in both sexes. With HF feeding in males, tissue growth occurs by hypertrophy, and high MMP3 in preadipocytes restrains their recruitment. In females, HFD significantly decreased MMP3 protein expression, and TIMP4 did not change; the resulting higher TIMP4/MMP3 may contribute to the effect of the HFD to lower MMP3 activity (per mg tissue), which would facilitate their maturation and lipid filling. The resulting hyperplastic expansion is evidenced by an initial accumulation of new, smaller adipocytes (illustrated) that eventually fill with lipid. The timing of these changes likely varies among animals that have different-sized adipocytes at baseline and, therefore, depend on the time of overfeeding or a magnitude of the HFD challenge.
Potential depot- and sex-dependent alterations in APC numbers in response to a HFD challenge are difficult to assess, as there are sex differences in depot weights, adipocyte size, and adipocyte number per depot. To address this issue, we examined the expression of APC number per depot within sex and also relative to the adipocyte number. In male GON, the HFD led to a substantial increase in APC number with higher Mmp3 expression, and their further progression through the final stages of adipogenesis is apparently stalled. Consistent with this idea, both Macotela et al. (27) and Joe et al. (18) found that male GON APCs are less adipogenic or require additional growth factor stimulation to differentiate. Our data indicate that high levels of MMP3 expression in male GON APCs, likely coupled with high levels of inflammatory factors within the depot, may prevent their full differentiation/lipid filling.
Recent lineage-tracing studies indicate that GON depots of young male mice challenged with a HFD have a higher capacity to recruit adipocyte progenitors that become mature adipocytes compared with ING (15, 16, 45). However, because the number of adipocytes per depot was not calculated, it is not possible to determine whether there is hyperplasia in the sense that the total number of mature adipocytes (new + old) increased. It is theoretically possible that new adipocytes that were labeled with the lineage tracer replaced dead ones during a remodeling process (41) so that the total number of mature adipocytes remained the same or declined, as we observed in the current study.
A recent study by Jeffery et al. (15) provided evidence for hyperplasia (new adipocytes) in both GON and ING in female mice fed HFD. We also found that the HFD led to increased numbers of adipocytes in female GON, as determined by calculation using depot weight and mean fat cell size in the current study. It seems likely that we did not detect an increase in adipocyte number in female ING because we started the HFD slightly later and used a 45% (by calories) HFD fed for 14 wk compared with the 60% HFD fed from 8 to 16 wk. Furthermore, it is important to note that ING adipocytes are smaller than GON. Thus, substantial depot growth by hypertrophy could proceed in ING compared with GON before recruitment and differentiation of APCs was needed for “safe storage.” Indeed, a number of observations in the literature are consistent with this idea. Using the data reported by Medrikova et al. (32), who studied male and female C57BL/6N fed a 60% HFD since weaning, we estimated adipocyte number by dividing mean depot weight by mean adipocyte weight between weeks 15 and 35 and found an increase in adipocyte numbers in female GON (4- to 5-fold), with little change in ING adipocyte numbers (~1.2-fold), whereas both depots of males increased only 1.3- to 1.4-fold. Similarly, Lemonnier (23) found that HF markedly increased female GON but not ING adipocyte number in Swiss mice after 32 wk of feeding. Johnson and Hirsch (19) found that with extreme obesity the most marked hyperplasia occurs in ING of female genetically obese hyperglycemic mice. With a longer period (20 wk) of a very HFD (60%) feeding, Strissel et al. (41) observed an increase in male ING adipocyte number. Altogether, these results are consistent with the hypothesis that adipose tissues of females, especially the ING, require a longer challenge for the small adipocytes in this depot to accumulate a critical size and to trigger an increase adipocyte number. Detailed time course studies using tools such as the Adipochaser mouse (45) are needed to address this question and to assess the roles of MMP3 and TIMPs in this process.
Potential Role of MMP3 in Adipose Growth and Remodeling
It is likely that MMP3 is secreted into the ECM, where it degrades the fibronectin-rich matrix of fibroblast-like early adipocyte progenitors, facilitating their commitment to an adipogenic differentiation process (11, 25). Once they are committed, the higher production of MMP3 may degrade basement membrane proteins surrounding adipocytes, namely laminin and collagen IV, known substrates of this enzyme, which limit further differentiation/maturation (30). The hypertrophic obesity of hyperphagic male Mmp3-KO mice fits with the above model (28). Unfortunately, the phenotype of female Mmp3 KO mice under HFD has not been analyzed. Further studies using adipose-specific Mmp3 KO would be important to test its importance in determining sex and depot differences in adipogenesis and adipocyte hyperplasia as a function of time of HF feeding. Because two-dimensional cell culture may not accurately reflect the in vivo situation, the function of Mmp3 activity must be studied in a temporally refined manner using a three-dimensional adipocyte differentiation culture model (4).
Mmp3 may also play roles in the regulation of gene expression independent of its enzymatic activity. A study by Kessenbrock et al. (20) demonstrated a nonproteolytic function of Mmp3 via binding with Wnt5b through its hemopexin domain, thus removing inhibition of Wnt5b on stem and progenitor cell proliferation capacity. However, the ability of exogenously added rhMMP3 to suppress adipogenesis suggests that an effect on ECM remodeling is sufficient to inhibit adipogenesis in primary cultured human adipocytes. Our studies do not directly demonstrate the causal role for the decline in MMP3 to APC recruitment and full differentiation. Further studies in which MMP3 activities are conditionally manipulated in vivo are needed to address this mechanistic question.
Little is known about the mechanisms upregulating Mmp3 expression in sc vs. visceral adipose tissues and downregulating its activity and protein expression in females in response to a HFD-induced obesity. Chronic inflammation driven by HFD may upregulate MMP3 expression in male adipose depots (7, 34). Because we found no difference in Mmp3 mRNA expression in ovariectomized females in our microarray analyses of mice fed HFD (12), we do not think estrogen is a likely mediator of the sex difference. However, Jeffery et al. (16) recently observed that ovariectomy decreases and estrogen enhances BrdU labeling of APCs, so analysis of the balance of Timps and Mmps by sex steroids clearly merits further study.
Timp4 May Provide a Signal from Adipocyte to APCs to Modulate APC Differentiation
Timp4 was expressed mainly in adipocytes with very low levels in APCs. Our results indicate a potential role for TIMP4 in limiting MMP3 activity. In HFD-fed males, TIMP4 protein expression increased and its ratio to MMP3 protein decreased, which could contribute to the higher tissue MMP3 activity. In females, the ratio of TIMP4 to MMP3 protein increased, which could contribute to the lower tissue MMP3 activity. Because the adipocyte size and the hyperplastic response is a dynamic process that varies over time and among individuals, a transient change in MMP3 and TIMPs may have been missed by only assessing a single time point.
The function of TIMP4 in adipogenesis may be more complex than the inhibition of MMP3 activity. A recent report indicated that knockdown of Timp4 in 3T3-L1 preadipocytes promotes the late phases of differentiation, i.e., lipid accumulation (33). In contrast, we found that the addition of exogenous rhTIMP4 improved the differentiation of primary human adipocytes, suggesting that the effect may be cell model dependent; i.e., it could depend on the level of adipogenic commitment of the APCs. TIMP4 may also inhibit MMP14 (MT1-MMP), which is known to be essential for adipogenesis (4), as suggested by studies of remodeling myocardium (42), so its effects in vivo are likely complex. Nevertheless, altogether, our work led us to speculate that the timing of the increase in TIMP4 in relation to increased adipocyte size may restrain the local activity of APC MMP3 and hence, promote the final stages of adipogenesis/lipid filling.
Although we focused on TIMP4 as a potential modulator of MMP3 activity and hence, APC recruitment, TIMP1 may be an additional factor that contributes to excess ECM remodeling in male GON. HFD increased Timp1 mRNA severalfold in males and may also modulate the expansion capacity of adipose depots via effects on vascularity (38). In addition, higher inflammatory cytokines and chemokines that are produced from macrophages may also contribute directly to the apparent inability of male GON preadipocytes to differentiate (12).
A limitation of our study is that we were only able to analyze three samples of adipose tissue homogenates for MMP3 and TIMP4 protein levels and activity. Variability among samples is evident, which is likely to be related to interindividual variations in adipocyte size and, therefore, the time course of the predicted dynamic changes over time of HF feeding. The local concentrations of MMP3 and TIMPs proximal to APCs may be a critical determinant of differentiation. Expression of data on MMP3 activity relative to tissue weight is unlikely to capture these local interactions. Additional studies with more animals and multiple time points as well as protein-protein interactions within the ECM of the depot are clearly needed to expand our current findings.
Visceral vs. Subcutaneous Depots: Are GON and ING Typical?
Our data also show that the inflammation and pathological remodeling that occurs in the epididymal (GON) adipose tissue of males is similar to that which occurs in a true “visceral” depot, MES, at least as judged by changes at the level of mRNA. Mmp12 and other macrophage markers were higher in both MES and GON than in sc depots (ING and DSC), whereas Mmp3 showed the opposite trend. Based on gene expression of F4/80, Cd11c, and Mmp12 and the number of crown-like structures observed in histological sections, MES fat was ~50% less inflamed than GON in males but much more inflamed than sc depots. In addition, our findings importantly show that high Mmp3 mRNA expression occurs in both major sc adipose tissues of both sexes, the DSC and ING. Thus, the role of MMP3 in adipose tissue growth extends beyond its role in the remodeling of the ING (i.e., mammary) fat pad of females during the involution of this depot after lactation (1).
Summary and Conclusion
In conclusion, there are major sex and depot differences in gene expression of Mmps and their inhibitors, Timps, during murine adipose tissue remodeling. Specifically, Mmp3 gene is expressed in APCs and may play a role in modulating the recruitment and lipid filling of APCs and hence, the growth and healthy remodeling of adipose tissues in females. The sex-dependent depot differences in the expression of Mmp3 and Timps suggest that sexual dimorphisms in net MMP3 proteolytic activity or other functions of these proteins may remodel the adipose tissue ECM and thereby sex and depot differences in adipose tissue expansion by hypertrophy and hyperplasia. A recent report from Singer et al. (39) used bone marrow transplant studies to show that sex differences in hematopoietic stem cells contribute to sex differences in the inflammatory response to diet-induced obesity. The interplay of sex differences in different cell types in adipose remodeling will be an important topic for future studies.
Collectively, our data support the hypothesis that downregulation of MMP3 is critical to trigger APC to fully differentiate and fill with lipid and that the balance of adipocyte production of TIMP4 and APC production of MMP3 may contribute to hyperplastic adipose depot growth. A deepened understanding of these processes is a key to understanding the ability of females for hyperplastic expansion of sc adipose tissues (19), allowing them to resist adipose tissue inflammation and maintain metabolic health during the development of dietary-induced obesity.
GRANTS
This work was supported by R24-DK-087669, a grant from the Evans Center for Biochemical Research (Affinity Research Collaborative on Sex Differences in Adipose Tissue, Obesity, and Related Metabolic Disease), R01-DK-080448, and the Adipocyte Core of the Boston Nutrition and Obesity Research Center (P30-DK-046200).
DISCLOSURES
No conflicts of interest, financial or otherwise, are declared by the authors.
AUTHOR CONTRIBUTIONS
Y.W., M.-J.L., and S.K.F. conceived and designed research; Y.W., M.-J.L., and Y.I. performed experiments; Y.W., M.-J.L., Y.I., and S.K.F. analyzed data; Y.W., M.-J.L., and S.K.F. interpreted results of experiments; Y.W. and M.-J.L. prepared figures; Y.W. and S.K.F. drafted manuscript; M.-J.L. and S.K.F. edited and revised manuscript; M.-J.L. and S.K.F. approved final version of manuscript.
ACKNOWLEDGMENTS
We thank Dr. Andrew S. Greenberg for assistance in facilitating some of the FACS analyses. We also thank the Society for Women’s Health Research and all members of the network on sex differences in obesity, especially Deb Clegg and Kevin Grove, for their work on the original microarray study (12) that provided the inspiration for this study.
REFERENCES
- 1.Alexander CM, Selvarajan S, Mudgett J, Werb Z. Stromelysin-1 regulates adipogenesis during mammary gland involution. J Cell Biol 152: 693–703, 2001. doi: 10.1083/jcb.152.4.693. [DOI] [PMC free article] [PubMed] [Google Scholar]
- 2.Cacicedo JM, Benjachareonwong S, Chou E, Yagihashi N, Ruderman NB, Ido Y. Activation of AMP-activated protein kinase prevents lipotoxicity in retinal pericytes. Invest Ophthalmol Vis Sci 52: 3630–3639, 2011. doi: 10.1167/iovs.10-5784. [DOI] [PMC free article] [PubMed] [Google Scholar]
- 3.Chavey C, Mari B, Monthouel MN, Bonnafous S, Anglard P, Van Obberghen E, Tartare-Deckert S. Matrix metalloproteinases are differentially expressed in adipose tissue during obesity and modulate adipocyte differentiation. J Biol Chem 278: 11888–11896, 2003. doi: 10.1074/jbc.M209196200. [DOI] [PubMed] [Google Scholar]
- 4.Chun TH, Hotary KB, Sabeh F, Saltiel AR, Allen ED, Weiss SJ. A pericellular collagenase directs the 3-dimensional development of white adipose tissue. Cell 125: 577–591, 2006. doi: 10.1016/j.cell.2006.02.050. [DOI] [PubMed] [Google Scholar]
- 5.Faust IM, Johnson PR, Stern JS, Hirsch J. Diet-induced adipocyte number increase in adult rats: a new model of obesity. Am J Physiol Endocrinol Metab 235: E279–E286, 1978. [DOI] [PubMed] [Google Scholar]
- 6.Folch J, Lees M, Sloane Stanley GH. A simple method for the isolation and purification of total lipides from animal tissues. J Biol Chem 226: 497–509, 1957. [PubMed] [Google Scholar]
- 7.Gao D, Bing C. Macrophage-induced expression and release of matrix metalloproteinase 1 and 3 by human preadipocytes is mediated by IL-1β via activation of MAPK signaling. J Cell Physiol 226: 2869–2880, 2011. doi: 10.1002/jcp.22630. [DOI] [PubMed] [Google Scholar]
- 8.Gerin I, Louis GW, Zhang X, Prestwich TC, Kumar TR, Myers MG Jr, Macdougald OA, Nothnick WB. Hyperphagia and obesity in female mice lacking tissue inhibitor of metalloproteinase-1. Endocrinology 150: 1697–1704, 2009. doi: 10.1210/en.2008-1409. [DOI] [PMC free article] [PubMed] [Google Scholar]
- 9.Goldrick RB. Morphological changes in the adipocyte during fat deposition and mobilization. Am J Physiol 212: 777–782, 1967. [DOI] [PubMed] [Google Scholar]
- 10.Gray SL, Vidal-Puig AJ. Adipose tissue expandability in the maintenance of metabolic homeostasis. Nutr Rev 65: S7–S12, 2007. doi: 10.1301/nr.2007.jun.S7-S12. [DOI] [PubMed] [Google Scholar]
- 11.Gregoire FM, Smas CM, Sul HS. Understanding adipocyte differentiation. Physiol Rev 78: 783–809, 1998. [DOI] [PubMed] [Google Scholar]
- 12.Grove KL, Fried SK, Greenberg AS, Xiao XQ, Clegg DJ. A microarray analysis of sexual dimorphism of adipose tissues in high-fat-diet-induced obese mice. Int J Obes (Lond) 34: 989–1000, 2010. doi: 10.1038/ijo.2010.12. [DOI] [PMC free article] [PubMed] [Google Scholar]
- 13.Ido Y, Duranton A, Lan F, Cacicedo JM, Chen TC, Breton L, Ruderman NB. Acute activation of AMP-activated protein kinase prevents H2O2-induced premature senescence in primary human keratinocytes. PLoS One 7: e35092, 2012. doi: 10.1371/journal.pone.0035092. [DOI] [PMC free article] [PubMed] [Google Scholar]
- 14.Jaworski DM, Sideleva O, Stradecki HM, Langlois GD, Habibovic A, Satish B, Tharp WG, Lausier J, Larock K, Jetton TL, Peshavaria M, Pratley RE. Sexually dimorphic diet-induced insulin resistance in obese tissue inhibitor of metalloproteinase-2 (TIMP-2)-deficient mice. Endocrinology 152: 1300–1313, 2011. doi: 10.1210/en.2010-1029. [DOI] [PMC free article] [PubMed] [Google Scholar]
- 15.Jeffery E, Church CD, Holtrup B, Colman L, Rodeheffer MS. Rapid depot-specific activation of adipocyte precursor cells at the onset of obesity. Nat Cell Biol 17: 376–385, 2015. doi: 10.1038/ncb3122. [DOI] [PMC free article] [PubMed] [Google Scholar]
- 16.Jeffery E, Wing A, Holtrup B, Sebo Z, Kaplan JL, Saavedra-Peña R, Church CD, Colman L, Berry R, Rodeheffer MS. The Adipose Tissue Microenvironment Regulates Depot-Specific Adipogenesis in Obesity. Cell Metab 24: 142–150, 2016. doi: 10.1016/j.cmet.2016.05.012. [DOI] [PMC free article] [PubMed] [Google Scholar]
- 17.Jo J, Gavrilova O, Pack S, Jou W, Mullen S, Sumner AE, Cushman SW, Periwal V. Hypertrophy and/or Hyperplasia: Dynamics of Adipose Tissue Growth. PLoS Comput Biol 5: e1000324, 2009. doi: 10.1371/journal.pcbi.1000324. [DOI] [PMC free article] [PubMed] [Google Scholar]
- 18.Joe AW, Yi L, Even Y, Vogl AW, Rossi FM. Depot-specific differences in adipogenic progenitor abundance and proliferative response to high-fat diet. Stem Cells 27: 2563–2570, 2009. doi: 10.1002/stem.190. [DOI] [PubMed] [Google Scholar]
- 19.Johnson PR, Hirsch J. Cellularity of adipose depots in six strains of genetically obese mice. J Lipid Res 13: 2–11, 1972. [PubMed] [Google Scholar]
- 20.Kessenbrock K, Dijkgraaf GJ, Lawson DA, Littlepage LE, Shahi P, Pieper U, Werb Z. A role for matrix metalloproteinases in regulating mammary stem cell function via the Wnt signaling pathway. Cell Stem Cell 13: 300–313, 2013. doi: 10.1016/j.stem.2013.06.005. [DOI] [PMC free article] [PubMed] [Google Scholar]
- 21.Lee MJ, Fried SK. Optimal protocol for the differentiation and metabolic analysis of human adipose stromal cells. Methods Enzymol 538: 49–65, 2014. doi: 10.1016/B978-0-12-800280-3.00004-9. [DOI] [PMC free article] [PubMed] [Google Scholar]
- 22.Lee MJ, Yang RZ, Gong DW, Fried SK. Feeding and insulin increase leptin translation. Importance of the leptin mRNA untranslated regions. J Biol Chem 282: 72–80, 2007. doi: 10.1074/jbc.M609518200. [DOI] [PubMed] [Google Scholar]
- 23.Lemonnier D. Effect of age, sex, and sites on the cellularity of the adipose tissue in mice and rats rendered obese by a high-fat diet. J Clin Invest 51: 2907–2915, 1972. doi: 10.1172/JCI107115. [DOI] [PMC free article] [PubMed] [Google Scholar]
- 24.Lijnen HR, Demeulemeester D, Van Hoef B, Collen D, Maquoi E. Deficiency of tissue inhibitor of matrix metalloproteinase-1 (TIMP-1) impairs nutritionally induced obesity in mice. Thromb Haemost 89: 249–255, 2003. [PubMed] [Google Scholar]
- 25.Lilla J, Stickens D, Werb Z. Metalloproteases and adipogenesis: a weighty subject. Am J Pathol 160: 1551–1554, 2002. doi: 10.1016/S0002-9440(10)61100-5. [DOI] [PMC free article] [PubMed] [Google Scholar]
- 26.Lund LR, Rømer J, Thomasset N, Solberg H, Pyke C, Bissell MJ, Danø K, Werb Z. Two distinct phases of apoptosis in mammary gland involution: proteinase-independent and -dependent pathways. Development 122: 181–193, 1996. [DOI] [PMC free article] [PubMed] [Google Scholar]
- 27.Macotela Y, Emanuelli B, Mori MA, Gesta S, Schulz TJ, Tseng YH, Kahn CR. Intrinsic differences in adipocyte precursor cells from different white fat depots. Diabetes 61: 1691–1699, 2012. doi: 10.2337/db11-1753. [DOI] [PMC free article] [PubMed] [Google Scholar]
- 28.Maquoi E, Demeulemeester D, Vörös G, Collen D, Lijnen HR. Enhanced nutritionally induced adipose tissue development in mice with stromelysin-1 gene inactivation. Thromb Haemost 89: 696–704, 2003. [PubMed] [Google Scholar]
- 29.Maquoi E, Munaut C, Colige A, Collen D, Lijnen HR. Modulation of adipose tissue expression of murine matrix metalloproteinases and their tissue inhibitors with obesity. Diabetes 51: 1093–1101, 2002. doi: 10.2337/diabetes.51.4.1093. [DOI] [PubMed] [Google Scholar]
- 30.Mariman EC, Wang P. Adipocyte extracellular matrix composition, dynamics and role in obesity. Cell Mol Life Sci 67: 1277–1292, 2010. doi: 10.1007/s00018-010-0263-4. [DOI] [PMC free article] [PubMed] [Google Scholar]
- 31.Martinez-Santibanez G, Singer K, Cho KW, DelProposto JL, Mergian T, Lumeng CN. Obesity-induced remodeling of the adipose tissue elastin network is independent of the metalloelastase MMP-12. Adipocyte 4: 264–272, 2015. doi: 10.1080/21623945.2015.1027848. [DOI] [PMC free article] [PubMed] [Google Scholar]
- 32.Medrikova D, Jilkova ZM, Bardova K, Janovska P, Rossmeisl M, Kopecky J. Sex differences during the course of diet-induced obesity in mice: adipose tissue expandability and glycemic control. Int J Obes (Lond) 36: 262–272, 2012. doi: 10.1038/ijo.2011.87. [DOI] [PubMed] [Google Scholar]
- 33.Mejia-Cristobal LM, Reus E, Lizarraga F, Espinosa M, Ceballos-Cancino G, López TV, Garay S, Maldonado V, Melendez-Zajgla J. Tissue inhibitor of metalloproteases-4 (TIMP-4) modulates adipocyte differentiation in vitro. Exp Cell Res 335: 207–215, 2015. doi: 10.1016/j.yexcr.2015.05.006. [DOI] [PubMed] [Google Scholar]
- 34.O’Hara A, Lim FL, Mazzatti DJ, Trayhurn P. Microarray analysis identifies matrix metalloproteinases (MMPs) as key genes whose expression is up-regulated in human adipocytes by macrophage-conditioned medium. Pflugers Arch 458: 1103–1114, 2009. 10.1007/s00424-009-0693-8. [DOI] [PubMed] [Google Scholar]
- 35.Pellegrinelli V, Carobbio S, Vidal-Puig A. Adipose tissue plasticity: how fat depots respond differently to pathophysiological cues. Diabetologia 59: 1075–1088, 2016. doi: 10.1007/s00125-016-3933-4. [DOI] [PMC free article] [PubMed] [Google Scholar]
- 36.Rodeheffer MS, Birsoy K, Friedman JM. Identification of white adipocyte progenitor cells in vivo. Cell 135: 240–249, 2008. doi: 10.1016/j.cell.2008.09.036. [DOI] [PubMed] [Google Scholar]
- 37.Rodríguez D, Morrison CJ, Overall CM. Matrix metalloproteinases: what do they not do? New substrates and biological roles identified by murine models and proteomics. Biochim Biophys Acta 1803: 39–54, 2010. doi: 10.1016/j.bbamcr.2009.09.015. [DOI] [PubMed] [Google Scholar]
- 38.Scroyen I, Jacobs F, Cosemans L, De Geest B, Lijnen HR. Blood vessel density in de novo formed adipose tissue is decreased upon overexpression of TIMP-1. Obesity (Silver Spring) 18: 638–640, 2010. doi: 10.1038/oby.2009.279. [DOI] [PubMed] [Google Scholar]
- 39.Singer K, Maley N, Mergian T, DelProposto J, Cho KW, Zamarron BF, Martinez-Santibanez G, Geletka L, Muir L, Wachowiak P, Demirjian C, Lumeng CN. Differences in Hematopoietic Stem Cells Contribute to Sexually Dimorphic Inflammatory Responses to High Fat Diet-induced Obesity. J Biol Chem 290: 13250–13262, 2015. doi: 10.1074/jbc.M114.634568. [DOI] [PMC free article] [PubMed] [Google Scholar]
- 40.Stetler-Stevenson WG. The tumor microenvironment: regulation by MMP-independent effects of tissue inhibitor of metalloproteinases-2. Cancer Metastasis Rev 27: 57–66, 2008. doi: 10.1007/s10555-007-9105-8. [DOI] [PMC free article] [PubMed] [Google Scholar]
- 41.Strissel KJ, Stancheva Z, Miyoshi H, Perfield JW II, DeFuria J, Jick Z, Greenberg AS, Obin MS. Adipocyte death, adipose tissue remodeling, and obesity complications. Diabetes 56: 2910–2918, 2007. doi: 10.2337/db07-0767. [DOI] [PubMed] [Google Scholar]
- 42.Takawale A, Fan D, Basu R, Shen M, Parajuli N, Wang W, Wang X, Oudit GY, Kassiri Z. Myocardial recovery from ischemia-reperfusion is compromised in the absence of tissue inhibitor of metalloproteinase 4. Circ Heart Fail 7: 652–662, 2014. doi: 10.1161/CIRCHEARTFAILURE.114.001113. [DOI] [PubMed] [Google Scholar]
- 43.Tchoukalova YD, Votruba SB, Tchkonia T, Giorgadze N, Kirkland JL, Jensen MD. Regional differences in cellular mechanisms of adipose tissue gain with overfeeding. Proc Natl Acad Sci U S A 107: 18226–18231, 2010. doi: 10.1073/pnas.1005259107. [DOI] [PMC free article] [PubMed] [Google Scholar]
- 44.Verstappen J, Von den Hoff JW. Tissue inhibitors of metalloproteinases (TIMPs): their biological functions and involvement in oral disease. J Dent Res 85: 1074–1084, 2006. doi: 10.1177/154405910608501202. [DOI] [PubMed] [Google Scholar]
- 45.Wang QA, Tao C, Gupta RK, Scherer PE. Tracking adipogenesis during white adipose tissue development, expansion and regeneration. Nat Med 19: 1338–1344, 2013. doi: 10.1038/nm.3324. [DOI] [PMC free article] [PubMed] [Google Scholar]