Abstract
Many neurons exhibit interval correlations in the absence of input signals. We study the influence of these intrinsic interval correlations of model neurons on their signal transmission properties. For this purpose, we employ two simple firing models, one of which generates a renewal process, while the other leads to a nonrenewal process with negative interval correlations. Different methods to solve for spectral statistics in the presence of a weak stimulus (spike train power spectra, cross spectra, and coherence functions) are presented, and their range of validity is discussed. Using these analytical results, we explore a lower bound on the mutual information rate between output spike train and input stimulus as a function of the system’s parameters. We demonstrate that negative correlations in the baseline activity can lead to enhanced information transfer of a weak signal by means of noise shaping of the background noise spectrum. We also show that an enhancement is not compulsory—for a stimulus with power exclusively at high frequencies, the renewal model can transfer more information than the nonrenewal model does. We discuss the application of our analytical results to other problems in neuroscience. Our results are also relevant to the general problem of how a signal affects the power spectrum of a nonlinear stochastic system.
I. INTRODUCTION
The study of spiking models has important applications in neuroscience, laser physics, and other areas of research. In particular, in neuroscience, studying models of a neuron may contribute to an understanding of how sensory nerve cells have evolutionarily adapted to their main task, which is signal transmission and processing. Specifically, given that many neurons show in vivo a spontaneous spiking (or baseline) activity without any external stimulation, one may pose the following question: What are the properties of the spontaneous activity that lead to an enhancement of neural signal transfer?
We cannot, of course, answer this question fully. In this paper, we focus on a single aspect of the spontaneous activity, correlations in the interval sequence of the base-line activity. Spike trains with interspike interval (ISI) correlations are in general referred to as nonrenewal processes, as opposed to renewal processes, for which the ISIs are statistically independent [1]. The class of nonrenewal neurons also includes bursting cells.
ISI correlations have been observed in spontaneous spike trains generated by sensory neurons [2–7]. The P unit of the weakly electric fish, for instance, shows a pronounced negative correlation between adjacent ISIs [8,9], implying that a short ISI is followed by a long one, and vice versa. The nonrenewal property of these spike trains constitutes extended memory in the spike train. Memory in the spike train (but not necessarily in the interval sequence) at short time scales is well-known for neurons and can also be observed for renewal neurons—during a short period after firing (a refractory period), the probability of another spike is considerably reduced. Since the negative correlations look further back into the spike history of the neuron, the negative correlations have been sometimes also interpreted as cumulative refractoriness [10].
Researchers have speculated about the potential rôle of negative ISI correlations for the detection and transmission of external signals. It was shown theoretically that negative ISI correlations reduce the detection error when static stimuli are present [8]. Furthermore, encoding the transfer of a time-varying stimulus (e.g., a band-pass-limited white noise) can be enhanced by negative correlations in the spontaneous neural activity. This was demonstrated in Ref. [10] by comparing the mutual information between stimulus and spike train for two models of the P unit—a renewal and a nonrenewal model. The model with ISI correlation was a so-called leaky integrate-and-fire with dynamical threshold (LIFDT) model that had been proposed in Ref. [9]. Remarkably, the gain in mutual information seen for the nonrenewal LIFDT model was maximum for a finite cutoff frequency of the stimulus. These findings were numerically achieved and were thus limited in giving insights about the dynamical mechanism by which negative correlations lead to an enhancement of neural information transmission.
The analytical treatment of models like the LIFDT model that generate nonrenewal spike trains is quite difficult. For the comparably simple case that ISI correlations are induced by an external stimulus, a number of analytical results for the serial correlations among intervals have been achieved only recently [11,12]. A model with strong negative ISI correlations inherent to the spontaneous activity was analytically treated in our recent paper [13]. There we compared this model to a renewal model that possesses the same single ISI statistics but does not exhibit negative ISI correlations. (This strategy was the same as in the numerical study in Ref. [10], although analytically more tractable neuron models were used.) We showed that the gain in information transfer of a band-pass-limited white noise is based on a shaping of the background noise spectrum (i.e., a redistribution of spectral power vs frequency) through the negative correlations. We note that such noise-shaping effects have also been found in neuron models with feedback, both at the single-neuron level [14,15] and the network level [16].
In this paper, we give the details of the calculation in Ref. [13], including an approach for the probability density of integrate-and-fire neurons with threshold noise. Additionally, we derive refined analytical expressions for quantities like the power spectrum that are much more accurate than those of our original approach. We note that the approaches used in this paper also bear relevance to the general problem of how a stimulus affects a nonlinear stochastic system, in particular, how the stimulus shapes spectral measures like the power spectrum. This justifies why we have devoted much space to calculational problems that may appear at a first glance as purely technical.
Using the analytical results, we discuss the gain in mutual information through negative correlations as a function of the system’s parameters. We explore furthermore the signal transmission in the case of a band-pass-limited white noise that has a finite lower cutoff frequency. For this latter case, we will demonstrate that a positive gain in information transmission is not always the case—for certain stimuli, a renewal neuron transfers more information about the stimulus than a nonrenewal neuron with a negative ISI correlation. We finally draw some conclusions about the general role of negative ISI correlations in neural signal processing.
Our paper is organized as follows: In Sec. II, we briefly explain the spike train and input-output statistics and describe some important relations that we will use in this paper. In Sec. III, we introduce our simplified models and discuss the spontaneous case. We proceed in Sec. IV with the analytical treatment of the models under stimulation. In Sec. V, we discuss power and cross spectra as well as the coherence function, including a comparison to numerical simulation results for various parameter sets. In Sec. VI the information transfer through renewal and nonrenewal models is studied by means of the mutual information as a function of cutoff frequency for both cases of fixed stimulus intensity and fixed stimulus variance and as a function of the internal noise level. Our results are summarized and discussed in the Sec. VII.
II. SPIKE TRAIN STATISTICS AND INPUT-OUTPUT RELATIONS
Given the firing times of a real neuron or of a neuronal model driven by an external random signal s(t), the spike train constituting the output of the neuron can be written as (Ref. [17])
| (1) |
where the sum is taken over all spiking times. The number of spikes in a time window [0, t], i.e., the spike count, is given by the integrated spike train
| (2) |
The ensemble-averaged spike train gives the instantaneous firing rate of the neuron
| (3) |
Here, the average runs over different realizations of the spike train using one and the same stimulus s(t) (“frozen input noise”). This average may still depend on the preparation of the neuron; here, we assume throughout the stationary state of all internal neuronal variables, i.e., transients are not considered.
If we take an additional average over the stimulus ensemble (in the following, denoted by 〈···〉s), we obtain the stationary (time-independent) firing rate 〈〈x̃(t)〉〉s. It is convenient to subtract this latter quantity and to use a zero-average spike train
| (4) |
From the set of spiking times {tj}, we can also obtain the intervals between subsequent ISIs,
| (5) |
as well as the nth-order intervals given by
| (6) |
Obviously, we have T1,j=Ij.
Given the ISI sequence, we may quantify the correlation among the intervals by the serial correlation coefficient (SCC)
| (7) |
where k is the lag, and the average 〈···〉j is performed over index j.
For the analysis of the signal transmission, it is more convenient to work in the spectral domain. Denoting the Fourier transform of an arbitrary stationary stochastic function by
| (8) |
we can express the power spectrum of the zero average spike train as
| (9) |
where the average includes again both the average over the internal noise as well as the stimulus ensemble. We recall that according to the Wiener-Khinchin theorem, the power spectrum is also obtained by taking the Fourier transform of the spike-spike correlation function
| (10) |
Given a stimulus s(t) with Fourier transform ŝ(f), the cross spectrum between stimulus and spike train can be calculated as
| (11) |
where the asterisk denotes the complex conjugate. While the cross spectrum is an absolute measure of how strongly the spike train and the stimulus are correlated at a certain frequency, one may use the coherence function to quantify how strong the spectral power corresponding to this correlation is when compared to the spectral powers of the spike train and the stimulus. The coherence function is given by
| (12) |
where Sst=〈ŝŝ*〉s is the stimulus spectrum. The coherence is zero if the spike train and stimulus are uncorrelated, and one if they are perfectly correlated.
The knowledge of the spectral quantities and, in particular, the coherence function also allows for a characterization of the information transfer through the neuron. If the stimulus possesses Gaussian statistics, a lower bound on the mutual information rate is given by Refs. [18,19]
| (13) |
where fL and fC indicate the lower and upper cutoff frequencies of the stimulus, respectively. We note that several methods exist to quantify the amount of information transmitted by a neuron. Some studies have taken the approach of directly estimating the information rate from the probability distribution of neural responses [20,21]. This approach estimates information rates without any assumptions on the nature of the neural code. Other studies have taken the approach of estimating the information rate from the ratio of signal and noise power spectral density, on the assumption that the encoded signal sums with noise to produce a response probability distribution that is Gaussian [17,19]. To specify the signal-to-noise ratio, various linear algorithms are used to optimally reconstruct the stimulus from the response or the response from the stimulus [17,18]. This “stimulus reconstruction approach” is efficient and can provide insight about the coding mechanism as well as lending itself to analytical calculations. It will, however, only provide a lower bound on the rate of information transmission, due to the assumptions implicit in the reconstruction algorithm. However, several studies have reported that the addition of nonlinear terms gave little if any increase in the information rate [22,23]. Using Eq. (13), we therefore chose the reconstruction approach to quantify the amount of information available in neural spike trains.
While the spectral functions and the mutual information rate can be obtained numerically from neuronal data or computer simulations of neuronal models, the analytical calculation of the described measures is a nontrivial task for any model beyond the Poisson spike train with signal-modulated rate. In particular, stochastic spike generators like the LIFDT model that show negative ISI correlations in their spontaneous activity are hard to tackle because these models are often multidimensional and strongly nonlinear. For such systems, even the calculation of the mean spontaneous firing rate poses a considerable problem. In the following, we introduce simple dynamical spike models that permit the calculation of the measures introduced earlier in the case of a weak stimulus.
III. THE MODELS AND THEIR SPONTANEOUS ACTIVITY
A. Nonrenewal and renewal models
As in our previous paper [13], we consider two simple, perfect integrate-and-fire (IF) models, henceforth referred to as models A and B, respectively, that share the same statistics of the single ISI but differ in their serial interval correlations. Model A generates a nonrenewal spike train with strong negative ISI correlations. Model B, in contrast, generates a renewal process. The fact that the statistics of the single ISI is the same for both models allows a fair comparison of the signal transmission features with focus on the effect of negative ISI correlations.
For both models, the input is integrated without leakage according to
| (14) |
where μ is a constant base current, and s(t) is the input signal to be transmitted. We do not include an internal noise of the neuron as a fluctuating input current, but rather choose the mathematically simpler construction of noisy threshold and reset points. Such models have been used before in Refs. [24–27]. Note that there is also some experimental evidence for a fluctuating threshold [28].
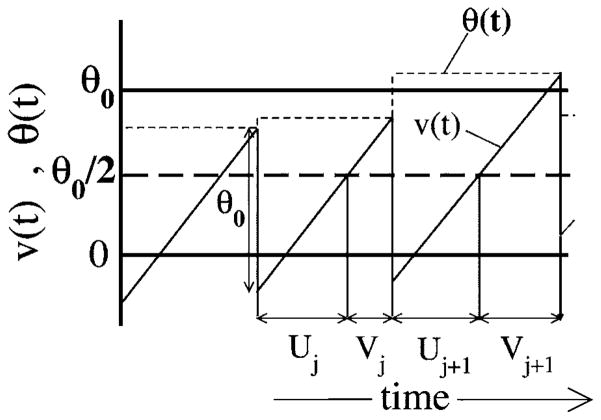
Model A, illustrated in Fig. 1, is obtained by drawing a random threshold Θ(t) from a uniform distribution over the interval [Θ0−D, Θ0+D], with Θ0 being the mean threshold, and D standing for the noise intensity. For the latter, we assume D<Θ0/2. As soon as the voltage v(t) has reached the threshold Θ(t), a spike is fired (not shown), a new threshold is chosen, and the voltage is decremented by Θ0, i.e., v→v−Θ0. Obviously, this kind of voltage reset will lead to a uniform density of reset values, i.e., ΘR ∈ [−D,D]. With a uniformly distributed reset point around v=0 and a uniformly distributed threshold around v=Θ0, we obtain a mean ISI of 〈I〉=Θ0/μ or, equivalently, a stationary firing rate of r0=μ/Θ0. What is most important for model A, though, is the fact that a threshold value and the subsequent reset value are perfectly correlated by the reset rule—if we know the threshold value Θ(t), we know that the next reset value will be ΘR=Θ(t)−Θ0. In fact, this correlation leads to the strong anticorrelation in the ISI sequence in the absence of input [s(t) ≡ 0].
FIG. 1.
The spontaneous dynamics of model A, with voltage and threshold as functions of time. Shown are the voltage v(t) (solid line), which rises linearly with slope μ, as well as the threshold θ(t) (dashed line) for s(t)=0. When v(t)=θ(t), a spike is generated, and the voltage is decremented by θ0 while the threshold is reset to a uniform random value in the interval (θ0−D, θ0+D). Also shown are the ISIs Ij and Ij+1; note that Ij can be divided into the subintervals Uj and Vj such that Ij=Uj+Vj.
For model B (see Fig. 2), we also draw the threshold value for each interval independently. However, after the voltage reaches the threshold Θ(t), the voltage is reset to a random reset value drawn independently from the distribution [−D,D] (we also draw a new value for the threshold at this instant). Since the values of the threshold and reset are completely independent of previous ISIs but determine uniquely the current ISI, it is clear that the resulting spike train for model B will be a renewal process, i.e., all ISIs are mutually independent. On the other hand, note that models A and B share the same statistics of reset and threshold values, and their single ISI statistics will for this reason be the same (including, of course, the mean ISI, which is again given by Θ0/μ).
FIG. 2.
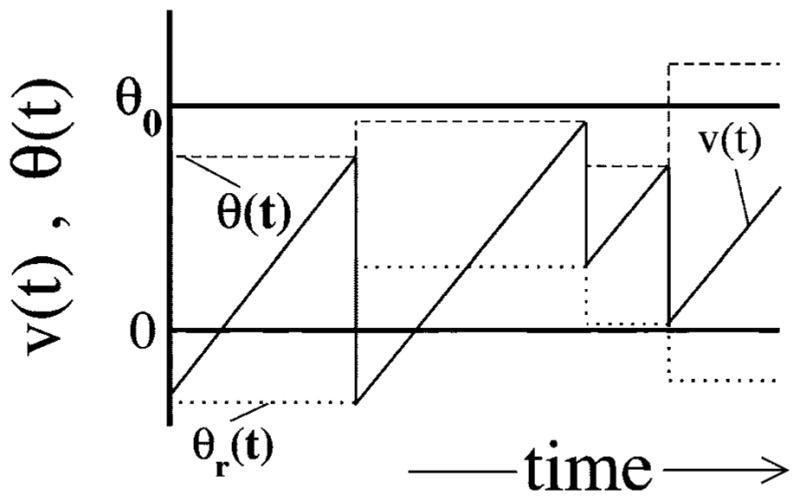
The dynamics of model B in the absence of an input signal are identical to those of model A, except that the voltage is reset to a uniform random value θr(t) (dotted line) in the interval [−D,D] centered on v=0. This eliminates memory and thus ISI correlations.
We note that for both models, we can rescale voltage and time so that the parameters Θ0 and μ are one. This is achieved by choosing ṽ=v/Θ0 and t̃=tμ/Θ0, leading to a rescaled signal s̃(t̃)=s(t̃Θ0/μ)/μ. We do not perform this rescaling here, in order to keep track of physical dimensions, but later in our numerical evaluations, we will set μ=1 and Θ0=1, keeping in mind the redundancy of these parameters.
B. ISI correlations in the spontaneous case
Returning to the spontaneous case [s(t)=0] of model A illustrated in Fig. 1, we see that an ISI Ij can be split up into two contributions
| (15) |
where Uj and Vj are the passage times from the reset point to half of the mean threshold (Θ0/2) and from Θ0/2 to the random threshold Θ(t). Due to the correlation between the random threshold and the subsequent reset value, we have
| (16) |
This equals exactly the mean ISI, irrespective of the value of the noisy threshold we have used. Now, calculating the covariance between subsequent intervals, we obtain
| (17) |
Here we have used the fact that the intervals Uj, Vj, and Vj+1 are statistically independent and, furthermore, that the variance of Vj provides one half of the total variance of the ISI Ij for reasons of symmetry between Uj and Vj. Repeating this little calculation for a higher lag, one finds vanishing correlations because the intervals Uj, Vj, Uj+k, and Vj+k are all mutually independent for k>1. As a consequence, we obtain for the SCC of model A
| (18) |
with δk,l being the Kronecker symbol. It is somehow clear that model A is not “as random” as model B, since while simulating the former, we need only half of the random numbers that are needed for simulating model B. It is important to realize that model A is pathologic in one respect. Adding n subsequent ISIs, we obtain the so-called nth-order interval Tn, as defined in Eq. (6). The standard deviation of this random variable (see the following section) does not grow with the index n (number of added intervals) but remains always the same—there is no low-frequency variability in the spike train due to the negative correlations. Equivalently, if we consider the spike count [Eq. (2)], i.e., the number of spikes in a certain interval T, its variance does not grow unbounded as for any of the common stochastic spike generators. We stress that model A is only a cartoon of a neuron exhibiting negative correlations; in reality, spike trains with negative correlations that add up exactly to are not observed.
C. Power spectra of the spontaneous activity
As we will see, the difference in the transmission properties of the simplified models rests strongly upon the difference in their spontaneous activity. For this reason, we first give an extended discussion of the case s(t) ≡ 0, highlighting especially the implications of the negative correlations of model A for the power spectrum of its spike train.
For the analytical calculation of the background spectral densities, we can use the following formula from the theory of stochastic point processes (Ref. [24])
| (19) |
where Fn(f) is the Fourier transform of the probability density of the nth-order interval Tn. For a renewal process, we have Fn(f)=[F1(f)]n, and Eq. (19) reduces to
| (20) |
Using the latter formula, we first calculate the power spectrum of the renewal model B. As mentioned, the first-order interval density, which is just the ISI density, is the same for both models. This density is obtained by convolving the densities for the intervals Uj and Vj, which are both distributed according to the uniform probability density
| (21) |
where H(T,a,b) is one for a<T<b, and zero elsewhere. The convolution then yields a triangular density for the single ISI
| (22) |
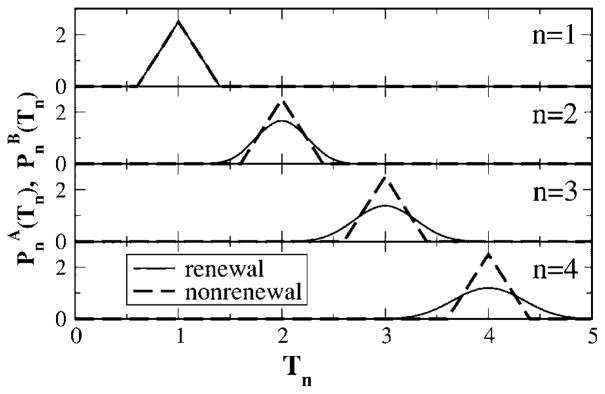
Correspondingly, the general nth-order interval density of model B will be a convolution of 2n uniformly distributed numbers yielding a polynomial of order n. The ISI density and the first-higher nth-order densities are shown in Fig. 3 as dashed lines. It is apparent that the variance of the density grows with increasing index n.
FIG. 3.
The first nth-order interval densities (n=1,2,3,4) for models A and B. The density for the nonrenewal model (dashed lines) is obtained by shifting the ISI density [Eq. (22)] by (n−1)〈I〉, where 〈I〉=1 for the parameters used. The densities of the renewal model (solid lines) is obtained by taking the inverse Fourier transform of [F1(f)]n, with F1(f) given in Eq. (23). Parameters are Θ0=1, μ=1, and D=0.2.
The Fourier transform of the ISI density [Eq. (22)] reads
| (23) |
where β=2πD/μ. For the power spectrum of model B, we thus obtain, using Eq. (20),
| (24) |
In order to calculate the power spectrum for model A, we have first to calculate the nth-order interval density. Since the sum of subsequent subintervals Vj and Uj+1 is constant [see Eq. (16)], the nth-order interval can be written as follows:
| (25) |
This means that for model A, the nth-order interval density is obtained by shifting the single ISI density by (n−1)〈I〉 (see also Fig. 3). In contrast to what can be observed for the renewal model, the variance of the nth-order density does not grow with the index. For sufficiently low noise (D<0.25), firings can be excluded for specific time spans. Given a spike at t=0, we know, for instance, that the nonrenewal model with parameters like in Fig. 3 will not fire at t=0.5, 1.5, 2.5, …. These pauses and the similar coherent spans of increased probability of firing introduce an infinite phase coherence in the firing. In other words, the neuron never “forgets” its initial spike instant.
In order to get the Fourier transform of the nth-order interval density, one has to replace 〈I〉 by n〈I〉 in Eq. (23), yielding
| (26) |
Inserting into Eq. (19) and using the Poisson sum formula [29] leads to
| (27) |
We note that this spectrum is a special case of one obtained much earlier by other authors (see Ref. [24] and references therein).
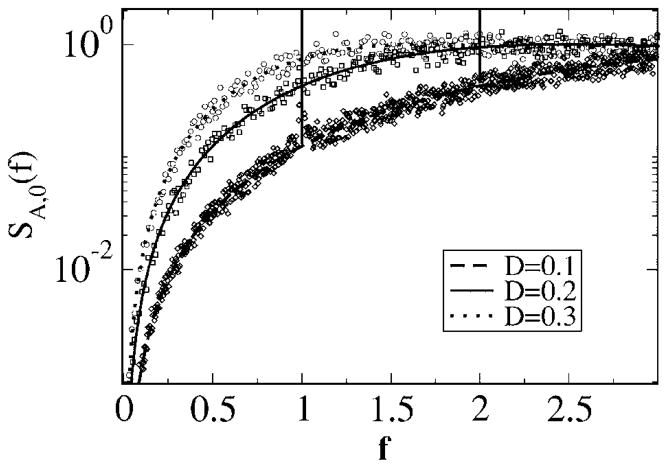
Figures 4 and 5 show the power spectra for different levels of noise. The spectrum of model A [see Eq. (27) and Fig. 4] consists of a continuous function and δ functions at the eigenfrequency r0 of the neuron and its higher harmonics. It can be easily seen from Eq. (27) that the spectrum drops to zero for vanishing frequency. The main effect of raising the noise level is an overall increase of the continuous part and a drop in the weights of the δ functions (except in certain narrow frequency bands).
FIG. 4.
Power spectra of model A for different values of the noise intensity as indicated. The continuous part of Eq. (27) (smooth lines) is compared to numerical simulations (symbols). For the latter, we used a simple Euler procedure with time step Δt = 5 × 10⁻³. The power spectra were obtained by averaging over the Fourier transforms of 20 spike trains of length Tsim = 2621.44 (in arbitrary units). Parameter values for numerical simulations were θ0 = 1, μ= 1, and s(t) ≡ 0.
FIG. 5.
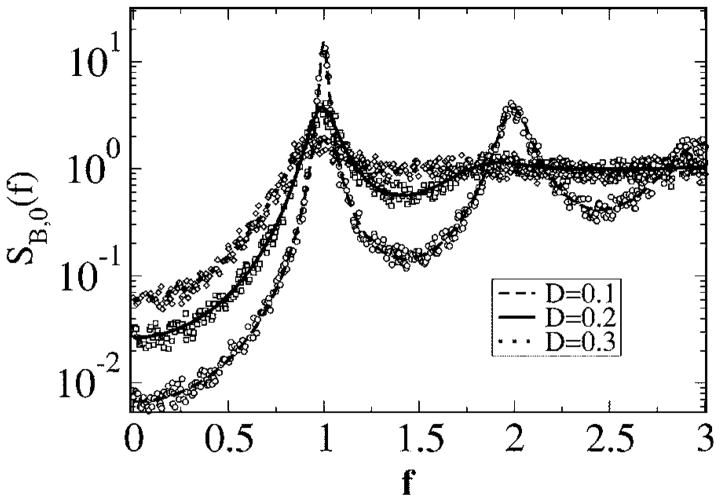
Power spectra of model B for different values of the noise intensity as indicated. The analytical result [Eq. (24)] (smooth lines) is compared to numerical simulations (symbols); simulation procedure and parameters are the same as in Fig. 4.
Model B (see Fig. 5), in contrast, shows no δ peaks in its spectrum and possesses a finite zero-frequency limit. In particular, for small noise the spectrum displays peaks of finite width and height at the eigenfrequency r0 and its higher harmonics. Increasing the noise level diminishes those peaks and makes them broader, raising at the same time the overall level of the spectrum.
The two main differences in the spectra of models A and B, namely, the behavior at low frequencies and the sharpness of the peaks at the eigenfrequency, can be attributed to the negative ISI correlations. Firstly, the spectrum at zero frequency can be expressed by the moments of the ISI and the SCC as follows:
| (28) |
Thus, if the sum of the SCC over all lags is equal to , as is the case for model A, the spectrum must vanish at zero frequency. In contrast to that for vanishing ISI correlations as for model B, the spectrum at zero frequency is finite. Secondly, due to the ISI correlations displayed by model A, the standard deviation of the nth-order interval for model A does not grow with the number of intervals but is the same as for the single ISI density [Eq. (22)]. As discussed earlier, this introduces a strict periodicity in the spike train that is reflected by the δ peaks in the power spectrum.
We note that both the reduction of power at low frequencies as well as the sharpening of the spectral peak at the eigenfrequency have been observed in more realistic nonrenewal models [30]. Since no real cell shows a perfect periodicity (or equivalently an SCC with that would lead to such a periodicity), the spectrum of a real neuron with negative ISI correlations decreases (but not to zero) and shows higher and narrower peaks at its eigenfrequency than a comparable renewal neuron would do. In this sense, model A is only a caricature that exaggerates important spectral properties that are due to negative ISI correlations.
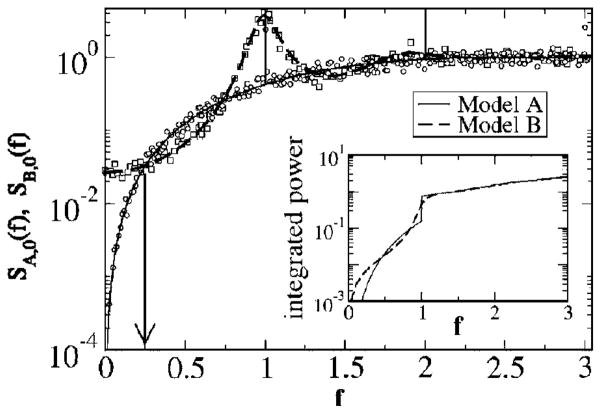
Finally, we compare the spectra of models A and B directly with each other (see Fig. 6). At low frequencies (f < 0.25) and also in the range f ≈ 1 around the eigenfrequency of the neuron, the spectrum of model A shows much less power (except, of course, for the δ peak at f = 1) than the spectrum of model B does. The noise power lacking in this range is, however, exactly compensated by an excess in other frequency ranges and by the power contained in the δ peaks. This is illustrated in the inset of Fig. 6, showing the integrated power as a function of the upper integration boundary. At large f, the integrals for both spectra converge, with the difference between them going to zero. Because of the infinite variance of the spike trains, the integral diverges for growing frequency. However, even if we subtract the finite spectral limit (given by the firing rate r0), we obtain a vanishing difference between the remaining powers of models A and B. This can be understood on simple physical grounds as follows: Subtracting the high-frequency limit from the spectrum, applying the inverse Fourier transform, and using the Wiener-Khinchin theorem [Eq. (10)], we obtain
FIG. 6.
Comparison between power spectra of models A and B for D = 0.2. The arrow indicates the frequency at which both power spectra intersect for the first time. The inset shows the integrated power from zero up to the frequency f as a function of f. The convergence of the two lines demonstrates that the two spectra differ only in their shape but have equal total power.
| (29) |
Here m(τ) is the probability per unit time to observe a spike under the condition that at τ= 0, a spike has occurred. Note that this includes all spikes except for the reference spike. For any spike model that possesses an absolute refractory period, we have m(0) = 0, and thus
| (30) |
Since both models A and B show an absolute refractory period in the spontaneous case (and even in the case of a weak signal) and possess the same spike rate, the integral over the power spectrum is equal for both models. The effect of the ISI correlations on the power spectrum is therefore truly a noise-shaping effect (i.e., a redistribution of spectral power over frequencies), without suppression or amplification of the total noise power. In Fig. 6, we have also indicated the lowest frequency at which the power spectra of both models are equal. This value will be of importance for the mutual information as shown later. Setting the power spectra [Eqs. (24) and (27)] equal yields a comparably simple transcendental equation for the determination of the points of intersection
| (31) |
The smallest numerical solution of this equation gives f* ≈ 0.25, in good agreement with the numerical result (see Fig. 6).
IV. CALCULATION OF THE SPECTRAL STATISTICS OF THE SPIKE TRAIN IN THE PRESENCE OF A WEAK STIMULUS
In this section, we study the influence of the spontaneous activity of models A and B on their respective signal-transmission properties. Although our models are rather simple, the inclusion of arbitrary driving signals s(t) leads to mathematical difficulties because of the nonlinearity imposed by the threshold condition. Here, we choose to study the important case of a weak stationary Gaussian signal with uniform although band-pass-limited spectral power
| (32) |
where fL and fC denote the lower and upper cutoff frequencies of the stimulus, and the angle brackets indicate the average over the stimulus ensemble. The small parameter of the signal is given by the variance
| (33) |
If 〈s2(t)〉s ≪ μ2, we can calculate the spectral coherence function using the linear response theory (LRT) [31], as follows: According to LRT, the time-dependent part of the mean value of the spike train x(t), i.e., the instantaneous firing rate, is given by
| (34) |
which reads in the spectral domain
| (35) |
where χ̂(f) is the susceptibility with respect to perturbations in the base current μ. Note that in the relations here we have not yet performed the average over the stimulus, i.e., we deal so far with a “frozen” noisy input. The fact that we can separately average over the stimulus ensemble and the internal noise (i.e., the threshold noise) leads to the nice property that the cross spectrum (being a second-order statistical quantity) is essentially determined by the mean value of the spike train (which is a first-order quantity)
| (36) |
The power spectrum itself is still truly a second-order quantity that cannot be strictly inferred from the susceptibility. We can obtain, however, an estimate for it by assuming that the system behaves like a linear system with the transfer function given by the susceptibility. In this case, internal noise and transferred stimulus could be separated yielding
| (37) |
where x̂0(f)corresponds to the spontaneous activity in the absence of the stimulus. Obviously, 〈〈x̂0(f)ŝ(f)〉〉s = 0, i.e., the spontaneous activity is uncorrelated with the stimulus. With this approximation, the power spectrum reads
| (38) |
This simple estimate and the expression for the coherence and the mutual information resulting from it via Eqs. (12) and (13) will be henceforth referred to as theory I.
We note that Eq. (38) has been several times successfully used in the literature [13,32,33]. This must be taken with caution, however, for two reasons. First, there is at least one counter example where Eq. (38) does not hold even in the first order of the signal variance. In Ref. [34], McNamara and Wiesenfeld derived an expression for the power spectrum of a two-state system driven by a cosine signal; the achieved formula for the power spectrum is exact up to the first order in the signal variance. This expression coincides with Eq. (38) except for a small overall reduction of the background spectrum not reflected by Eq. (38). Second, in particular for model A, we also expect a qualitative change in the spectrum for an arbitrarily small but finite amplitude of the random stimulus. A small amount of external noise will break the infinite coherence of the spike train introduced by the reset rule. Hence, we expect that the spectral δ peaks become finite—which obviously cannot be reproduced by Eq. (38) or by any other theory that provides additive corrections to the unperturbed power spectrum. Third, considering the total power, i.e., the integrated spectrum, we note that one can argue as we did when comparing the total power of models A and B in the spontaneous case that even in the presence of a weak signal, both neuron models still show a zero probability of firing right after a spike. Furthermore, as shown in the Appendix, the stationary spike rate 〈〈r(t)〉〉s is for a weak stimulus the same as in the spontaneous case, namely, r0. This means that the integral over S(f) − r0 will still be , according to Eq. (30). This, however, is obviously not fulfilled by Eq. (38), since the transmitted input spectrum in Eq. (38) makes a positive contribution to the total integral. The error made in this way is small because it is proportional to 〈s2(t)〉s—nevertheless, a more accurate theory should not have this error. We will use Eq. (38), because this simple approximation gives valuable insights regarding the information gain through negative ISI correlations. We will, however, also present a refined analytical approach to the power spectrum in the second subsection.
From the preceding discussion, it should be apparent that we can obtain approximations for the coherence function and the mutual information if we know the susceptibility of the models A and B. Put differently, we have to know the instantaneous firing rate in the presence of a time-varying signal. The theoretical tools used in the preceding section, however, do not suffice to calculate this function. This can be done if we describe the system by evolution equations for the asymptotic probability density of the voltage variable v as follows. An alternative approach based on a time transformation is presented in the next Sec. IV A.
A. Susceptibility calculated using equations for the probability density and a simple estimate for power spectrum and coherence (theory I)
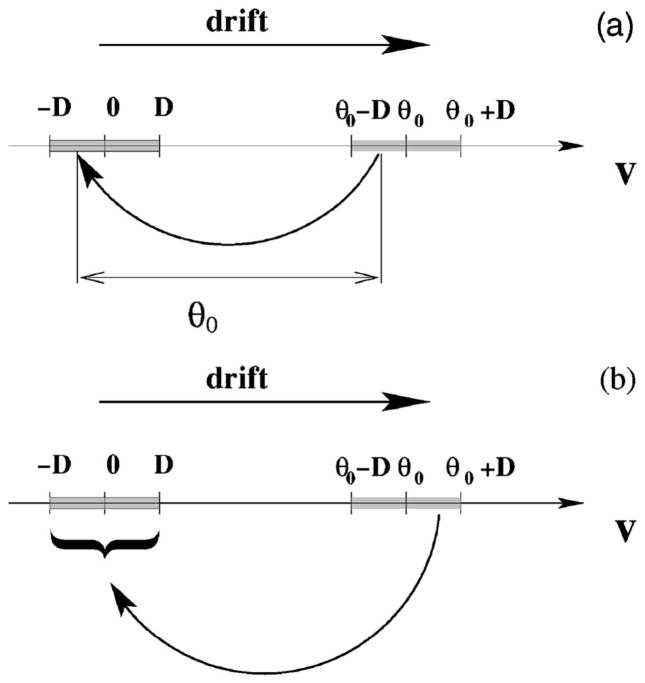
For model A, the probability is governed by the drift term μ + s(t), by the absorption of probability at the random values of the threshold, and by the influx of probability at the reset points [see Fig. 7(a)]. This yields the following equation:
| (39) |
FIG. 7.
Illustration of probability fluxes (arrows) in model A (a) and model B (b). In model A, probability is driven by the drift to the right until t reaches the threshold region (open gray box). Probability that is absorbed within this region is reinjected into the reset region (indicated by the closed gray box on the left). For model A (a), the efflux at a certain value v equals the influx at v − Θ0. For model B (b), in contrast, the probability flowing out at v is equally distributed in the interval [−D, D].
The absorption is determined by a rate β(v, t) still to be determined. Note that the efflux of probability at v corresponds according to the reset rule for model A to an influx at v − Θ0, or—as in the preceding equation—an influx at v is generated by an efflux at v+ Θ0. Obviously, the Eq. (39) conserves the total probability.
For model B, we can find the evolution equation by changing the reset term. Since the reset point is completely random in this case, only the magnitude of the influx will be determined by the total efflux of probability in the region of possible thresholds [see Fig. 7(b)]
| (40) |
Here, we have used the abbreviation HR(v) = H(v, −D, D) with the previously introduced piecewise constant function H(v, a, b); similarly, we will use in the following HT(v) = H(v, Θ0 − D, Θ0 + D).
The absorption rate β(v, t) is the same for both models; it depends on the probability densities of thresholds and on the velocity of trajectories. Obviously, it is finite only in the threshold region and for a total input μ + s(t) being positive. Furthermore, if we look at a certain value of v> Θ0 −D, we exclude realizations for which the threshold is below this value, i.e., we condition the probability density of thresholds. Putting all of this together, we obtain
| (41) |
The second factor is U(x) = x for x >0 and zero elsewhere. (It sets the rate to zero for an input s(t) < −μ, in which case, no threshold crossings can be observed.) The last factor Prob(···|···) gives the density of the random threshold value conditioned by the fact that the threshold has to be larger than the voltage value (otherwise, the voltage could not have attained this value). Expressing the last factor by
| (42) |
we obtain
| (43) |
The firing rate of the neuron is related to the probability density by the following equation:
| (44) |
since the fraction of realizations passing through the ensemble of thresholds corresponds to the firing rate of the single neuron.
We are interested in solutions of the two equations in the case of a weak signal s(t) ≪ μ and with a randomized initial time. The latter is required for model A—due to the infinite phase coherence of spiking in the spontaneous case [s(t) ≡ 0], we cannot obtain a stationary solution if we start, for instance, all the probability at a certain voltage at a fixed point in time.
We first set s(t) ≡ 0 and discuss the stationary solution P0(v). Setting ∂tPA,B to zero and solving the two equations separately in the three regions (v>Θ0 − D; D < v < Θ0 − D; v<D) leads for both models to the same stationary density
| (45) |
The density possesses a trapezoid shape and is zero for v= −D as well as for v= Θ0 + D. Normalization of this density leads to the known relation for the firing rate found above r0 = μ/Θ0.
We also would like to point out that both density-evolution equations can be used to calculate the power spectrum in the case s(t) ≡ 0, which we already obtained by a different method in the preceding section. For this purpose, we choose the initial condition PA,B(v, 0) = HR(v)/(2D), corresponding to the state of an ensemble right after a spike has occurred. The time-dependent firing rate r(t) equals, in this case, the conditional spike rate m(t), and its Fourier transform m̃(f)—found from the solution of the density equation—allows for the determination of the power spectrum by virtue of the Wiener-Khinchin theorem. The results calculated in this way agree for both models with the expressions in Eqs. (24) and (27), which is a further confirmation of the validity of the evolution equations (39) and (40).
Considering the case |s(t)| ≪ μ, we can perform a perturbation calculation [with 〈s2(t)〉s/μ2 being the small parameter] for the probability density P(v, t) and obtain the asymptotic probability density. This is not necessary, since the solution obtained in this way equals the stationary probability density, which becomes quickly apparent, as follows. If s(t) ≪ μ, the function U[μ + s(t)] (being strictly zero for negative argument) can be well approximated by μ + s(t). Then all the terms on the right-hand sides of Eqs. (39) and (40) contain μ + s(t), which can be factored out. The remaining sums are zero for PA,B(v, t) = P0(v), and so are the left-hand sides [the temporal derivatives of PA,B(v, t)]; hence, P0(v) solves the problem. The fact that the probability density does not depend on time does not imply, though, that the firing rate is also time independent. According to Eq. (44), we find for the firing rate
| (46) |
From this, it is clear that the susceptibility is a constant; it is the same for both models A and B
| (47) |
With the susceptibility, we may calculate the cross spectrum using Eq. (36)
| (48) |
and an estimate of the power spectrum according to Eq. (38)
| (49) |
Using the latter approximation for the spike-train power spectrum, the coherence function can be calculated by
| (50) |
In all formulas, the respective quantity for models A and B is obtained by inserting the spectrum of the spontaneous activity according to Eqs. (24) and (27), respectively. Note that in our previous work, we made some writing errors in the respective formulas (see also [35]). As shown in the next section, the susceptibility can be fairly easily obtained from an alternative calculational approach, which also yields a much better approximation for the power spectrum. We nevertheless believe that the equations for the probability density presented here can be useful in situations where we cannot use the other approach. For instance, the generalization to a leaky integrator model with threshold noise should be straightforward—in this case, the susceptibility may show more complicated but also more interesting behavior than for the perfect integrator neurons studied here.
B. Susceptibility and power spectrum calculated using a time transformation (theory II)
Our alternative approach is based on the simple observation that a new time variable,
| (51) |
transforms Eq. (14) into the unperturbed problem (v̇ = μ). In other words, measuring time with a “signal-tuned” clock that runs slower or faster according to Eq. (51) will result in an interspike-interval sequence equal to that of the unperturbed system with the same sequence of random thresholds (and for model B, random reset points) as in the unperturbed case. Since the transformation should be unique (monotonic), we have to demand that dt′/dt = 1 + s(t)/μ > 0, which amounts to the weak-signal assumption 〈s2〉s ≪ μ2 that we have already made in the preceding section. This does not strictly exclude a violation of the transformation’s monotonicity because s(t)is Gaussian; such events may be taken care of by setting the signal for the respective intervals to a value −μ + ε> −μ, which is not expected to change anything drastically as long as these events are very rare.
The starting point for all of the following calculations is the spike count. In accord with the preceding line of reasoning, this function can be expressed by the spike count of the unperturbed system
| (52) |
From this, we see that the effect of the stochastic stimulus is that of a phase noise, shifting the spike times by some random amount, the magnitude of which depends on t. The first insight concerns the instantaneous firing rate averaged only over the internal noise
| (53) |
where, in the last line, we have assumed a randomization of the initial time in the stationary ensemble. The last line reproduces without much effort the result from the density calculation in the preceding section—the firing rate of the neuron (be it model A or B) is directly proportional to the stimulus, and thus the response of both models is spectrally flat. We point out that so far we have not used any characteristics of the model but Eq. (14), i.e., the fact that the neuron is a perfect integrator. Thus, the above formula and those we will derive in the following hold for any perfect integrator (with random or constant threshold and reset points) driven by a weak stimulus.
As derived in the Appendix, the approach leads by further plausible simplifications to the following integral expression for the power spectrum in the presence of a Gaussian signal with power spectrum Sst(f):
| (54) |
The function I(f, f′) is given by
| (55) |
where we used
| (56) |
| (57) |
with ks(t) being the signal’s autocorrelation function. The preceding equation can be further simplified. Before doing so, we want to point out two facts. First, by setting the terms ym(t) and σ2(t) in Eq. (55) to zero (those terms are proportional to the signal variance), the time integral yields a δ function in f − f′. Consequently, the integral expression in Eq. (54) reads S0(f) − r0, which leads exactly to our first rough approximation of the power spectrum [Eq. (49), corresponding to the general ansatz equation (38)]. Second, we may integrate the expression equation (54) and check whether the total power has changed [as is the case for Eqs. (38) and (49)] or not (as it should be). Specifically, we look at the difference between the spectrum and its high-frequency limit. Integrating over f requires us to integrate I(f, f′) over f. This integral yields
| (58) |
Using this while integrating Eq. (54), we obtain
| (59) |
where we have used Eq. (30). Hence, the total integrated power equals that in the spontaneous case, regardless of the presence or absence of a stimulus and regardless of the model under consideration. This is an indication that theory II yields a better approximation to the power spectrum than the simple theory I.
The power spectrum given in Eqs. (54)–(57) is still a fairly complicated expression and hard to tackle numerically; it is, however, possible to simplify the particularly cumbersome integral in Eq. (55). The problem in the latter expression is the term exp[−2π2f′2σ2(t)]; an expansion of this exponential in a series has to be done in different ways, depending on the long-time behavior of σ2(t). The latter is proportional to the stimulus spectrum at zero frequency (see the Appendix); thus, we obtain different expressions for the integral equation (55) and also for the power spectrum, depending on the lower-cutoff frequency of the stimulus. In the case of a finite lower-cutoff frequency, we obtain for the power spectrum
| (60) |
It is remarkable that the correction to the heuristic formula (49) (i.e., the second line of the preceding formula) appears to be a convolution of the input spectrum and the spectrum of the unperturbed system. This structure gives rise to side bands in the spectrum, as we will see later. Regarding model A, we note that the δ spike component in the background spectrum makes the strongest contribution, while that from the continuous part is fairly weak.
The approximation formula becomes more complicated in the case of a zero lower-cutoff frequency. In this case, we obtain
| (61) |
where I(f, f′) is given by
| (62) |
where we have abbreviated a = 2π2Sst(0) and Re{···} denotes the real part of a complex number. For the special case of the band-pass-limited white noise given by Eq. (32) with fL = 0, the integral in the real-part function can be evaluated, yielding
| (63) |
We note that using this expression in Eqs. (61) and (62), we still have to evaluate one integral numerically in Eq. (61). The expression for the power spectrum also contains higher-order terms than just the signal variance [note, for instance, the a3 term in the first line in Eq. (62)]. This is, strictly speaking, not in accord with the derivation of these equations from Eq. (54), in which we already neglected terms of higher than first order in the signal variance. Still, as shown in the following, the nonlinearities kept in Eq. (61) reflect those seen in power spectra obtained by numerical simulations of the stochastic models.
The main qualitative differences to the case with finite lower-cutoff frequency is that we cannot extract the spectrum of the unperturbed system anymore. The reason for this is the qualitative change at the eigenfrequency and its higher harmonics. Due to a stimulus with power at arbitrary low frequencies, the δ peaks of the background spectrum are replaced by finite-width peaks. This becomes very clear if one subdivides S0(f)− r0 in a continuous part and the sum of δ peaks. The convolution integral in f′ will change these δ peaks in peaks of finite width and height corresponding to the loss of infinite coherence length in the spike train in the presence of a random signal. This fact is not hard to understand from a physical point of view—adding a random signal will perturb the internal clock. More remarkable is the fact that the infinite periodicity of the spike train is unchanged for a stimulus having power in a band with finite lower-cutoff frequency.
V. SPECTRAL MEASURES IN THE PRESENCE OF A WEAK STIMULUS—COMPARISON OF THEORY AND SIMULATION RESULTS
The simulation results shown in this section are obtained as follows: the dynamics equation (14) is numerically integrated with a simple Euler procedure, taking into account the respective reset rules of the models. Thresholds and reset points (the latter only for model B) are generated with a pseudo-random-number generator. For the generation of band-pass-limited white noise stimuli, we draw random amplitudes and phases with Gaussian and uniform density, respectively, using random-number generators that obey these statistics. This is done independently for Nbin frequency bins (where Nbin is determined by the band width and total length of the desired trajectory), and the resulting “random spectrum” is fast Fourier transformed into the time domain (see Ref. [36] regarding a similar method to generate Ornstein-Uhlenbeck noise). At the spiking instants of the respective model, the spike train is approximated by 1/(Δt); otherwise, the spike train is zero. Cross and power spectra are obtained from the fast Fourier transforms of the spike train and the stimulus. We repeat this procedure Nreal times in order to obtain reliable estimates of cross and power spectra. We note that our procedure differs from the one used in Ref. [13] with respect to the stimulus generation—in Ref. [13], the stimulus has been generated by a fourth-order Butterworth filter [37]. We would also like to point out that depending on the quantity to be determined, extensive simulations with rather small time step (power spectrum), large simulation time (coherence at low frequencies), or many realizations (cross spectrum around the eigenfrequency of the neuron) are required; we will discuss these technical problems briefly later. In spite of the apparent simplicity of the models, it may thus take considerable computation time to achieve a sufficient convergence for the simulation results, i.e., such that the resulting curves do not change appreciably when one of the critical parameters is increased (Nreal, Tsim) or decreased (time step Δt).
A. Power spectra in the presence of a weak stimulus
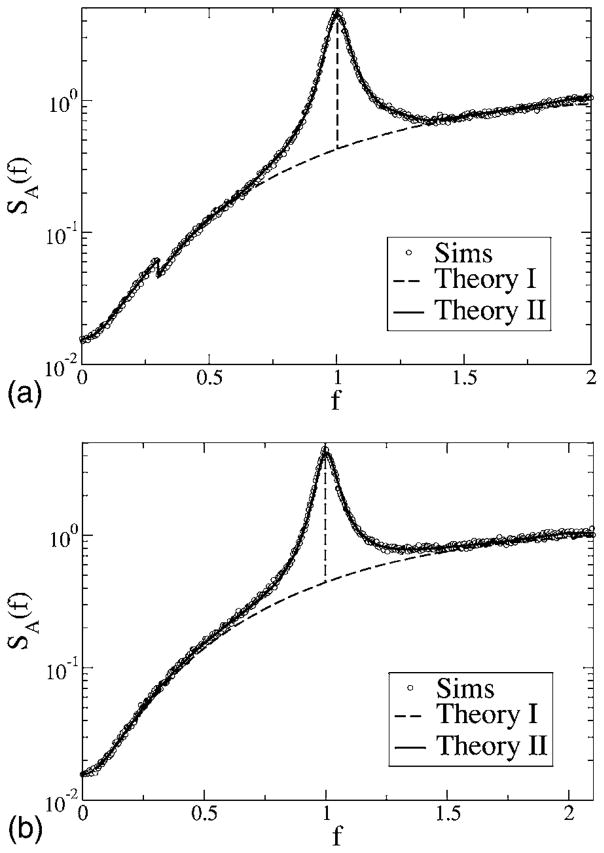
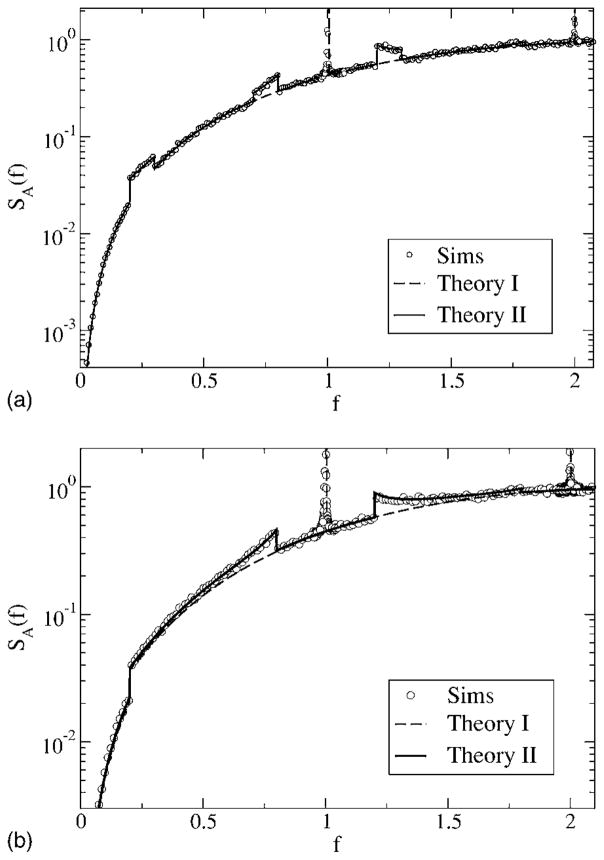
We start with a discussion of the power spectra for the various cases. The spectral height of the stimulus is kept fixed to α= 0.015 625, the noise intensity is D = 0.2, and we consider the spectra for different lower- and upper-cutoff frequencies. First, we consider model A with a zero lower-cutoff frequency at a low upper-cutoff frequency fC = 0.3 (see Fig. 8, top). The signal power that increases the spectrum up to f = fC becomes clearly apparent by the jump of the spectrum at fC. In this low-frequency region, the simulations and both the simple theory [Eq. (49)] and the more accurate formula agree very well. Outside the range of stimulus frequencies, the simple estimate (49) assumes no effect of the stimulus; thus, theory I gives a monotonically increasing function on which a δ spike is superposed (indicated by the vertical dashed line), exactly as in the spontaneous case (see Fig. 4). In contrast to this prediction, we note deviations of the simple theory from the simulation results around the eigenfrequency (f = 1) of the model—here, the simulations show a peak of finite height and considerable width. Put differently, the stimulus has a considerable effect outside its frequency range. A random stimulus with power at arbitrary low frequencies breaks the infinite phase coherence introduced by the negative correlations. As a consequence, the δ peak indicating a perfect internal clock in the spontaneous spiking of model A becomes a finite-width peak—indicating a finite coherence length determined by the strength of the stimulus. The finite peak is exactly reproduced by theory II [Eq. (61) together with Eqs. (62) and (63)]. We note that for the chosen parameters (fC, D, and α), the main contribution for the finite-width peak stems from the first two δ function terms in Eq. (61) [hidden in S0(f′)], which do not require a numerical integration (plotting only these in Fig. 8 will yield the same curve shown by the solid line).
FIG. 8.
Power spectra for model A with fL = 0, fC = 0.3 (top), and fC = 2.1 (bottom). Other parameters are α= 0.015625, D = 0.2. Simulation results are shown as symbols, the simple theoretical estimate (49) as a dashed line, and the more accurate theory [Eqs. (61), (62), and (63)] as a solid line.
Turning to higher-cutoff frequency fC = 2.1 (Fig. 8, bottom), the agreement at low frequencies between simulations and both theories is still very good, while around the eigenfrequency of the neuron (f ≈ 1), we observe again the peak of finite width and height in contrast with what is predicted by Eq. (49). Also, for the higher-cutoff frequency, the more elaborated theoretical result (61) reproduces the simulation result in every respect. This is nontrivial because with increasing cutoff frequency, the signal variance—which is the small parameter of both theoretical approaches—increases.
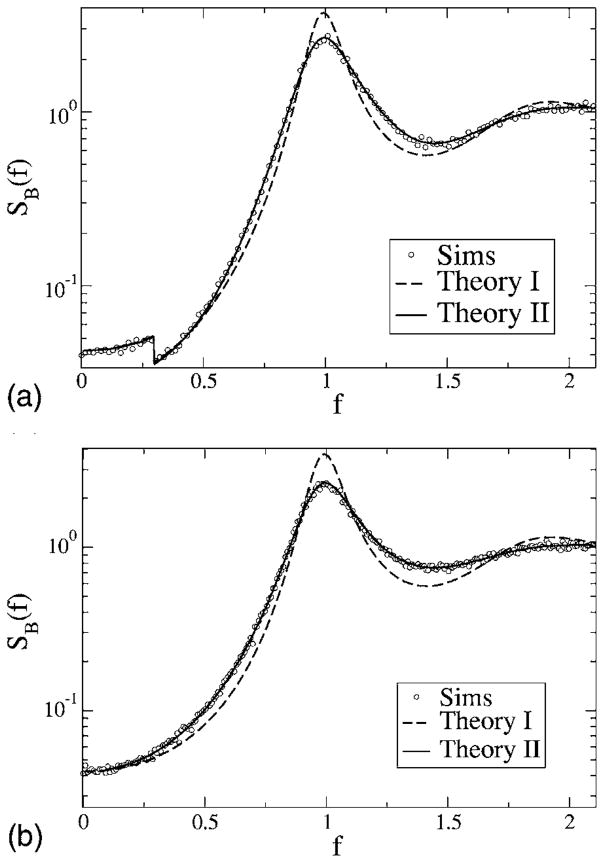
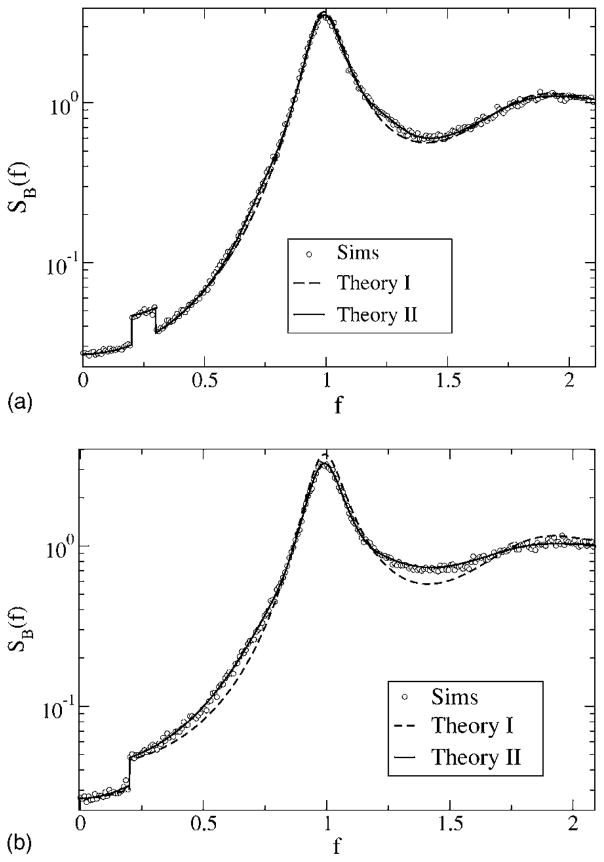
For model B, the power spectrum in the spontaneous case already has a finite-width peak. In the presence of a stimulus with zero lower cutoff and comparably low higher cutoff frequencies (see Fig. 9, top), this peak becomes slightly wider, as can be expected in the presence of an additional noise. Again, this effect cannot be reproduced by the simple estimate (49), since it does not reflect any effect of the stimulus outside of its own frequency range. Once more, theory II excellently describes the widening of the peaks around the eigenfrequency and its higher harmonics. We point out that again, as for model A, the agreement of simulations and both theories is very good at low frequencies (f <0.25). This is also the case for a higher-cutoff frequency fC = 2.1 (see Fig. 9, bottom). Since for a larger value of fC, the variance of the input gets stronger, the width of the peak increases slightly compared to the case fC = 0.3. (Note that the deviation of the simulation results from the dashed line is somewhat stronger in the lower panel than in the top panel in Fig. 9.)
FIG. 9.
Power spectra for model B with fL = 0, fC = 0.3 (top), and fC = 2.1 (bottom). Other parameters are α= 0.015625, D = 0.2. Simulation results are shown as symbols, the simple theoretical estimate (49) as a dashed line, and the more accurate theory [Eq. (61) together with Eqs. (62) and (63)] as the solid line.
Turning to the case of a finite low-cutoff frequency fL = 0.2 and again to model A, we find an important qualitative change with respect to the peak at the eigenfrequency. Where a stimulus with arbitrary low-cutoff frequency leads to a complete nonlinear transformation of the δ peak of the spontaneous spectrum, the band-pass stimulus does not. The δ peaks remain [although their weights are reduced according to Eq. (60)]; in addition to those peaks, side bands appear starting at a distance of −fL and fL from the eigenfrequency of the model. The side bands are well reproduced by Eq. (60). Apart from these side bands, both theoretical approaches agree fairly well with each other and with the simulation result. Note, however, that the stimulus variance is very small because of the small bandwidth fC − fL = 0.1 in Fig. 10 (top) and therefore all correction terms to the power spectrum except for that resulting from the nonlinear interaction with the δ spikes in the background spectrum are expected to be rather small.
FIG. 10.
Power spectra for model A with finite lower-cutoff frequency fL = 0.2 for fC = 0.3 (top) and fC = 2.1 (bottom). Other parameters are α= 0.015625, D = 0.2. Simulation results are shown as symbols, the simple theoretical estimate (49) as a dashed line, and the more accurate theory [Eq. (61) together with Eqs. (62) and (63)] as the solid line.
For model B (Fig. 11), we find again a very good agreement between the more involved theory (60), while the simple theory (49) shows a slightly narrower peak at the eigenfrequency of the neuron. The widening of the peak is stronger for higher-cutoff frequency fC = 2.1 (Fig. 11, bottom) than for lower-cutoff frequency fC = 0.3 (Fig. 11, top), but in both cases, not as strong as for zero low-cutoff frequency (see Fig. 9).
FIG. 11.
Power spectra for model B with finite low-cutoff frequency fL = 0.2 for fC = 0.3 (top) and fC = 2.1 (bottom). Other parameters are α= 0.015625, D = 0.2. Simulation results are shown as symbols, the simple theoretical estimate (49) as a dashed line, and the more accurate theory [Eqs. (61), (62), and (63)] as the solid line.
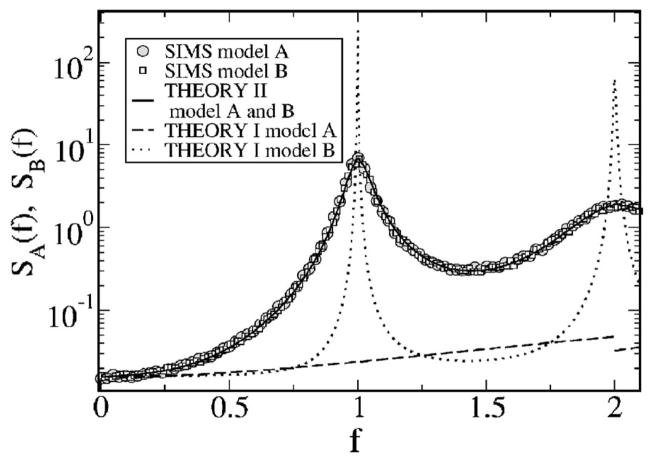
So far, we have fixed the noise intensity to a moderate value (D = 0.2). How do the power spectra change if we decrease the noise? It is plausible that in the limit of a vanishing threshold noise, the external stimulus will dominate the spectral statistics, while the variability of the threshold and the kind of reset rule will not matter anymore. Indeed, the spectra of models A and B become very similar for a small value of noise (D = 0.025), as illustrated in Fig. 12. Remarkably, theory II yields very similar curves that agree well with each other (differences are smaller than line thickness in Fig. 12) and with the numerical simulations of either model. In contrast, theory I fails completely to reproduce the numerical simulations at small noise. The reason for this is that at small noise, the widening of the peaks of the spontaneous spectrum dominates the shape of the spectra. As pointed out earlier, this change in the power spectrum cannot be described by means of the simple additive ansatz (49).
FIG. 12.
Power spectra for fL = 0, fC = 2, D = 0.025 for models A (gray circles) and B (white squares). Theory II yields for these parameters the same curve for both models (solid line). Spectra according to theory I are still very different for models A (solid line) and B (dotted line) but fail entirely to reproduce the simulation spectra.
In summary, we can state that the more sophisticated theory II describes accurately the power spectra of both models under the influence of a weak stimulus for both low and high threshold noise. Deviations from the simple theory are mainly observed at low threshold noise around the eigenfrequency of neurons; they are stronger for the power spectra of model A than for those of model B. Regarding effects of the stimulus outside its frequency range, we have noticed nonlinear interactions of the eigenfrequency of the neuron with the stimulus. For model A, these interactions are qualitatively different in the case of zero and finite low-cutoff frequency, respectively.
B. Cross spectra
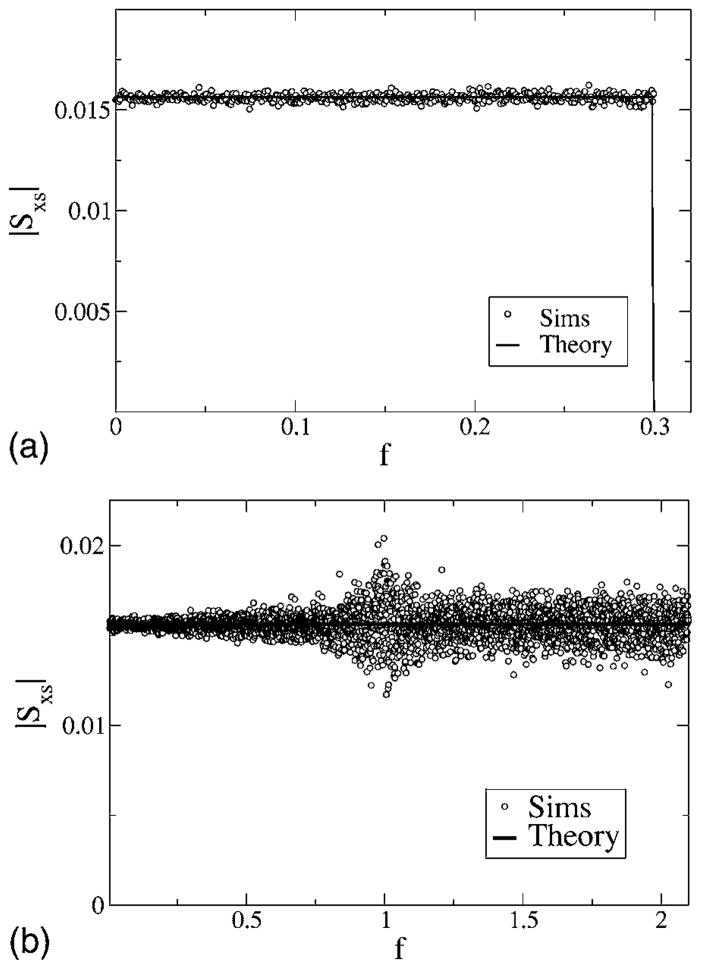
We turn now to the cross spectra. The absolute value of the cross spectrum of model A is shown in Fig. 13 for two values of the cutoff frequency; for both cutoffs, we obtain box-shaped functions proportional to the stimulus spectrum, as predicted by the theory (48). Similar curves are obtained for model B in accordance with our theory that states that the cross spectrum is not influenced by the way we reset the voltage after firing.
FIG. 13.
Absolute value of cross spectra for model A with zero low-cutoff frequency fL = 0 for fC = 0.3 (top) and fC = 2.1 (bottom). Other parameters are α= 0.015625, D = 0.2. Simulation results are shown as symbols, and theory (48) as a solid line.
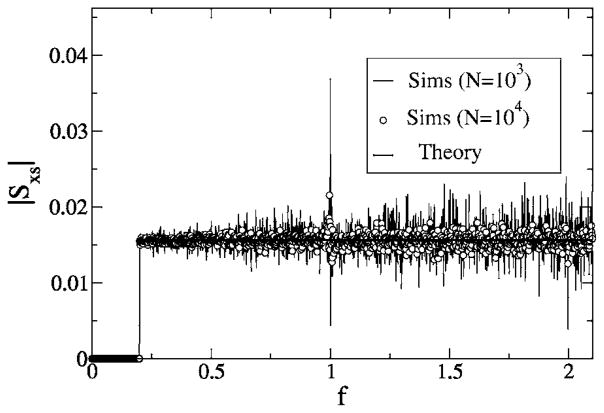
For a cutoff frequency above the eigenfrequency of the system [as, e.g., in Fig. 13 (bottom), where fC = 2.1 >1], we have noticed that the numerical variance of the cross spectrum increases for frequencies around f = 1. This effect becomes even stronger if we consider a stimulus with finite lower-cutoff frequency (see Fig. 14) acting on model A. Here, a strong peak is observed at the eigenfrequency f = 1 if the number of realizations we use for the average is not large enough. As shown in Fig. 14, increasing the number of realizations decreases the peak and makes the cross spectrum flat again, as we expect from the theory. Since the peak found for Nreal = 103 increases strongly for increasing simulation time, we suppose that the variance of the cross spectrum has a δ peak at the eigenfrequency. This higher-order spectral statistics is beyond the framework of our study.
FIG. 14.
Absolute value of cross spectra for model A with finite low-cutoff frequency fL = 0.2 for fC = 2.1. Other parameters are α = 0.015625, D = 0.2. Simulation results are shown for Nreal = 103 stochastic realizations of spike train and stimulus, and for Nreal = 104 stochastic realizations; theory is shown as a black solid line. Note that the peak occurring for Nreal = 103 is considerably diminished if the number of realizations is increased.
C. Coherence functions
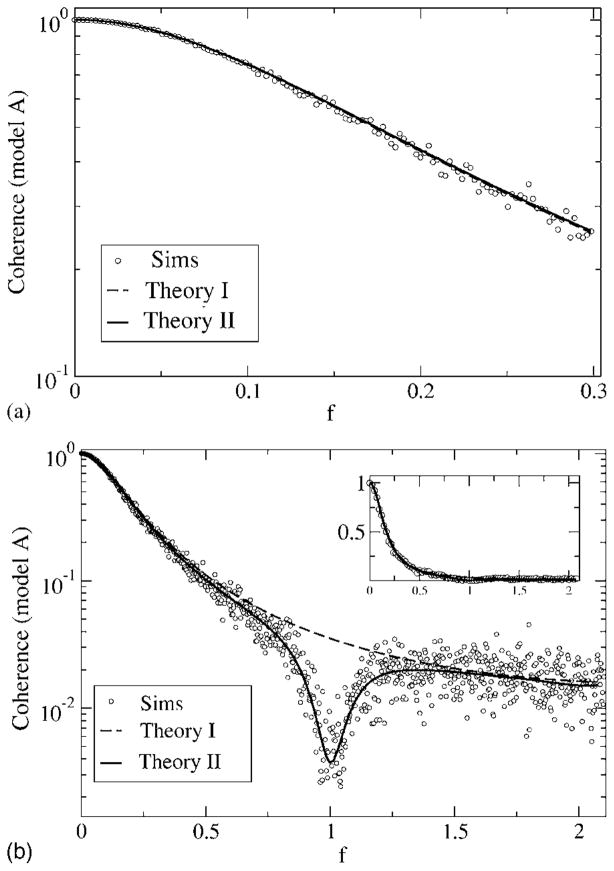
Since the cross spectrum is flat and does not differ for the two models, the coherence is entirely determined by the spike-train power spectra considered earlier. We now show in Fig. 15 the coherence for the case of zero low-cutoff frequency and for a small and large value of the upper-cutoff frequency.
FIG. 15.
Coherence function for model A, with fL = 0 and fC = 0.3 (top) and fC = 2.1 (bottom). Other parameters are α = 0.015625, D = 0.2. Simulation results are for Nreal = 103 stochastic realizations of spike train and stimulus, with a time step of Δt = 5 × 10⁻³; 2 ×10²¹ time steps were used. The coherences according to theory I and II are shown as a dashed and a solid line, respectively. The two theories do not differ much for fC = 0.3 but yield large differences for a high-cutoff frequency fC = 2.1, in particular, in the frequency band around the eigenfrequency of the neuron f ≈ 1. These differences do not matter too much when looking at the coherence on a linear scale (inset, bottom).
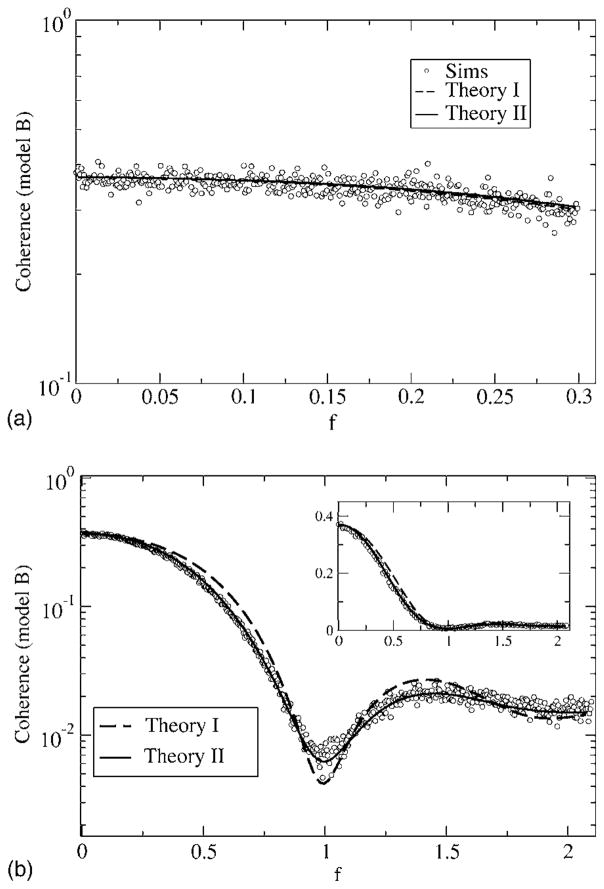
For model A at low fC, the two theories both predict similar curves, which are confirmed by the simulation results. The coherence is close to one around f = 0, which implies vanishing noise power at low frequency. This is clearly due to the negative correlations in the spontaneous activity of the neuron—all variability at low frequencies stems from the stimulus, and hence the transmission of the input signal in this frequency range is very good. Going to larger values of the cutoff frequency reveals a discrepancy between the simple theory I (shown by the dashed line) and the simulations, especially for frequencies around f = 1 (i.e., the eigen-frequency of the neuron). Since the simple theory does not describe the transformation of the spectral δ peak into a finite-width peak as discussed earlier, it has to fail in this frequency range. Theory II, however, correctly reproduces the lowering of the coherence due to the widening of the δ peak. We still note that the agreement between both theories and the simulation result is still good at low stimulus frequencies. Generally, the simple theory overestimates the coherence. For model B (see Fig. 16), the coherence is much lower than for model A at low frequencies. Again, for fC = 0.3, both theories yield roughly the same curves, which are remarkably flat as a function of the frequency. As for model A, the simple theory fails in describing the coherence around f ≈ 1 for a broadband stimulus with fC = 2.1. There, as we saw in the discussion of the power spectra, the spectral peak around the eigenfrequency becomes wider under the influence of the random stimulus. Compared to the prediction of theory I (dashed line in Fig. 16), the true coherence (i.e., according to the simulations as well as to theory II) is therefore larger around the eigenfrequency (0.9< f <1.1) and smaller for frequencies outside this range. Thus, in contrast to what we found for model A, the simple theory overestimates or underestimates the coherence, depending on the frequency considered.
FIG. 16.
Coherence function for model B, with fL = 0 and fC = 0.3 (top) and fC = 2.1 (bottom). Other parameters are α = 0.015625, D = 0.2. Simulation results are for Nreal = 103 stochastic realizations of the spike train and stimulus, with a time step of Δt = 5 ×10⁻³; 2 ×10²¹ time steps were used. The coherences according to theory I and II are shown as a dashed and a solid line, respectively. The two theories do not differ much for fC = 0.3 but yield large differences for a high-cutoff frequency fC = 2.1, in particular, in the frequency band around the eigenfrequency of the neuron f ≈ 1. Again the difference in coherence between the two theories is not that large if looked at on a linear scale (inset, bottom).
VI. INFORMATION TRANSFER THROUGH RENEWAL AND NONRENEWAL MODELS
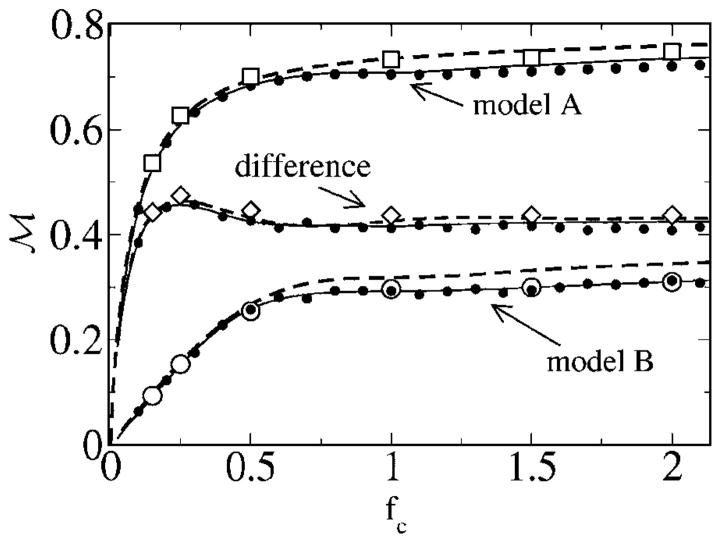
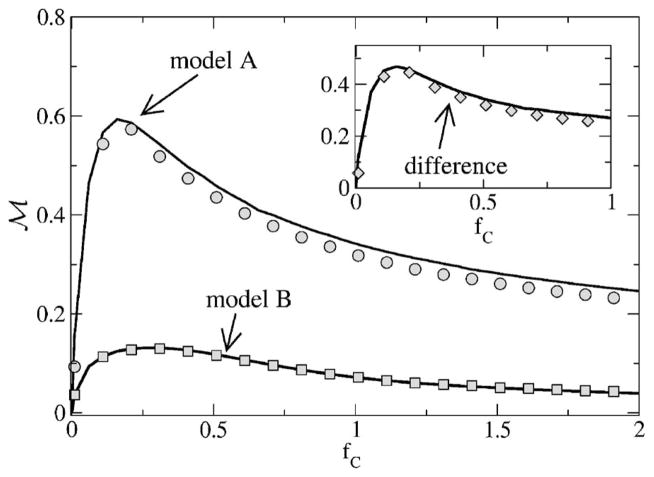
First, we consider the mutual information rate for fL = 0, obtained by integrating numerically the coherence according to Eq. (13). In Fig. 17, we vary the upper-cutoff frequency and also look at the difference between the mutual information for models A and B. This corresponds to the case discussed in Ref. [13]. The lower bound for the mutual information grows for both models with increasing cutoff frequency. Model A possesses a much higher MI rate than model B. The difference between the MI of the models goes through a maximum. According to the simple theory, this maximum occurs if the cutoff frequency equals the frequency at which the spontaneous spectra intersect for the first time, since
| (64) |
which is apparently zero if the coherence functions are equal. According to theory I, the coherence only depends on the power spectrum of the unperturbed system [see Eq. (50)]; hence, the coherence functions are equal, if the power spectra are equal. Consequently, if the cutoff frequency equals the frequency at which the spontaneous spectra are equal we can expect an extremum. In our numerical example, this is at fC ≈ 0.25, in good agreement with the smallest positive solution of Eq. (31). We note that the maximum is also present in theory II and occurs close to the one found in the simulations and in theory I.
FIG. 17.
Mutual information rate as a function of the cutoff frequency, with fL = 0. Other parameters are α= 0.015 625, D = 0.2. Simulation results (small black symbols) are for Nreal = 103 stochastic realizations of the spike train and stimulus, with a time step of Δt = 2 ×10⁻². 2 ×10²¹ time steps were used for model A (upper traces), and 2 ×10¹⁸ for model B (lower traces). We also show the simulation results from Ref. [13] (squares, diamonds, circles) that were obtained using a different numerical scheme (see text). Also shown are the theories I (dashed lines) and II (solid lines) as well as the difference ℳA – ℳB between the mutual information rates of model A and B.
For both models, the agreement between the full theory (theory II, shown by the solid line in Fig. 17) and the simulation results is rather good. Even the differences to the simpler theory I that was solely used in Ref. [13] are not severe—the simple theory overestimates the mutual information rate, in particular, at high-cutoff frequency fC. This can be expected, because with increasing cutoff frequency, the intensity of the stimulus grows, and we obtain stronger deviations between simulation and theory. This is true even for theory II; at high fC, theory II also overestimates slightly the true value of the mutual information rate.
We want to point out a slight discrepancy between the two different sets of simulation results shown in Fig. 17. The set of large white symbols corresponds to the old results shown in Ref. [13]; we recall that they were obtained by using a white noise generated by a so-called Butterworth filter. Additionally, for the Fourier transform, a windowing procedure was used. In the other set of simulation results (small black symbols), we used a white noise generated in the Fourier domain; no windowing was used, but we extended the simulation time until a convergence of the data was obtained. There are essentially no differences between both sets of simulation results for model B. For model A, the new simulation results are slightly smaller than the previous ones, in particular, at higher frequencies. The new results seem to be more reliable; note, however, that they required a much longer simulation time.
In the case just studied, we kept the intensity (i.e., the height of the stimulus spectrum) constant while varying the cutoff frequency. However, in an experimental situation and also in theoretical investigations, researchers often keep the signal variance constant while increasing the cutoff frequency. This was, for instance, the case in Ref. [10], where a maximum in the gain of mutual information rate vs cutoff frequency was found. In Fig. 18, we show the mutual information rate for both models, together with the difference between the curves. For both models the mutual information rate first increases, goes through a maximum, and then decreases again. This is in marked contrast to the preceding case (Fig. 17), where we fixed the intensity of the stimulus. Note that for fixed-stimulus variance, the integral over the stimulus power spectrum must yield the same value for all cutoff frequencies. This requires that, as we increase the cutoff frequency, power at low frequency is transferred into higher-frequency bands. For fC → ∞, we end up with a stimulus that has infinitesimal height in an infinite-frequency band. Such a stimulus has no effect on a dynamical system at all, and thus the mutual information rate must drop to zero if the cutoff frequency tends to infinity. Note that in Ref. [10], only comparably small cutoff frequencies were considered such that the range of decreasing mutual information rate had not been reached yet. Numerical simulations of our models revealed that for stronger stimuli, the maxima in the MI rates are attained at larger frequencies (not shown). This may explain why a drop in MI rates was not seen in the numerical study of Ref. [10], since the stimulus amplitudes used in Ref. [10] were quite strong. Also, Ref. [10] used the direct method for the estimation of the mutual information, and the transfer function was similar to that of a high-pass filter.
FIG. 18.
Mutual information rate as a function of the cutoff frequency, with fL = 0 and the stimulus variance fixed (〈s2〉s = 6.25 × 10⁻³). Noise intensity was D = 0.2. Simulation results (symbols) are for Nreal = 103 stochastic realizations of the spike train and stimulus, with a time step of Δt = 5 ×10⁻³. 2 ×10²³ time steps were used for model A (upper traces), and 2 ×10¹⁸ for model B (lower traces). The solid line is the theory—because of the small variance we chose, both theory I and II yield curves that agree in line thickness. The discrepancy between the simulation data and the theory can be ascribed to the finite length of the simulation time. The inset shows the difference ℳA – ℳB between the mutual information rates of models A and B.
Not only the MI rates, but also the difference between the rates of the two models goes through a maximum as a function of cutoff frequency (see inset in Fig. 18). This is in qualitative agreement with the findings from Ref. [10]. The maximum is attained at a smaller cutoff frequency (fC,max ≈ 0.16) than for fixed-signal intensity (fC,max ≈ 0.25) but at a smaller frequency than the maxima of the rates.
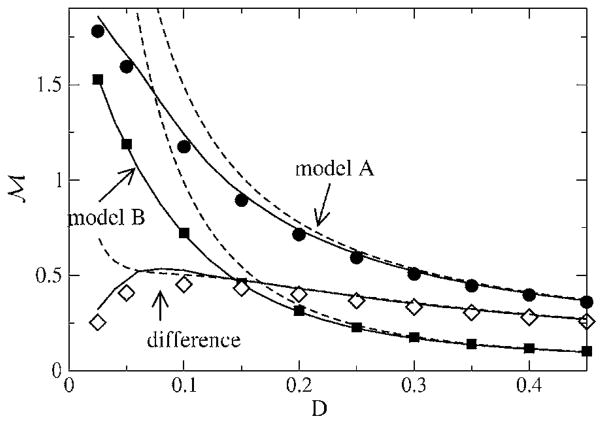
While introducing the model, we found that μ and Θ0 are redundant parameters that can both be set equal to unity. So the only remaining parameter characterizing the neuron itself (and not the stimulus) is the threshold noise parameter D. The dependence of the mutual information rates on this threshold noise is shown in Fig. 19. For both models, the mutual information rate is a monotonically decreasing function of the threshold noise; there is no stochastic resonance (SR) effect, i.e., the information transfer is not maximal at a finite but at vanishing internal noise. This is not surprising—since both models are perfect integrators, we operate in a suprathreshold firing regime where SR is usually absent. (For neuron models like the FitzHugh-Nagumo model, this can be different for certain stimuli; see Ref. [38].)
FIG. 19.
Mutual information rate as a function of the threshold-noise parameter D. The stimulus had cutoff frequencies fL = 0 and fC = 2.0. Theory II is shown as solid lines, while theory I is shown as dashed lines. The simulation results for models A and B are indicated by filled circles and squares, respectively, while the difference ℳA – ℳB between the values for models A and B is shown as open diamonds.
Remarkably, however, the difference between the mutual information rates, i.e., the gain in mutual information, goes through a maximum as a function of the noise strength. This is well described by theory II, while theory I fails to reproduce the mutual information rates and, thus, also their difference at low noise. What is the reason for the maximum in gain at a finite noise level? In the limit of strong noise (D → 0.5), the mutual information rate for both models is strongly reduced, and thus, at some point, their difference will also decrease. In the opposite limit of very weak noise, both models become more and more similar—the stimulus, i.e., the input noise dominates, and the internal noise and the kind of reset rule we are using becomes less important. This was already discussed for the power spectra (see Fig. 12 and the related discussion).
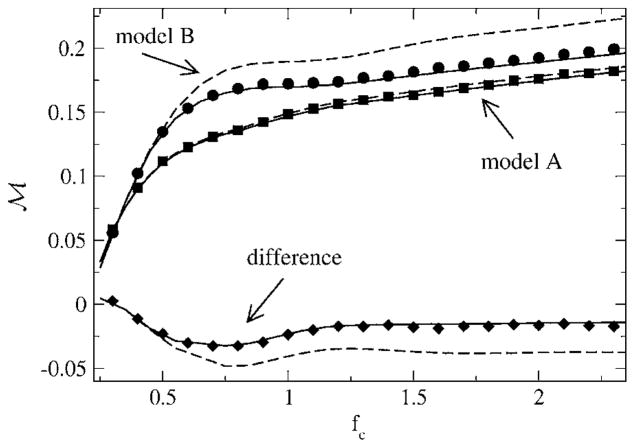
Finally, we turn to the mutual information rate in the case of a finite lower-cutoff frequency. If we exclude a considerable range of lower frequencies, the mutual information rate can be larger for the renewal model B. This is shown in Fig. 20—the difference in mutual information rates starts at a small positive value at low fC but becomes quickly negative as soon as the higher-cutoff frequency grows beyond fcrit ≈ 0.25. The difference passes through a minimum, which is attained around fC ≈ 0.75. This is again determined mainly by an intersection point of the power spectra of the unperturbed models in accordance with the discussion around Eq. (31). This time, however, it is the second intersection point that yields the extremal point in the difference; this point is at f ≈ 0.75, as can be seen in Fig. 6.
FIG. 20.
Mutual information rate as a function of the cutoff frequency, with fL = 0.2. Other parameters are α= 0.015625, D = 0.2. Simulation results (small black symbols) are for Nreal = 103 stochastic realizations of the spike train and stimulus, with a time step of Δt = 2 ×10⁻². 2 ×10²¹ time steps were used for model A (upper traces) and 2 ×10¹⁸ for model B (lower traces). We also show our old simulation results from Ref. [13], which were obtained using a different numerical scheme (see text). Also shown are the theories I (dashed lines) and II (solid lines), as well as the difference ℳA – ℳB between the mutual information rates of model A and B.
The lower-cutoff frequency in this last example (i.e, Fig. 20) is quite large. A value fL = 0.2 implies that time scales much longer than five ISIs are excluded from the stimulus—an assumption that might apply to special cases but is generally not justified; typical realistic stimuli will also contain slower time scales. For a lower-cutoff frequency much smaller than the value we used earlier, the gain by the negative correlations will still be positive and strong comparable to the case fL = 0. We have studied, for instance, fL = 0.02, which yielded a still considerable positive gain in mutual information rate due to the negative ISI correlations. We are thus confident that an information gain will be found for most neurons that show strong negative ISI correlations, except for the case in which these neurons are stimulated by a strongly high-pass-filtered signal.
VII. SUMMARY AND CONCLUSIONS
We have derived a number of useful analytical results for integrate-and-fire neurons with threshold noise. Although the first approach we presented (which was also used in Ref. [13]) has limited accuracy, it has several advantages. First, the resulting formulas are much simpler, and hence, the numerical evaluation of spectral measures is readily accessible. Second, the simple physical picture of the noise-shaping effect we were interested in becomes already apparent if the simple approach of theory I is used. Third, the approach developed for calculating the cross spectrum between stimulus and spike train may also be used to treat more complicated but also more realistic models, as for instance, a leaky integrate-and-fire neuron with threshold noise.
The second approach (theory II), which was based on a time transformation, enabled us to correctly describe spectral “interactions” between the stimulus spectrum and the spike-train power spectrum of the spontaneous system. This included the appearance of side bands in the power spectrum and also the widening of sharp peaks at the eigenfrequency of the neuron. Such effects have great importance in neural systems [5] but are usually only numerically studied. Our approach to the perfect integrate-and-fire neuron may allow for an analytical description of such effects.
Turning back to our motivating problem from the Introduction, we have seen how negative correlations shape the background spectrum and thus lead to an enhanced neural information transfer for stimuli with power at low frequencies. The relative gain achieved by this mechanism was shown here to depend nonmonotonically on the stimulus cutoff frequency and on the noise intensity, and is thus maximal at finite cutoff frequency as well as at a finite noise intensity. It was also shown that a renewal model may perform better than the model with negative ISI correlations if the low-frequency part of the stimulus spectrum is missing. In conclusion, negative ISI correlations will improve signal transfer through noisy neurons for signals that contain sufficient power at low frequencies. Both of these conditions are fulfilled for many sensory cells. Whether the effect of negative ISI correlations also plays a role in the communication of higher-order (e.g., cortical) cells or whether it influences network behavior remain exciting open issues that should be explored.
APPENDIX: CALCULATION OF THE SPIKE-TRAIN POWER SPECTRUM IN THE PRESENCE OF A SIGNAL BASED ON THE REFINED APPROACH
Here, we give the details of how to calculate the spike-train power spectrum in the presence of a signal using the refined approach based on the time transformation equation (51).
First, we must determine whether the signal changes the stationary firing rates of the neuron models, i.e., the rate averaged over the stimulus ensemble. This is not the case, as revealed by taking the average of Eq. (46) and (53), respectively
| (A1) |
Hence, the firing rates of both models do not change due to the presence of a weak signal.
In order to calculate the power spectrum, we make use of the Wiener-Khinchin theorem in the following form:
| (A2) |
The last term takes into account the δ spike in the correlation function (the spike train has an infinite variance). In the first term, m(t) is the conditional firing rate, i.e., the probability that a spike occurs at time t >0, given that there was a spike at t = 0 (see also [39]). The function m(t) can be expressed by the temporal derivative of the mean conditional spike count N(t | 0) (the condition is again that a spike occurred at t = 0). Using the latter and its relation to the conditional spike count of the neuron in absence of a signal given in Eq. (52) leads to
| (A3) |
Here, the average runs over both the internal noise (i.e., different realizations of threshold and possibly also reset sequences) and the stimulus. We have abbreviated the integrated signal as follows:
| (A4) |
In order to calculate the needed average, we use the conditional spike function of the unperturbed system m0(t) and its relation to the background power spectrum S0(f) [see Eq. (29)]
| (A5) |
Here, the index sp indicates that the average has to be taken with respect to realizations of the stimulus having caused a spike at t = 0. This latter condition complicates further simplifications and forces us to use a sensible approximation for the stimulus statistics conditioned by the spike at t = 0. We assume that the multivariate probability density Pn+1,sp of the stimulus for ti >0(i = 1, …, n) is conditioned on the spike at t = 0 only through the stationary probability density of the stimulus at t = 0. We thus make the following ansatz:
| (A6) |
where Pn|1 is the conditional probability of the stimulus and PF(s0) is the probability density of the stimulus upon spiking. The relation equation (A6) is certainly true for a Markov process for which the statistics at any future instant in time depend only on the present time but not on the past. We were not able to show whether Eq. (A6) is also true in general. Our numerical results for a band-pass-limited white noise (that is, certainly not a Markov process) indicate, however, that Eq. (A6) is at least a good approximation.
For a weak stimulus, the density PF(s0) can be approximated as follows (Ref. [12]):
| (A7) |
The probability density equation (A6) is used in the following way in order to calculate 〈e−2πiy(t)f′〉SP. We expand the exponential function into a series
| (A8) |
and calculate the moments as follows:
| (A9) |
Inserting Eq. (A6) and using Eq. (A7), we arrive at
| (A10) |
Inserting this into the expansion equation (A8), we obtain
| (A11) |
with
| (A12) |
For the unconditional average in Eq. (A11), we use the fact that y(t) is a Gaussian variable, because s(t) is Gaussian variable and the integral is a linear operation that transfers a Gaussian into a Gaussian. Hence, for the probability density, we have
| (A13) |
with the variance given by
| (A14) |
where ks(t′) is the autocorrelation function of the stimulus. Performing the average, we obtain
| (A15) |
Here, ym is the conditional mean of y(t) given a spike at t = 0. This function is given by the integrated stimulus correlation function
| (A16) |
With Eq. (A15), we are now able to simplify Eq. (A5) and its temporal derivative. For the latter, we obtain, by taking into account only zeroth and first-order terms of the correlation function,
| (A17) |
For the power spectrum, we obtain Eq. (54), involving the time integral equation (55), which we rewrite here for convenience
| (A18) |
For the band-pass-limited white noise used in our models, the functions ym(t) and σ2(t) can be expressed by higher mathematical functions. Inserting those functions and calculating the double integral in Eq. (54) is still a numerically difficult task. However, using the weak-signal assumption and making further assumptions about the spectral statistics of the stimulus, the integral equation (A18) can be further simplified, and we end up with expressions for the power spectrum that contain one integral only.
We first treat the case that the lower-cutoff frequency of the stimulus is finite and not too small. We have then
| (A19) |
and
| (A20) |
For any finite value of t, both functions are bounded (there are no divergencies) and proportional to the variance of the stimulus, which is our small parameter. Under these conditions, it is justified to expand the exponential involving σ2(t) in Eq. (A18) and take into account only zero and first-order terms in ks(t), ym(t), and σ2(t). This yields
| (A21) |
In order to calculate the Fourier transform ỹm(f − f′), we write ym(t) as a convolution of the correlation function with a Heaviside jump function H(x),
| (A22) |
Using the convolution theorem and the Fourier transform of the Heaviside function, we obtain
| (A23) |
Similarly, we express σ2(t) as the time integral of ym(t), and express this integral again as a convolution with the Heavi-side function
| (A24) |
which yields
| (A25) |
Inserting this into the time integral and the latter into the formula for the spectrum, we arrive after a number of further straightforward simplifications at Eq. (60).
Next, we turn to the more complicated case in which the stimulus has power at arbitrary low frequencies. Then the exponent −2π2f′2σ(t) grows unbounded in the long time limit, since Sst(0) >0
| (A26) |
For arbitrary t, it is possible to write the variance as follows:
| (A27) |
with
| (A28) |
where the second term is now bounded for all t and can be expanded, as we did in the preceding case. Doing this and using the abbreviations ω= 2πf′ and Ω= 2π(f − f′), we obtain
| (A29) |
Expressing the correlation function once more by the Fourier transform of the stimulus power spectrum, we can carry out the temporal integral (including multiple integrations by part) and finally arrive at
| (A30) |
For a general input spectrum Sst(f), we are thus left with two integrals after inserting Eq. (A30) into Eq. (54). Note, however, that our original formula for the integral involved integrals of the correlation function, too. In the case of bandpass-limited white noise, the integral over the power spectrum in Eq. (A30) can be performed, yielding Eq. (63). Sorting out the real and imaginary parts of the prefactor gives a lengthy but explicit formula for the integral that can be used to calculate the power spectrum by only one integration (that with respect to f′).
References
- 1.Cox DR, Lewis PAW. The Statistical Analysis of Series of Events. Chapman and Hall; London: 1966. [Google Scholar]
- 2.Schäfer K, Braun HA, Peters RC. Eur J Physiol. 1995;429:378. doi: 10.1007/BF00374153. [DOI] [PubMed] [Google Scholar]
- 3.Goldberg JM, Fernandez C. J Neurosci. 1971;34:35. [Google Scholar]
- 4.Goldberg JM, Greenwood DD. J Neurosci. 1966;29:72. doi: 10.1152/jn.1966.29.1.72. [DOI] [PubMed] [Google Scholar]
- 5.Neiman A, Russell DF. Phys Rev Lett. 2001;86:3443. doi: 10.1103/PhysRevLett.86.3443. [DOI] [PubMed] [Google Scholar]
- 6.Bahar S, Kantelhardt JW, Neiman A, Rego HHA, Russell DF, Wilkens L, Bunde A, Moss F. Europhys Lett. 2001;56:454. [Google Scholar]
- 7.Lowen SB, Teich MC. J Acoust Soc Am. 1992;92:803. doi: 10.1121/1.403950. [DOI] [PubMed] [Google Scholar]
- 8.Ratnam R, Nelson ME. J Neurosci. 2000;20:6672. doi: 10.1523/JNEUROSCI.20-17-06672.2000. [DOI] [PMC free article] [PubMed] [Google Scholar]
- 9.Chacron MJ, Longtin A, St-Hilaire M, Maler L. Phys Rev Lett. 2000;85:1576. doi: 10.1103/PhysRevLett.85.1576. [DOI] [PubMed] [Google Scholar]
- 10.Chacron MJ, Longtin A, Maler L. J Neurosci. 2001;21:5328. doi: 10.1523/JNEUROSCI.21-14-05328.2001. [DOI] [PMC free article] [PubMed] [Google Scholar]
- 11.Middleton JW, Chacron MJ, Lindner B, Longtin A. Phys Rev E. 2003;68:021920. doi: 10.1103/PhysRevE.68.021920. [DOI] [PubMed] [Google Scholar]
- 12.Lindner B. Phys Rev E. 2004;69:022901. doi: 10.1103/PhysRevE.69.022901. [DOI] [PubMed] [Google Scholar]
- 13.Chacron MJ, Lindner B, Longtin A. Phys Rev Lett. 2004;92:080601. doi: 10.1103/PhysRevLett.92.080601. [DOI] [PubMed] [Google Scholar]
- 14.Shin JH, Lee KR, Park SB. Int J Electron. 1993;74:359. [Google Scholar]
- 15.Shin J. Neurocomputing. 2002;44:167. [Google Scholar]
- 16.Mar DJ, Chow CC, Gerstner W, Adams RW, Collins JJ. Proc Natl Acad Sci USA. 1999;96:10450. doi: 10.1073/pnas.96.18.10450. [DOI] [PMC free article] [PubMed] [Google Scholar]
- 17.Rieke F, Warland D, de Ruyter van Steveninck R, Bialek W. Spikes: Exploring the Neural Code. MIT Press; Cambridge, MA: 1996. [Google Scholar]
- 18.Gabbiani F. Network. 1996;7:61. doi: 10.1080/0954898X.1996.11978655. [DOI] [PubMed] [Google Scholar]
- 19.Borst A, Theunissen F. Nat Neurosci. 1999;2:947. doi: 10.1038/14731. [DOI] [PubMed] [Google Scholar]
- 20.de Ruyter van Steveninck RR, Lewen GD, Strong SP, Koberle R, Bialek W. Science. 1997;275:1805. doi: 10.1126/science.275.5307.1805. [DOI] [PubMed] [Google Scholar]
- 21.Strong SP, Koberle R, de Ruyter van Steveninck WRR, Bialek W. Phys Rev Lett. 1998;80:197. [Google Scholar]
- 22.Warland DK, Reinagel P, Meister M. J Neurophysiol. 1997;78:2336. doi: 10.1152/jn.1997.78.5.2336. [DOI] [PubMed] [Google Scholar]
- 23.Metzner W, Koch C, Wessel R, Gabbiani F. J Neurosci. 1998;18:2283. doi: 10.1523/JNEUROSCI.18-06-02283.1998. [DOI] [PMC free article] [PubMed] [Google Scholar]
- 24.Holden AV. Models of the Stochastic Activity of Neurones. Springer-Verlag; Berlin: 1976. [Google Scholar]
- 25.Gestri G, Mastebroek HAK, Zaagman WH. Biol Cybern. 1980;38:31. [Google Scholar]
- 26.Gabbiani F, Koch C. Neural Comput. 1996;8:44. [Google Scholar]
- 27.Gerstner W. Neural Comput. 2000;12:43. doi: 10.1162/089976600300015899. [DOI] [PubMed] [Google Scholar]
- 28.Azouz R, Gray CM. J Neurosci. 1999;19:2209. doi: 10.1523/JNEUROSCI.19-06-02209.1999. [DOI] [PMC free article] [PubMed] [Google Scholar]
- 29.Morse PM, Feshbach H. Methods of Theoretical Physics. McGraw-Hill; New York: 1953. [Google Scholar]
- 30.Lindner B, Longtin A. In: Noise in Complex Systems and Stochastic Dynamics. Schimansky-Geier L, Abbott D, Neiman A, Van den Broeck C, editors. Vol. 5114. SPIE; Bellingham, WA: 2003. p. 209. [Google Scholar]
- 31.Risken H. The Fokker-Planck Equation. Springer; Berlin: 1984. [Google Scholar]
- 32.Dykman MI, Luchinsky DG, Mannella R, Mc-Clintock PVE, Stein ND, Stocks NG. Nuovo Cimento D. 1995;17:661. [Google Scholar]
- 33.Neiman A, Schimansky-Geier L, Moss F. Phys Rev E. 1997;56:R9. [Google Scholar]
- 34.McNamara B, Wiesenfeld K. Phys Rev A. 1989;39:4854. doi: 10.1103/physreva.39.4854. [DOI] [PubMed] [Google Scholar]
- 35.Chacron MJ, Lindner B, Longtin A. Phys Rev Lett. 2004;93 doi: 10.1103/PhysRevLett.92.080601. 059904(E) [DOI] [PubMed] [Google Scholar]
- 36.Billah KYR, Shinozuka M. Phys Rev A. 1990;42:R7492. doi: 10.1103/physreva.42.7492. [DOI] [PubMed] [Google Scholar]
- 37.Wessel R, Koch C, Gabbiani F. J Neurophysiol. 1996;75:2280. doi: 10.1152/jn.1996.75.6.2280. [DOI] [PubMed] [Google Scholar]
- 38.Lindner B, Schimansky-Geier L. Phys Rev E. 2000;61:6103. doi: 10.1103/physreve.61.6103. [DOI] [PubMed] [Google Scholar]
- 39.Gabbiani F, Koch C. In: Methods in Neuronal Modeling: From Ions to Networks. Koch C, Segev I, editors. MIT Press; Cambridge, MA: 1989. p. 313. [Google Scholar]


