

Abstract
In seeking to understand G protein-coupled receptor (GPCR)-mediated signaling, X-ray and magnetic resonance approaches have played important roles—yet neither the protein dynamics nor the plasticity of GPCRs are amenable to study. Here we show that solid-state 2H NMR relaxation elucidates picosecond-nanosecond timescale motions of the retinal ligand that impact upon larger-scale functional dynamics of rhodopsin in membranes. A multiscale activation mechanism is put forward, whereby retinal initiates collective helix fluctuations in the Meta I–Meta II equilibrium on the microsecond-millisecond timescale.
TOC image
Rhodopsin is an important prototype for G protein-coupled receptors (GPCRs) that are implicated in biological signaling and constitute many human pharmaceutical targets. How the structure of the ligand is connected with larger-scale functional protein dynamics has remained elusive. Solid-state NMR relaxation shows that localized motions of retinal lead to collective fluctuations of transmembrane helices in the activation mechanism of the photoreceptor.
The molecular mechanisms of GPCR activation are the focus of considerable interest in cellular responses to biogenic amines and drugs, as well as taste, olfaction, vision, and a multitude of other biological signaling phenomena1,2. Knowledge of the 3D structures of rhodopsin3,4 and the β2-adrenergic receptor1 affords new opportunities for investigating GPCRs of human therapeutic significance. Despite the availability of crystal structures1,4, understanding rhodopsin activation is challenging due to lack of atomistic-level data for the signal transducing Meta II state2. We applied solid-state 2H NMR methods5 to give a new axis of information—the fourth dimension of time—needed to more fully interpret structural studies4,6,7. Our approach is quite different, as we investigate the intrinsic mobility of the ligand that changes during visual light excitation.
To explore the energy landscape8 for receptor activation, we measured 2H NMR relaxation times5 for the methyl (Me) groups9 of retinal bound to rhodopsin in the dark, Meta I, and activated Meta II states. Knocking out any of the Me groups yields back-shifting of the Meta I–Meta II equilibrium9, and loss of function. An overview of rhodopsin light activation10,11 illustrates the time scales of the major conformational transitions (Fig. 1a). Solid-state 2H NMR spectroscopy of dark-state rhodopsin with retinal 2H-labeled at the C5-, C9-, or C13-Me groups yields similar residual quadrupolar couplings (RQCs) (Figs. 1b–d). Yet pronounced variations are clearly evident in partially relaxed 2H NMR spectra (Figs. 1e,f), and from inversion-recovery curves (Fig. 1g) used to determine spin-lattice (T1Z) relaxation times.
Figure 1.

Site-specific 2H NMR relaxation illuminates functional dynamics of retinylidene methyl groups within binding pocket of rhodopsin. (a) Light absorption yields 11-cis to trans isomerization, converting retinal from an inverse agonist to an agonist by a series of intermediates with different time scales. (b–c) Solid-state 2H NMR spectra for dark-state rhodopsin with 11-cis retinal deuterated at C5-, C9-, or C13–C2H3 groups in POPC bilayers (1:50 molar ratio). The 2H NMR lineshapes indicate rapid axial spinning of C–C2H3 groups down to at least −160 °C. (e,f) Partially relaxed 2H NMR spectra for retinylidene C9- and C13–C2H3 groups of rhodopsin in aligned POPC membranes (θ=0°) at −150 °C. (g) Inversion-recovery plots showing site-specific variations in spin-lattice (T1Z) relaxation times for C9- and C13-Me groups at −150 °C.
A major strength of solid-state NMR spectroscopy is that membrane proteins are studied in a natural bilayer lipid environment12. Because the retinylidene Me groups at the C5, C9, and C13 carbons (Fig. 1) strongly affect the Meta I–Meta I equilibrium9, we conducted 2H NMR relaxation measurements of these positions (see Supplementary Fig. 1). Phosphoethanolamine (PE) head groups and unsaturated lipid acyl chains support rhodopsin activity13—they forward shift the Meta I–Meta II equilibrium, opposite to PC head groups. Hence we used a 1-palmitoyl-2-oleoyl-sn-glycero-3-phosphocholine (POPC) bilayer to trap Meta I, and a POPC bilayer containing 1,2-dioleoyl-sn-glycero-3-phosphoethanolamine (DOPE) to trap Meta II, as shown by UV-visible spectrophotometry (Supplementary Fig. 2). These results are explained by matching of the spontaneous (intrinsic) monolayer curvature (H0) to the membrane bilayer; POPC with H0 ≈ 0 favors Meta I, whereas DOPE has H0 < 0 and favors Meta II13. Such concepts have been previously reviewed13 and are receiving increased attention.
In the dark state, deformation of retinal12,14–16 (induced fit) gives striking differences in Me dynamics that are clearly evident in the 2H T1Z relaxation times (Fig. 2). Arrhenius-type plots of the T1Z data against inverse temperature for the retinylidene ligand in the dark, Meta I, and Meta II states are indeed unexpected: the T1Z times for the C9- and C13-Me groups increase with temperature, whereas those for the C5-Me exhibit a distinct minimum (Fig. 2a). Briefly, the T1Z minimum occurs at higher temperature (to the left) for slower motions (smaller pre-exponential factor and/or larger activation energy Ea), and conversely at lower temperature (to the right) for faster motions (larger pre-exponential factor and/or smaller Ea). At the T1Z minimum, effective correlation times (τc) for Me spinning are related to the nuclear Larmor (resonance) frequency (ω0) by τc≈1/ω0, due to matching the power spectrum of the fluctuations to the nuclear spin energy gap. For the C5-Me group the correlation time for the motions is τc >13ns below −100 °C. Interestingly, for the C9- and C13-Me groups the minimum falls outside the observed range (<−160 °C), so that τc <1/ω0≈13 ns (see below).
Figure 2.
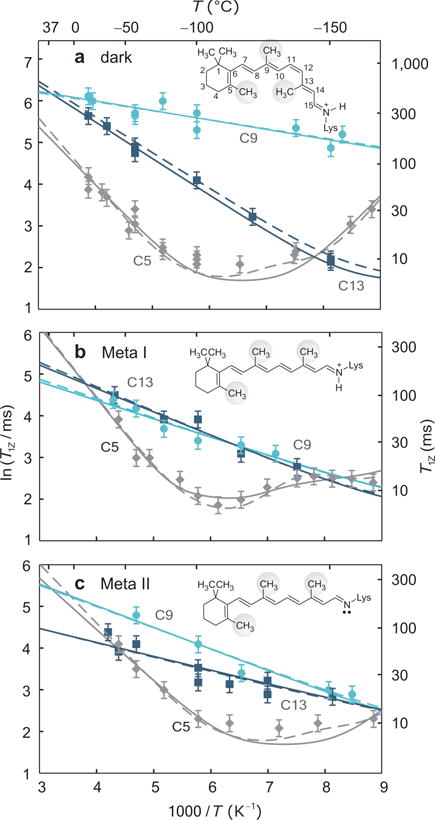
Solid-state 2H NMR of captures site-specific changes in retinal mobility during light activation of rhodopsin. Spin-lattice (T1Z) relaxation times (±s.d.) of retinylidene methyl groups are shown versus reciprocal temperature in (a) the dark, (b) Meta I, and (c) Meta II states (−30 to −160 °C). Methyl dynamics are described by an axial 3-fold jump model or a continuous diffusion model with coefficients D‖ and D⊥. In panels a–c rotation about the methyl 3-fold (C3) axis corresponds to solid lines with D⊥=0; the dashed lines include restricted off-axial diffusion (D⊥=D‖). Fits for the C5-Me in Meta I in panel b assume unlike rotational diffusion constants (D‖≠D⊥) (dashed line), or two conformers with different bond orientations and axial diffusion coefficients (solid line).
The light-induced changes in the retinylidene dynamics are encapsulated by pronounced T1Z differences in the Meta I and Meta II states (Figs. 2b,c). The short T1Z relaxation times of the C5-Me group suggest the β-ionone ring maintains a predominantly 6-s-cis conformation12, rather than 6-s-trans as in bacteriorhodopsin17. Notably18, the β–ionone ring is little affected by transitions among the dark, Meta I, and Meta II states—it retains nearly the same local environment12. A shift of the T1Z minimum for the C5-Me to lower temperatures in Meta II (Fig. 2c) implies a decrease in the local correlation time, e.g. due to lowering Ea by changing the C6–C7 torsional angle and/or increasing the ring mobility. For the functionally critical9 C9-Me group, a dramatic shift in T1Z is seen in Meta I and Meta II that manifests an increase in Ea for Me spinning within the rhodopsin binding pocket. Similar Ea barriers of the C9- and C13-Me groups after 11-cis to all-trans isomerization are logical, as they are now on the same side of retinal (Figs. 2b,c).
Next, we applied NMR relaxation theory5 to analyze the molecular dynamics of retinal bound to rhodopsin. The T1Z times were analyzed using either a 3-site jump model or a continuous diffusion model for rotation of the retinylidene Me groups5. Although the order parameters have little variation, large site-specific differences are evident in the pre-exponential factors and activation barriers (Ea) (Fig. 3a). For the C5-Me of the β-ionone ring (Ea=10–15 kJ mole−1) the values exceed those of the other Me groups in dark, Meta I, and Meta II states. Surprisingly, the C5-Me barrier stays nearly unaltered up to Meta II, consistent with a predominantly 6-s-cis conformation of the β-ionone ring12. Perhaps most striking, however, the C9-Me group—which is essential to rhodopsin function9—is literally a dynamical hotspot. Based on our quantum mechanical calculations (not shown), the remarkably small barrier to rotation of the C9-Me group (Ea=2 kJ mole−1 in the dark state) (Fig. 3a) arises from non-bonded (1,6) interactions with hydrogen atoms H7 and H11 of the polyene chain (see Fig. 1a). By contrast, for the C13-Me group near the protonated Schiff base (PSB) the barrier is greater, due to non-bonded (1,7) interactions with hydrogen H10. Upon 11-cis to trans isomerization (Fig. 1a) (1,6) interactions of the C13-Me group occur with both polyene hydrogens H11 and H15, so the C13-Me barrier (Ea=3–5 kJ mole−1) becomes comparable to the C9-Me barrier in the Meta I and Meta II states. Notably, in the sequence dark–Meta I–Meta II there is a progressive increase in Ea for the C9-Me of the polyene chain, accompanied by an opposite decrease for the C13-Me (Fig. 3a).
Figure 3.

2H NMR relaxation of retinal sheds new light on activation mechanism of rhodopsin. (a) Summary of analysis of solid-state 2H NMR measurements. Order parameters of rapidly spinning methyl groups are designated by ; the pre-exponential factor is k0 for 3-fold axial jumps or D0 for continuous diffusion; and Ea indicates the activation energy. (The diffusion model assumes either D⊥=0 (right) or ηD ≡ D‖/D⊥=1 (left) except for the C5-Me in Meta I, where ηD≠1.) (b–d) Proposed activation mechanism for rhodopsin in membranes based on X-ray19, FTIR11, and 2H NMR data12 (see text). Isomerization of retinal displaces the E2 loop towards the extracellular (e) side with fluctuations of TM helices H5 and H6 exposing transducin (Gt) recognition sites on the opposing cytoplasmic (c) surface. Figure produced (PDB code 1U19)3 using PyMOL [http://pymol.sourceforge.net/]
Rhodopsin (1U19)3 with retinal12 inserted into the ligand binding cavity allows us to propose how local ps–ns motions detected by 2H NMR correspond to large-scale ms functional protein motions (Fig. 3b,c)6,10. In the dark state, the low activation barrier of the C9-Me group signifies the absence of steric clashes, as it occupies a slot between Tyr268 and Thr118. In the Meta I NMR structure of retinal12, the C9-Me acts effectively as a hinge point for retinal isomerization, causing the C13-Me and the C=NH+– groups to change orientation. Rotation of the C13-Me displaces the β4 strand of the E2 loop towards the extracellular (e) side (Fig. 3c), disrupting a hydrogen-bonding network involving TM helices H4–H6, as suggested by a decrease in Ea for the C13-Me group. At the opposite end of retinal, the β-ionone ring is displaced towards the H3–H5 helical interface, giving a tighter packing for the C5-Me indicated by the relatively high Ea value in the Meta I state (Fig. 3a). The ionic lock involving the retinylidene PSB on H7 with its complex counterion due to Glu113 (H3) and Glu181 (E2) is broken by internal proton transfer from the PSB to Glu113 in Meta II. Straightening of retinal causes the β-ionone ring to move away from Trp265 (H6) towards Glu122 (H3), disrupting a second hydrogen-bonding network connecting TM helices H3 and H512. Initial movement of helix H6 from the H1–H4 helical core is accompanied by displacement of helix H5, bringing Tyr223 closer to Arg135 and Gly231 near to Glu247 (Fig. 3d)19. Destabilization of the charge adduct of Glu134 and Arg135 of the E(D)RY sequence of helix H3 with Glu247 of helix H619 yields transient exposure of transducin (Gt) recognition elements on the cytoplasmic (c) side (Fig. 3b). Receptor activation is further driven by protonation of Glu134 from the aqueous medium11.
According to the above picture, rhodopsin activation involves collective fluctuations of transmembrane helices H5 and H6 and the cytoplasmic loops in the Meta I–Meta II equilibrium. The reversible helix movements10,11 occur at kHz frequencies and match the catalytic turnover rate for Gt binding and activation by rhodopsin20. Receptor activation is due to a fluctuating equilibrium among states and substates10,11—an arresting illustration of the role of conformational entropy in GPCR biology. A key unanswered question is whether it will eventually be possible to quantitatively trap a unique activated rhodopsin conformation, or whether the receptor function is inextricably linked to dynamics of a conformational ensemble unlocked by photoisomerization of the retinal ligand.
Supplementary Material
Acknowledgments
We thank T. A. Cross, K. P. Hofmann, M. Hong, W. L. Hubbell, L. E. Kay, S. O. Smith, and R. W. Pastor for discussions. Retinal was provided by K. Tanaka, S. Krane, and K. Nakanishi. Financial support from the US National Institutes of Health (EY012049 and EY018891) is gratefully acknowledged.
Footnotes
Note: Supplementary information is available on the Nature Structural & Molecular Biology website.
AUTHOR CONTRIBUTIONS
A.V.S. and M.F.B. designed the research. A.V.S. and G.F.J.S. performed the experiments. A.V.S., G.F.J.S., and K.M. M. analyzed the data. A.V.S. and M.F.B. wrote the paper.
References
- 1.Kobilka B, Schertler GFX. Trends Pharmacol Sci. 2008;29:79–83. doi: 10.1016/j.tips.2007.11.009. [DOI] [PubMed] [Google Scholar]
- 2.Ahuja S, Smith SO. Trends Pharmacol Sci. 2009;30:494–502. doi: 10.1016/j.tips.2009.06.003. [DOI] [PubMed] [Google Scholar]
- 3.Okada T, et al. J Mol Biol. 2004;342:571–583. doi: 10.1016/j.jmb.2004.07.044. [DOI] [PubMed] [Google Scholar]
- 4.Ridge KD, Palczewski K. J Biol Chem. 2007;282:9297–9301. doi: 10.1074/jbc.R600032200. [DOI] [PubMed] [Google Scholar]
- 5.Brown MF. J Chem Phys. 1982;77:1576–1599. [Google Scholar]
- 6.Altenbach C, Kusnetzow AK, Ernst OP, Hofmann KP, Hubbell WL. Proc Natl Acad Sci USA. 2008;105:7439–7444. doi: 10.1073/pnas.0802515105. [DOI] [PMC free article] [PubMed] [Google Scholar]
- 7.Ahuja S, et al. J Biol Chem. 2009;284:10190–10201. doi: 10.1074/jbc.M805725200. [DOI] [PMC free article] [PubMed] [Google Scholar]
- 8.Frauenfelder H, et al. Proc Natl Acad Sci USA. 2009;106:5129–5134. doi: 10.1073/pnas.0900336106. [DOI] [PMC free article] [PubMed] [Google Scholar]
- 9.Vogel R, et al. Biochemistry. 2006;45:1640–1652. doi: 10.1021/bi052196r. [DOI] [PubMed] [Google Scholar]
- 10.Knierim B, Hofmann KP, Ernst OP, Hubbell WL. Proc Natl Acad Sci USA. 2007;104:20290–20295. doi: 10.1073/pnas.0710393104. [DOI] [PMC free article] [PubMed] [Google Scholar]
- 11.Mahalingam M, Martínez-Mayorga K, Brown MF, Vogel R. Proc Natl Acad Sci USA. 2008;105:17795–17800. doi: 10.1073/pnas.0804541105. [DOI] [PMC free article] [PubMed] [Google Scholar]
- 12.Struts AV, et al. J Mol Biol. 2007;372:50–66. doi: 10.1016/j.jmb.2007.03.046. [DOI] [PMC free article] [PubMed] [Google Scholar]
- 13.Brown MF. Chem Phys Lipids. 1994;73:159–180. doi: 10.1016/0009-3084(94)90180-5. [DOI] [PubMed] [Google Scholar]
- 14.Verdegem PJE, Bovee-Geurts PHM, de Grip WJ, Lugtenburg J, de Groot HJM. Biochemistry. 1999;38:11316–11324. doi: 10.1021/bi983014e. [DOI] [PubMed] [Google Scholar]
- 15.Spooner PJR, et al. Biochemistry. 2003;42:13371–13378. doi: 10.1021/bi0354029. [DOI] [PubMed] [Google Scholar]
- 16.Kukura P, McCamant DW, Yoon S, Wandschneider DB, Mathies RA. Science. 2005;310:1006–1009. doi: 10.1126/science.1118379. [DOI] [PubMed] [Google Scholar]
- 17.Copié V, et al. Biochemistry. 1994;33:3280–3286. doi: 10.1021/bi00177a019. [DOI] [PubMed] [Google Scholar]
- 18.Borhan B, Souto ML, Imai H, Shichida Y, Nakanishi K. Science. 2000;288:2209–2212. doi: 10.1126/science.288.5474.2209. [DOI] [PubMed] [Google Scholar]
- 19.Park JH, Scheerer P, Hofmann KP, Choe HW, Ernst OP. Nature. 2008;454:183–188. doi: 10.1038/nature07063. [DOI] [PubMed] [Google Scholar]
- 20.Ernst OP, Gramse V, Kolbe M, Hofmann KP, Heck M. Proc Natl Acad Sci USA. 2007;104:10859–10864. doi: 10.1073/pnas.0701967104. [DOI] [PMC free article] [PubMed] [Google Scholar]
Associated Data
This section collects any data citations, data availability statements, or supplementary materials included in this article.