Abstract
Objective
It is widely accepted that the presence of a glycosaminoglycan-rich glycocalyx is essential for endothelialized vasculature health; in fact, a damaged or impaired glycocalyx has been demonstrated in a number of vascular diseases. Currently, there are no methods that characterize glycocalyx functionality, thus limiting investigators’ ability to assess the role of the glycocalyx in vascular health.
Approach and Results
We have developed novel easy to use in vitro assays that directly quantify live endothelialized surface’s functional heparin weights and their anti-coagulant capacity to inactivate Factor Xa and thrombin. Using our assays, we characterized two commonly used vascular models: native rat aorta and cultured human umbilical vein endothelial cell (HUVEC) monolayer. We determined heparin contents to be about 10,000 ng/cm2 on the native aorta, and about ten-fold lower on cultured HUVECs. Interestingly HUVECs demonstrated a five-fold lower anti-coagulation capacity in inactivating both Factor Xa and thrombin relative to native aortas. We verified the validity and accuracy of the novel assays developed in this work using LC-MS analysis.
Conclusions
Our assays are of high relevance in the vascular community as they can be utilized to establish the anti-thrombogenic capacity of many different types of surfaces such as vascular grafts and transplants. This work will also advance the capacity for glycocalyx-targeting therapeutics development to treat damaged vasculatures.
Keywords: Glycocalyx, heparin, endothelial cells, coagulation/thrombosis
Graphical abstract

Introduction
There is mounting evidence to suggest that the presence of an intact glycocalyx is required to achieve a healthy vascular endothelial cell (EC) lining in blood vessels1. In fact, the presence of damaged glycocalyx has been demonstrated in a number of vascular pathologies: hyperglycemia, trauma, sepsis and systemic inflammatory states such as diabetes1–5. The glycocalyx systematic destruction in such disease states has been well documented; unfortunately, no therapeutic option for the restoration of the glycocalyx has emerged4, 6, 7.
The endothelial glycocalyx serves a number of functions, of which the coagulation cascade modulation is of particular interest to this work. Regulated by the glycocalyx constituents namely the glycosaminoglycans (GAGs) they extend from several hundred nanometers up to a few microns. Of the various GAGs, heparan sulfate (HS) making up 60–90% of the total amount of the vascular glycocalyx is arguably the most important functional GAG7. HS serves as a potent negative regulator of coagulation and a key component of vascular hemostasis8–12. The ability of HS to inhibit coagulation has been extensively characterized, where mediation of antithrombin (AT, previously called antithrombin III, also known as heparin cofactor I) is one of HS’s best-recognized roles in the coagulation cascade2, 5, 12–14. Specifically, HS side-chain pentasaccharide sequence binding activates AT via a conformational change, allowing activated AT to inhibit the key coagulation protease Factor Xa (FXa) or thrombin by forming an equimolar complexes15. For inhibition of thrombin, however, heparin must bind to both AT (via the pentasaccharide sequence) and thrombin (via a minimum of 13 additional saccharide units), thus HS contains <18 saccharide units doesn’t have the ability to inhibit thrombin16. Thus compared to unfractionated heparin, low-molecular-weight heparin has less ability to inactivate thrombin but there is no difference for FXa inhibition between unfractionated heparin and low-molecular-weight heparin17. To be noted, endothelialized surfaces such as native rat aorta or HUVEC monolayer contain tissue factor pathway inhibitor (TFPI)18, 19 that can directly inhibit FXa but not thrombin20.
Despite the profound importance of the endothelial health in patients, and the growing evidence that the glycocalyx is essential for vascular homeostasis, there are no in vitro or in vivo methods to assess if the glycocalyx is healthy, damaged, and/or functional. Additionally, fundamental studies such as the direct characterization of anticoagulant properties of 1) in vivo grown glycocalyx on native endothelialized surfaces; and 2) in vitro culture grown glycocalyx on ECs have yet to be performed. Therefore, although it has been speculated that N-acetyl cysteine, AT, hydrocortisone, and sevoflurane anesthesia could be beneficial for protecting or treating damaged glycocalyx, these hypotheses remain untested5. Furthermore, any glycocalyx-targeting therapeutic development for damaged vasculature will depend on our ability to directly quantify and understand the properties of treated and untreated glycocalyx.
In this study, we developed easy to use novel assays that quantify endothelialized surfaces’ heparin weight per surface area and their anti-coagulant capacity to inactivate FXa and thrombin. Using these assays we characterized the two most commonly used vascular models: an explanted rat aorta and cultured human umbilical vein endothelial cell (HUVEC) monolayer. To our knowledge, this is the first study defining native vessels’ and ECs’ capacity to inactivate pro-coagulant enzymes, and also the first report of functional endothelial glycocalyx quantification.
Materials and methods
Materials and Methods are available in the online-only Data Supplement.
Results
Generation of standard curves using heparin standard
We first measured the potential of logarithmically increasing heparin concentrations to inactivate 2 units of FXa by adding excess AT. AT binds available heparin (which activates AT) to form the activated AT-FXa complex. Using FXa-specific chromogenic substrate, we then measured the color developed by free FXa over time (Figure 1A). The absorbance curve had two areas of interest: initial slope (green box, 2–6 min) and absorbance at 16 min (end of assay) (Figure 1A), which were used to generate two different standard curves (Figure 1B, 1C). The first standard curve relates the heparin weight to absorbance slope (Figure 1B). As expected, decreasing slopes were generated with increasing heparin weights, as heparin inactivates FXa, resulting in a reduction of color development of unbound FXa (Figure 1B).The second standard curve was generated based on the assumptions that: 1) the assay was at steady state at 16 min; and 2) the remaining FXa unit is linearly proportional to the measured absorbance at the steady state. For example, 2 units of FXa activity remains in the absence of heparin (0 ng heparin), meaning that absorbance at 16 min represents 2 units of residual FXa. At 10 ng heparin, the absorbance is 0.21, 70% of that for 0 ng heparin (2 units of residual FXa), representing 1.4 units of residual FXa (Supplemental Table I).The second standard curve relates the absorbance at the end of assay (16 min) with the inactivated FXa enzymatic units (Figure 1C).
Figure 1. Standard curves of FXa inactivation induced by heparin.

(A) Representative data showing absorbance readings of residual FXa at logarithmically increasing heparin weights. Slopes of curve between 2–6 min (green area) were determined. (B) Standard curve showing linear correlation between the slope of curve (generated from the green area in A) and Log [heparin weights]. (C) Standard curve showing linear correlation between the absorbance at 16 min (end point in A) and the inactivated FXa units. The results are mean ± SEM of 6 independent assays using new heparin batches for each assay run.
For the thrombin activity assay, we recorded the capacity of logarithmically increasing heparin concentrations to inactivate 0.5 units of thrombin (Figure 2A). Similarly as FXa assay, we chose the initial slope (blue box, 2–6 min) and the absorbance at the end of the assay (11 min) to generate two standard curves (Figure 2B, 2C). The first standard curve relates the heparin weight to thrombin absorbance slopes (Figure 2B). As expected, decreasing slopes were generated with increasing heparin weights, as heparin inactivates thrombin, resulting in a reduction of color development of unbound thrombin (Figure 2B). The second standard curve was similarly generated based on the assumptions that: 1) the assay was at steady state at 11 min; and 2) the remaining thrombin unit is linearly proportional to the measured absorbance at the steady state. For example, 0.5 units of thrombin activity remains in the absence of heparin (0 ng heparin), meaning that absorbance at 11 min represents 0.5 units of residual thrombin. At 10 ng heparin, the absorbance is 0.13, 86.7% of that for 0 ng heparin (0.5 units of residual thrombin), representing 0.42 units of residual thrombin (Supplemental Table II). The second standard curve relates the absorbance at the end of detection (11 min) with the inactivated thrombin enzymatic units (Figure 2C).
Figure 2. Standard curves of thrombin inactivation induced by heparin.

(A) Representative data showing absorbance readings of residual thrombin at logarithmically increasing heparin weights. Slopes of curve between 2–6 min (blue area) were determined. (B) Standard curve showing linear correlation between the slope of curve (generated from the blue area in A) and Log [heparin weights]. (C) Standard curve showing linear correlation between the absorbance at 11 min (end point in A) and the inactivated thrombin units. The results are mean ± SEM of 6 independent assays using new heparin batches for each assay run.
Factor Xa and thrombin inactivation by native rat aorta and endothelial cell culture
We then proceeded to measure the FXa and thrombin inactivation potentials for the following biological substrates: HUVEC monolayer, native rat aorta, and heparinase-treated rat aorta. Using the standard curves (Figures 1B, 1C, 2B, 2C), we calculated the biological substrates’ HS contents. The absorbance curves on the biological surfaces generated by residual FXa and thrombin are shown in Figures 3A and 4A, respectively. For both FXa and thrombin, the slope at 2–6 min for native aorta with intact glycocalyx was almost flat, where that for heparinase-treated aorta (essentially all heparin was removed) was very steep. When these slopes are applied back to the FXa standard curve (Figure 1B), we obtain per cm2: 10,500 ng heparin on native aorta, 920 ng heparin on HUVECs and heparin absence on heparinase-treated aorta (Figure 3B). Similarly, the thrombin inactivation slopes applied back to the standard thrombin curve (Figure 2B) result in comparable heparin equivalents: 10,100 ng heparin on native aorta, 890 ng heparin on HUVECs and heparin absence on heparinase treated aorta (Figure 4B).
Figure 3. Measurement of 1 cm2 biological surface’s capacity to form pro-coagulant complexes and heparin equivalent estimation with the FXa assay.
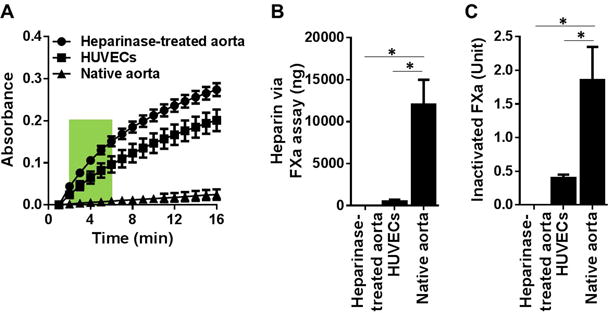
(A) Absorbance readings of residual FXa generated from: native aorta, heparinase-treated aorta and HUVEC monolayer of 1 cm2 surface area. The results are mean ± SEM of 5 independent assays using five different rats and HUVEC culture (n=5). (B) Heparin equivalent weight was estimated via the slope of curve at 2–6 min (green box in A) against the standard curve in Figure 1B. (C) Inactivated FXa was estimated via the absorbance at 16 min (end point in A) against the standard curve in Figure 1C. * p < 0.05.
Figure 4. Measurement of 1 cm2 biological surface’s capacity to form pro-coagulant complexes and heparin equivalent estimation with the thrombin assay.
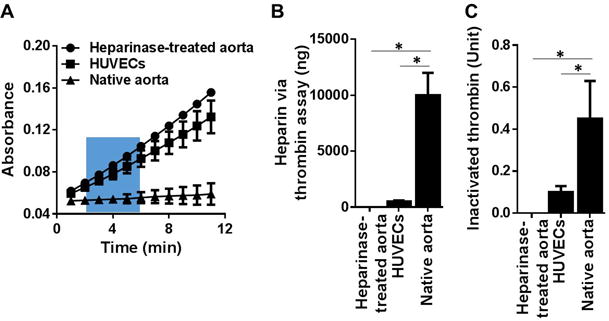
(A) Absorbance readings of residual thrombin generated from: native aorta, heparinase-treated aorta and HUVEC monolayer of 1 cm2 surface area. The results are mean ± SEM of 5 independent assays using five different rats and HUVEC culture (n=5). (B) Heparin equivalent weight was estimated via the slope of curve at 2–6 min (blue box in A) against the standard curve in Figure 2B. (C) Inactivated thrombin was estimated via the absorbance at 11 min (end point in A) against the standard curve in Figure 2C. * p < 0.05.
When the absorbance at the end of assay (16 min for FXa) was applied back to the standard curve (Figure 1C), we obtained the biological surface’s capacity to inactivate FXa as shown in Figure 3C: native aorta inactivates 1.85 units of FXa, an inactivation capacity it losses following heparinase treatment; and cultured HUVEC monolayer inactivated 0.4 units of FXa, which was five-fold lower than rat aorta’s FXa inactivation. A similar trend was seen with the biological surface’s capacity to inactivate thrombin (Figure 4C) where the native aorta inactivates 0.45 units of thrombin but loses thrombin inactivation capacity following the heparinase treatment. Cultured HUVEC monolayer inactivated 0.1 units of thrombin, which was five-fold lower than rat aorta’s thrombin inactivation.
LC-MS quantification of HS in rat aorta and endothelial cell monolayer surfaces
Using LC-MS, the HS component disaccharides were identified and quantified per cm2 surface area, for native aorta and cultured HUVECs. Resulting extracted ion chromatograms (EIC) and complete disaccharide analyses are presented in Figure 5. The primary disaccharide components in the native aorta were found to be unsulfated (0S) and singly N-sulfated (NS) disaccharides, accounting for 61% and 27% of the bulk HS structures, respectively. The remaining 12% of the HS bulk was very diverse in structure with only 8% of the aortic HS belonging to the most highly sulfated disaccharide, the tri-sulfated (TriS) disaccharide. In contrast to that in the native aorta, HS in cultured HUVEC monolayer was mainly composed of TriS disaccharide (48%). Of higher relevance to our study, the cumulative sum of all disaccharides amounted to: 12,560 ng of HS per cm2 of aorta, and 573 ng of HS per cm2 of confluent HUVECs (Figure 5). These results are consistent with the heparin weights determined using the FXa and thrombin assays (Figures 3, 4). The strong correlation between the newly developed assays and the established LC-MS quantification serves as verification supporting the newly developed assays’ accuracy in quantifying high and low heparin content on live surfaces within the ranges tested herein (Supplemental Figure I).
Figure 5. LC-MS quantification of HS content on rat aorta and HUVEC monolayer surfaces.
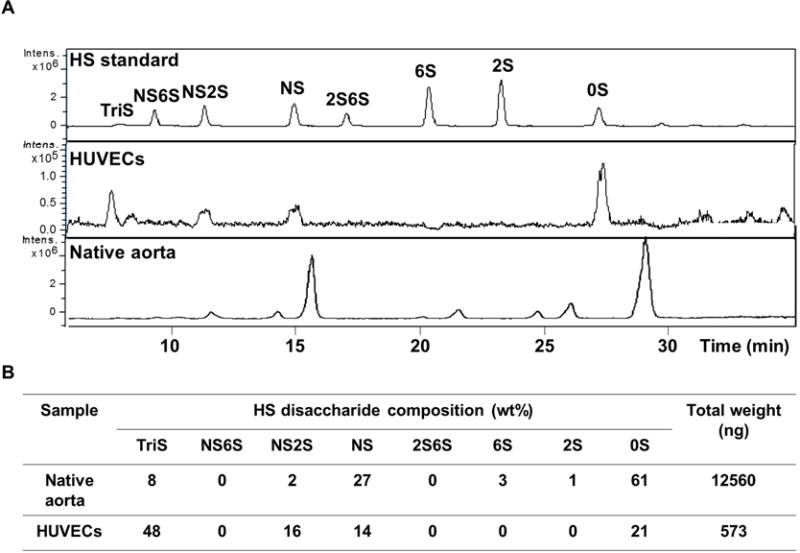
(A) Representative extracted-ion chromatogram of HS disaccharide standard, HUVEC monolayer (1 cm2 surface area) and native rat aorta (1 cm2 surface area). (B) Quantification of HS disaccharide composition. The results are mean of five independent assays using five different rats and HUVEC culture (n=5).
When the anticoagulant properties of the biological structures are normalized to mg of heparin, cultured HUVECs resulted in a five-fold higher FXa and thrombin inactivation ratio relative to native aorta; and a six-fold higher ratio of TriS to total HS disaccharides relative to native aorta (Table 1). These results indicate a high anticoagulant heparin-like structure for HUVECs and low anticoagulant properties for the aortal HS13, 21, 22.
Table 1.
Comparison of anti-FXa and anti-thrombin activity on live surfaces
| Live endothelialized surface | Anti-FXa activity (U/mg) | Anti-thrombin activity (U/mg) | TriS (%) |
|---|---|---|---|
| Native aorta | 154 ± 12 | 38 ± 7 | 8 |
| HUVECs | 800 ± 21 | 200 ± 9 | 48 |
| HUVECs/Native aorta (ratio) | 5.2 | 5.3 | 6 |
FXa and thrombin assays were used for anti-FXa and anti-thrombin activity assessment, and TriS percentage was measured by established LC-MS. The results are mean ± SD of five independent assays using five different rats and HUVECs cultures (n=5).
Visual verification of glycocalyx removal in rat aorta
HS removal by heparinase digestion on the rat aorta was visually verified at an ultrastructural level using TEM imaging (Figure 6). Control aorta revealed luminal “fuzzy” structures, typical of the glycocalyx architecture, extending up to 50 nm in thickness (Figure 6C, 6E). Following heparinase digestion, the plasma membrane of endothelial cells was exposed, with little or no remaining glycocalyx structures (Figure 6D, 6F). The preservation of endothelial cells post heparinase treatment was verified by H&E staining (Figure 6B).
Figure 6. TEM of HS chain spatial distribution on rat aorta.
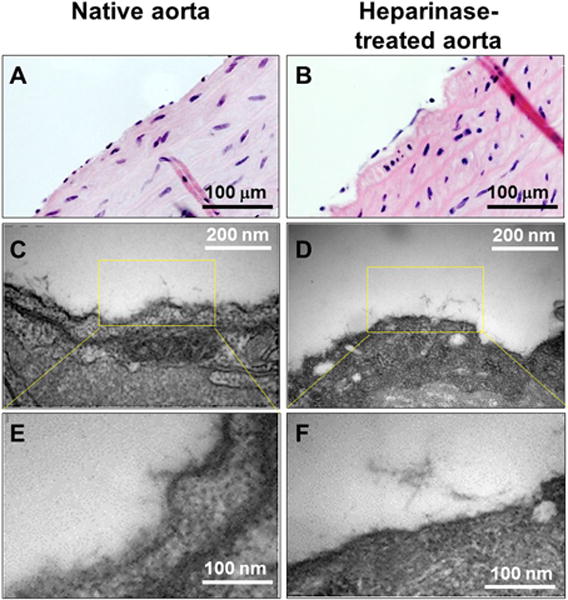
(A, B) H&E staining for native rat aorta (A) and heparinase-treated rat aorta (B). (C, E) TEM of native aorta showing preserved glycocalyx as a fuzzy structure extending from the plasma membrane. (D, F) TEM of heparinase-treated rat aorta showing the loss of fuzzy structure due to digestion of HS polysaccharide.
Glycocalyx imaging with AT binding and immunofluorescent staining
We probed HS chains’ capacity to bind and retain AT, in order to provide a visual confirmation for glycocalyx HS functionality in native aorta but loss of functionality in heparinase-treated aorta. As expected, fluorescein-labeled AT binding revealed a continuous HS chain layer on native aortas (Figure 7A), which was lost following heparinase treatment (Figure 7B). HS chain removal was further verified using a standard HS proteoglycan antibody, which also demonstrated a significant reduction in HS staining following heparinase treatment (Figure 7C, 7D). Using three-dimensional reconstructed images, we estimated the height of the glycocalyx on the native aorta to be approximately 60 nm thick (Figure 7E, 7G). Following heparinase treatment, the green-stained layer was mostly lost and the cell nuclei are surface-exposed (Figure 7F, 7H). Using AT binding and anti-HS antibody we also detected the glycocalyx in a monolayer of ECs that was lost following heparinase treatment (Supplemental Figure II), indicating the applicability of our imaging approaches.
Figure 7. Confocal images of the glycocalyx layer on native rat aorta and heparinase-treated aorta.
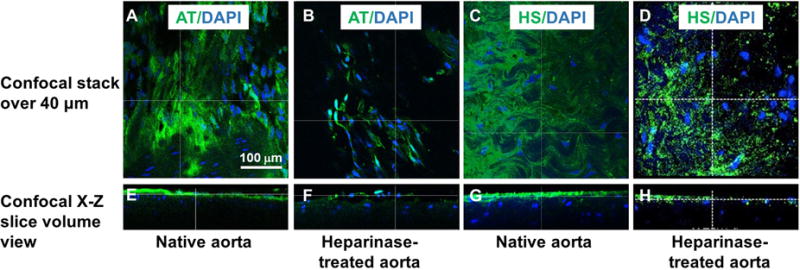
(A, B, E, F) HS is visualized by fluorescein-labeled AT (green). (C, D, G, H) HS is visualized by anti-HS antibody (green). Also shown is DAPI costaining (blue). The X-Z plane side view (E–H) showing the depth of the glycocalyx in native aorta (E, G) and heparinase-treated aorta (F, H).
Discussion
The glycocalyx is thought to contribute to the ability of healthy vessels to remain anti-thrombogenic. Indeed, a damaged and/or reduced glycocalyx has been linked to various vascular pathologies2, 3, 5, 7, 10, 14, 23, 24. However, studies exploring the role and structure of the glycocalyx have yet to directly quantify the anti-thrombogenic properties of this important endothelial coating.
The primary goal of this study was to develop quantification tools to measure the anti-thrombogenic capacity of the glycocalyx on live endothelialized surfaces. Our newly developed assays measure a given surface’s HS content as well as the surface’s capacity to inactivate FXa and thrombin, two key enzymes in the coagulation cascade. To the best of our knowledge, the assay described in this work is the first reported measurement of live endothelialized surface’s HS content and capacity to inactivate coagulant enzymes. These measurements are important to the vascular biology community, as they set the boundary conditions for heparin-equivalent activity for two common human glycocalyx experimental models – the in vivo rat vasculature and in vitro cultured ECs.
To correlate our results with other published studies, we quantified the glycocalyx HS content on native aorta and cultured HUVECs using standard LC-MS analytical techniques. LC-MS quantification confirmed the heparin masses that were functionally determined by FXa and thrombin assays for both the aorta and HUVECs. In other words, the accepted standard LC-MS disaccharide quantification technique validated the assays’ capacity to accurately predict the HS weight content per surface area of live biological structures.
Although the primary focus of our study is the validation of the newly developed assays, it is worth mentioning that the LC-MS quantification revealed two very different HS glycocalyx compositions of the in vitro and in vivo endothelialized surfaces. Only 8% of the bulk aortic HS belonged to TriS, while the bulk of HS on HUVECs was composed of TriS. This suggests that in vitro cells preferentially initiate production of the highest functional HS chains25, resulting in a five-fold higher anti-FXa and anti-thrombin activity per mg HS on cultured cells compared to native aorta. Despite the low heparin-like mass (TriS content), the aortic surface demonstrated higher anti-coagulant activity per surface area due to higher total bulk HS. Therefore, our studies suggest that the functional difference observed between in vitro and in vivo glycocalyx is based on overall HS density: a denser glycocalyx is more anti-thrombogenic, even if it displays lower percentages of highly sulfated HS structures. These results are all the more important as there has been speculation that cultured glycocalyx is less efficacious (per area) than native vascular glycocalyx, but this functional difference has not been previously assessed10, 26.
One potential limitation of our analysis is the incomplete or partial digestion of the surfaces, resulting in inaccurate LC-MS quantification of HS amounts. To confirm full digestion of the surface glycocalyx, we visually verified the removal of HS following heparinase digestion using TEM and AT binding. While TEM is an accepted glycocalyx visualization tool, we postulated that the HS-AT binding interaction would allow direct visualization of heparin-like domains in the glycocalyx, as heparinase-digested glycocalyx is known to have reduced AT binding capacity11. Our TEM and confocal imaging confirmed the complete HS removal following heparinase digestion treatment.
Another potential limitation of our assay is an inaccurate measure of the glycocalyx HS chains due to the bound form while the functional assay standard was soluble unfractionated heparin. One advantage of fully soluble heparin is that all of heparin chains are accessible to AT binding and FXa/thrombin inactivation. However, in assessing the anticoagulant activity of surface-bound HS, it is possible that there is an under-estimation of activity, as there may be sections of the HS chains that are buried or inaccessible to AT binding for subsequent FXa/thrombin inhibition.
Finally, it should be noted that our assay is limited in scale, by only measuring the inactivation of two enzymes (FXa and thrombin). As the coagulation cascade is more complex than just these two proteases, these assays performed together and/or independently may not be representative of a surface’s complete anti-thrombogenic capacity. However, as FXa and thrombin are prominent proteases of the coagulation cascade, and the final common enzymes of the intrinsic and extrinsic pathways, their inactivation represents a reasonable approximation of the coagulation cascade activation potential leading to fibrin formation and blood clots. In fact, the inactivation of FXa and thrombin is routinely used to measure the anti-coagulant property of medical heparin and heparin-like materials.
In this work, we developed novel assays to examine the capacity of live surfaces to inactivate coagulant enzymes for the first time. Our measurements of anti-coagulant activity, HS structural composition and quantification of HS amounts will help set a baseline of structure and function of healthy endothelium and endothelial surfaces. This assay is a powerful yet simple-to-use tool for studying the functional anti-coagulant capacity of live endothelialized surfaces. Furthermore, this assay can be used to characterize the anti-thrombogenic capacity of many different types of surfaces, such as vascular grafts and transplants, which commonly fail due to blood clotting (thrombosis). Better characterization of live surfaces’ coagulant capacity will also enable us to develop therapeutic treatments for glycocalyx restoration.
Supplementary Material
Highlights.
New in vitro assays were developed to quantify live vascular structures’ and cultured endothelial cells’ glycocalyx capacity to inactivate pro-coagulant enzymes.
The assays provide easy and accurate evaluation of live endothelialized surface anti-thrombogenic functions as verified by LC-MS disaccharide analysis.
Cultured endothelial cells initiate glycocalyx production with high anticoagulant structures but produce less overall glycocalyx compared to native aortas.
Acknowledgments
All persons acknowledged have seen and approved mention of their names in the article.
Sources of Funding
This study was supported (in part) by research funding from Howard Hughes Medical Institute to SD, and NIH funding to LEN (R01 HL083895-08).
Abbreviations
- HUVEC
human umbilical vein endothelial cell
- EC
endothelial cell
- FXa
Factor Xa
- GAG
glycosaminoglycan
- HS
heparan sulfate
- AT
antithrombin
- TriS
tri-sulfated
- EIC
extracted ion chromatograms
- LC-MS
liquid chromatography mass spectrometry
- RFPEC
rat fat pad endothelial cell
Footnotes
Disclosures
LEN is a founder and shareholder in Humacyte, Inc, which is a regenerative medicine company. Humacyte produces engineered blood vessels from allogeneic smooth muscle cells for vascular surgery. LEN’s spouse has equity in Humacyte, and LEN serves on Humacyte’s Board of Directors. LEN is an inventor on patents that are licensed to Humacyte and that produce royalties for LEN. LEN has received an unrestricted research gift to support research in her laboratory at Yale. Humacyte did not fund these studies, and Humacyte did not influence the conduct, description or interpretation of the findings in this report.
Subject codes: Diagnostic Testing, Transplantation, Treatment, Atherosclerosis, Vascular Disease
References
- 1.van den Berg BM, Nieuwdorp M, Stroes ES, Vink H. Glycocalyx and endothelial (dys) function: From mice to men. Pharmacological reports : PR. 2006;58(Suppl):75–80. [PubMed] [Google Scholar]
- 2.Weinbaum S, Tarbell JM, Damiano ER. The structure and function of the endothelial glycocalyx layer. Annual review of biomedical engineering. 2007;9:121–167. doi: 10.1146/annurev.bioeng.9.060906.151959. [DOI] [PubMed] [Google Scholar]
- 3.Zeng Y, Ebong EE, Fu BM, Tarbell JM. The structural stability of the endothelial glycocalyx after enzymatic removal of glycosaminoglycans. PloS one. 2012;7:e43168. doi: 10.1371/journal.pone.0043168. [DOI] [PMC free article] [PubMed] [Google Scholar]
- 4.Woodcock TE, Woodcock TM. Revised starling equation and the glycocalyx model of transvascular fluid exchange: An improved paradigm for prescribing intravenous fluid therapy. British journal of anaesthesia. 2012;108:384–394. doi: 10.1093/bja/aer515. [DOI] [PubMed] [Google Scholar]
- 5.Becker BF, Chappell D, Bruegger D, Annecke T, Jacob M. Therapeutic strategies targeting the endothelial glycocalyx: Acute deficits, but great potential. Cardiovascular research. 2010;87:300–310. doi: 10.1093/cvr/cvq137. [DOI] [PubMed] [Google Scholar]
- 6.Potter DR, Jiang J, Damiano ER. The recovery time course of the endothelial cell glycocalyx in vivo and its implications in vitro. Circulation research. 2009;104:1318–1325. doi: 10.1161/CIRCRESAHA.108.191585. [DOI] [PMC free article] [PubMed] [Google Scholar]
- 7.Reitsma S, Slaaf DW, Vink H, van Zandvoort MA, oude Egbrink MG. The endothelial glycocalyx: Composition, functions, and visualization. Pflugers Archiv : European journal of physiology. 2007;454:345–359. doi: 10.1007/s00424-007-0212-8. [DOI] [PMC free article] [PubMed] [Google Scholar]
- 8.Kinsella MG, Irvin C, Reidy MA, Wight TN. Removal of heparan sulfate by heparinase treatment inhibits fgf-2-dependent smooth muscle cell proliferation in injured rat carotid arteries. Atherosclerosis. 2004;175:51–57. doi: 10.1016/j.atherosclerosis.2004.01.045. [DOI] [PubMed] [Google Scholar]
- 9.Lindblom A, Fransson LA. Endothelial heparan sulphate: Compositional analysis and comparison of chains from different proteoglycan populations. Glycoconjugate journal. 1990;7:545–562. doi: 10.1007/BF01189076. [DOI] [PubMed] [Google Scholar]
- 10.Tumova S, Woods A, Couchman JR. Heparan sulfate proteoglycans on the cell surface: Versatile coordinators of cellular functions. The international journal of biochemistry & cell biology. 2000;32:269–288. doi: 10.1016/s1357-2725(99)00116-8. [DOI] [PubMed] [Google Scholar]
- 11.Justus AC, Roussev R, Norcross JL, Faulk WP. Antithrombin binding by human umbilical vein endothelial cells: Effects of exogenous heparin. Thrombosis research. 1995;79:175–186. doi: 10.1016/0049-3848(95)00103-x. [DOI] [PubMed] [Google Scholar]
- 12.Shriver Z, Sundaram M, Venkataraman G, Fareed J, Linhardt R, Biemann K, Sasisekharan R. Cleavage of the antithrombin iii binding site in heparin by heparinases and its implication in the generation of low molecular weight heparin. Proceedings of the National Academy of Sciences of the United States of America. 2000;97:10365–10370. doi: 10.1073/pnas.97.19.10365. [DOI] [PMC free article] [PubMed] [Google Scholar]
- 13.Dull RO, Mecham I, McJames S. Heparan sulfates mediate pressure-induced increase in lung endothelial hydraulic conductivity via nitric oxide/reactive oxygen species. American journal of physiology. Lung cellular and molecular physiology. 2007;292:L1452–1458. doi: 10.1152/ajplung.00376.2006. [DOI] [PubMed] [Google Scholar]
- 14.Nieuwdorp M, Meuwese MC, Vink H, Hoekstra JB, Kastelein JJ, Stroes ES. The endothelial glycocalyx: A potential barrier between health and vascular disease. Current opinion in lipidology. 2005;16:507–511. doi: 10.1097/01.mol.0000181325.08926.9c. [DOI] [PubMed] [Google Scholar]
- 15.Hirsh J, Anand SS, Halperin JL, Fuster V. Guide to anticoagulant therapy: Heparin : A statement for healthcare professionals from the american heart association. Circulation. 2001;103:2994–3018. doi: 10.1161/01.cir.103.24.2994. [DOI] [PubMed] [Google Scholar]
- 16.Hirsh J, Warkentin TE, Shaughnessy SG, Anand SS, Halperin JL, Raschke R, Granger C, Ohman EM, Dalen JE. Heparin and low-molecular-weight heparin: Mechanisms of action, pharmacokinetics, dosing, monitoring, efficacy, and safety. Chest. 2001;119:64s–94s. doi: 10.1378/chest.119.1_suppl.64s. [DOI] [PubMed] [Google Scholar]
- 17.Andersson LO, Barrowcliffe TW, Holmer E, Johnson EA. Söderström G. Molecular weight dependency of the heparin potentiated inhibition of thrombin and activated factor x. Effect of heparin neutralization in plasma. Thrombosis research. 15:531–541. doi: 10.1016/0049-3848(79)90159-2. [DOI] [PubMed] [Google Scholar]
- 18.Hansen JB, Olsen R, Webster P. Association of tissue factor pathway inhibitor with human umbilical vein endothelial cells. Blood. 1997;90:3568–3578. [PubMed] [Google Scholar]
- 19.Kato H. Regulation of functions of vascular wall cells by tissue factor pathway inhibitor: Basic and clinical aspects. Arterioscler Thromb Vasc Biol. 2002;22:539–548. doi: 10.1161/01.atv.0000013904.40673.cc. [DOI] [PubMed] [Google Scholar]
- 20.Peraramelli S, Thomassen S, Heinzmann A, Rosing J, Hackeng TM, Hartmann R, Scheiflinger F, Dockal M. Inhibition of tissue factor:Factor viia-catalyzed factor ix and factor x activation by tfpi and tfpi constructs. Journal of thrombosis and haemostasis : JTH. 2014;12:1826–1837. doi: 10.1111/jth.12713. [DOI] [PubMed] [Google Scholar]
- 21.Dull RO, Dinavahi R, Schwartz L, Humphries DE, Berry D, Sasisekharan R, Garcia JG. Lung endothelial heparan sulfates mediate cationic peptide-induced barrier dysfunction: A new role for the glycocalyx. American journal of physiology. Lung cellular and molecular physiology. 2003;285:L986–995. doi: 10.1152/ajplung.00022.2003. [DOI] [PubMed] [Google Scholar]
- 22.Scully MF, Ellis V, Kakkar VV. Heparan sulphate with no affinity for antithrombin iii and the control of haemostasis. FEBS letters. 1988;241:11–14. doi: 10.1016/0014-5793(88)81020-2. [DOI] [PubMed] [Google Scholar]
- 23.van Golen RF, Reiniers MJ, Vrisekoop N, Zuurbier CJ, Olthof PB, van Rheenen J, van Gulik TM, Parsons BJ, Heger M. The mechanisms and physiological relevance of glycocalyx degradation in hepatic ischemia/reperfusion injury. Antioxidants & redox signaling. 2014;21:1098–1118. doi: 10.1089/ars.2013.5751. [DOI] [PMC free article] [PubMed] [Google Scholar]
- 24.Lipowsky HH. Protease activity and the role of the endothelial glycocalyx in inflammation. Drug discovery today. Disease models. 2011;8:57–62. doi: 10.1016/j.ddmod.2011.05.004. [DOI] [PMC free article] [PubMed] [Google Scholar]
- 25.Ofosu FA, Modi GJ, Blajchman MA, Buchanan MR, Johnson EA. Increased sulphation improves the anticoagulant activities of heparan sulphate and dermatan sulphate. The Biochemical journal. 1987;248:889–896. doi: 10.1042/bj2480889. [DOI] [PMC free article] [PubMed] [Google Scholar]
- 26.Bar RS, Dake BL, Spanheimer RG. Sulfated glycosaminoglycans in cultured endothelial cells from capillaries and large vessels of human and bovine origin. Atherosclerosis. 1985;56:11–26. doi: 10.1016/0021-9150(85)90080-2. [DOI] [PubMed] [Google Scholar]
Associated Data
This section collects any data citations, data availability statements, or supplementary materials included in this article.


