Abstract
Purpose
To propose an MR-based method for generating continuous-valued head attenuation maps and to assess its accuracy and reproducibility. Demonstrating that novel MR-based photon attenuation correction (AC) methods are both accurate and reproducible is essential prior to using them routinely in research and clinical studies on integrated PET/MR scanners.
Methods
Continuous-valued linear attenuation coefficient (LAC) maps (“μ-maps”) were generated by combining atlases that provided the prior probability of voxel positions belonging to a certain tissue class (air, soft tissue, or bone) and an MR intensity-based likelihood classifier to produce posterior probability maps of tissue classes. These probabilities were used as weights to generate the μ-maps. The accuracy of this probabilistic atlas-based continuous-valued μ-map (“PAC-map”) generation method was assessed by calculating the voxel-wise absolute relative change (RC) between the MR- and scaled CT-based attenuation corrected PET images. To assess reproducibility, we performed pair-wise comparisons of the RC values obtained from the PET images reconstructed using the μ-maps generated from the data acquired at three time points.
Results
The proposed method produced continuous-valued μ-maps that qualitatively reflected the variable anatomy in brain tumor patients and agreed well with the scaled CT-based μ-maps. The absolute RC comparing the resulting PET volumes was 1.76±2.33%, quantitatively demonstrating that the method is accurate. Additionally, we also showed that is highly reproducible, the mean RC value for the PET images reconstructed using the μ-maps obtained at the three visits being 0.65±0.95%.
Conclusion
Accurate and highly reproducible continuous-valued head μ-maps can be generated from the MR data using a probabilistic atlas-based approach.
Keywords: attenuation correction, reproducibility, PET/MR, probabilistic atlas
Graphical Abstract
Introduction
Recently, there has been growing interest in the development and application of integrated PET/MR scanners. The ability to simultaneously acquire MR and PET data could particularly benefit brain imaging studies [1–3]. However, to accurately quantify PET radiotracer activity, a method to derive subject-specific voxel-wise linear attenuation coefficient (LAC) maps (“μ-maps”) is needed to perform precise 511 keV photon attenuation correction (AC). The limited physical space inside integrated PET/MR scanners, the need to reduce the acquisition time and radiation exposure make the implementation and routine use of a standard AC method that employs a transmission source extremely difficult [1] and alternative strategies are needed for deriving μ-maps from the MR data. This is a challenging task because the MR images do not reflect the tissue electron density needed for this purpose. The current MR-based μ-map generation methods can be divided into three main classes: segmentation-, atlas- and machine learning-based methods [4, 5], each with its advantages and disadvantages. For example, while segmentation- and machine learning-based methods provide algorithms for mapping MR intensities to LACs, enabling the μ-map produced to account for variability in the local anatomy, the heterogeneity of MR signal intensities both within the image and across scanners can lead to inaccuracies in the μ-map generation and difficulties in the generalization of the method to multiple institutions [6–11]. Segmentation approaches in which a discrete number of LACs are assigned to only a few classes cannot accurately reflect the variable attenuating properties of human tissue, especially at the boundaries between these classes [4, 12, 13]; the accuracy of these methods may also be dependent on the accuracy of the MR pulse sequences used [14]. Atlas-based methods, on the other hand, coupled with an accurate registration method, can warp a predefined atlas, such as that constructed from “gold standard” CT images, to each individual subject [5]. In this case, however, the main drawback is the inability of the atlas to account for local anatomical variations in each subject, such as those encountered in patients who underwent neurosurgery [4].
We have previously implemented two MR-based μ-map estimation methods using either dual-echo ultrashort echo time (UTE) images alone or in combination with the magnetization-prepared rapid acquisition gradient-echo (MPRAGE) morphological MR images to segment the most relevant classes (i.e. bone, soft tissue, and air cavities) [6, 7]. μ-maps were generated from these segmented images by assigning known LACs to each voxel class. These μ-maps were shown to agree well with those generated by performing a segmentation of the corresponding CT images–the “silver standard” approach [6, 7]. However, bias was still present in the PET images reconstructed using these segmented maps compared to those obtained using the “gold standard”–the scaled CT approach [6]. Moreover, for μ-maps to be generated reliably, a method must not only be accurate but also reproducible. In other words, very similar μ-maps should be obtained from different datasets acquired from the same subject in the absence of anatomy-modifying physiological or pathological changes or surgical interventions.
Our first goal in this work was to improve the accuracy of the previously proposed method [7] by extending it to generate probabilistic atlas-based continuous-valued μ-maps (“PAC-maps”) using both atlas registration and a trained probabilistic classifier that incorporates local anatomical information. By combining the strengths of both segmentation- and atlas-based methods, an MR-based μ-map that agrees well with the “gold standard” and accounts for the subject-specific anatomical variability could be obtained [15]. The second goal of this work was to assess the reproducibility of the PAC-map generation method. To the best of our knowledge, there have been no previous reports that specifically addressed reproducibility of head MR-based μ-map estimation methods and other reproducibility studies only focused on other body regions (e.g. carotids [16]). We investigated the reproducibility by comparing the μ-maps produced from MR data acquired at different time points and the PET images reconstructed using attenuation correction factors derived from these μ-maps.
Methods
Data Acquisition
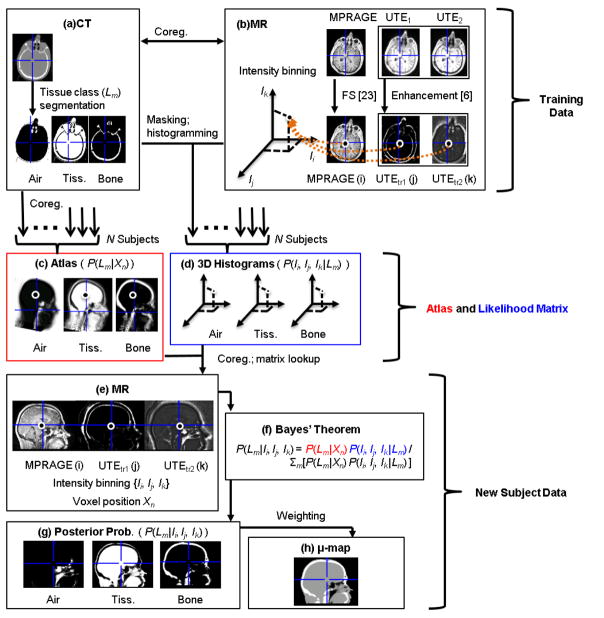
The pipeline for generating the atlas and the μ-map is shown in Figure 1. Simultaneously acquired PET/MR data and separately acquired head-only CT data from 13 glioblastoma patients were retrospectively used in this work for the construction of the probabilistic atlas and classifier and for evaluating the accuracy of the PAC-map generation method. There was substantial variability in tumor size (from 1 to 7 cm along the longest axis) and location, as well as intra- and intersubject heterogeneity in the MR images. One subject was removed from this study during method evaluation due to MR and PET data mismatch. The reproducibility of the PAC-map method was investigated using data from 9 of these subjects who underwent PET/MR examinations at three time points. The study was approved by the local Institutional Review Board. The imaging data acquisition protocols were described in detail in [7]. Briefly, the CT data were acquired using a LightSpeed QX/I scanner (GE Healthcare) with the following protocol: 140 kVp, 150 mAs, 512×512 in-plane voxels (0.492×0.492 mm2 to 0.668×0.668 mm2), 87–104 2.5 mm2 slices, performed within one month from the first PET/MR scan [7]. To prevent erroneous tissue class classification during atlas training (which is a possibility when anatomical mismatches between the MR and CT are present) no patients who underwent surgical procedures that altered the anatomy of the head between the two exams were enrolled. Similarly, no surgical procedures were performed between the three PET/MR visits. MR and PET data were acquired simultaneously on a MAGNETOM Trio3 Tesla human MRI scanner (Siemens Healthcare Inc.) with a prototype brain PET scanner insert (“BrainPET”). The BrainPET has a transaxial/axial view of 32/19.25 cm, allowing for full brain coverage in a single bed position [17]. Dual-echo UTE and T1-weighted MPRAGE MR data (256 slices with 256×256 voxels, 1 mm3 isotropic) were collected for each subject. PET data acquisition in list-mode format was started shortly before administration of ~180 MBq of [18F]fluorodeoxyglucose (FDG), sorted and compressed axially in the sinogram space for fast reconstruction [18]. 20-minute static frames (40–60 minutes after injection) were reconstructed using an ordered-subsets expectation maximization (OSEM) algorithm and corrected for random coincidences [19], detector sensitivity, scatter [20], and attenuation to obtain a final volume of 153 slices with 256×256 voxels, 1.25×1.25×1.25 mm3 isotropic. All subsequent analyses for accuracy and reproducibility were performed in the PET space.
Fig 1.
A comprehensive figure of the μ-map generation pipeline. In addition to the mathematical variables provided on the figure, an explanation of the acronyms and abbreviations used are listed below: MR images: MPRAGE (magnetization-prepared rapid acquisition gradient-echo), UTE (ultrashort echo time), UTEtr (intensity-transformed UTE); FS (FreeSurfer normalization); MNI (Montreal Neurological Institute); coreg. (co-registration)
Probabilistic Atlas and Classifier Construction
Constructing the atlas followed the approach described in [7]. Briefly, using the FMRIB Software Library program (FSL, Oxford Centre for Functional MRI of the Brain, [21, 22]), the CT images were rigidly registered (6 degrees of freedom, cost function: mutual information) to each subject’s intensity-normalized (FreeSurfer [23]) MPRAGE images. Next, the MPRAGE and dual-echo UTE MR images were registered (12 degrees of freedom, cost function: normalized correlation ratio) to the MNI152T1 atlas [24] and the same co-registration parameters were applied to the CT. Linear interpolation was the method of choice for reslicing all anatomical MR and CT images after co-registration. The registered CT images were then segmented into three distinct tissue classes (soft tissue, bone, and air; Fig. 1a) and the data from all the subjects were combined to generate three probabilistic tissue class atlases. These atlases, when co-registered to the MPRAGE of a new subject, would provide probabilistic a priori information of the tissue class (Lm) segmentation at a given voxel Xn in the form of P(Lm|Xn) = k/N, where k is the number of occurrences of the tissue class and N is the total number of subjects in the training atlas (Fig. 1c). To construct the likelihood matrices for each tissue class, the MR images (MPRAGE and two dual-echo UTE images transformed as described in [6], Fig. 1b) of each subject were masked by the corresponding CT segmentation and the MR intensity triplets for each voxel were histogrammed to form a 3D histogram. The histograms were aggregated across all subjects to give the probability P(Ii, Ij, Ik| Lm) that a voxel belonging to a certain tissue class Lm would belong to a certain histogram bin {Ii, Ij, Ik}, where i, j, and k represent the three MR images described previously (Fig. 1d). A “leave-one-out” framework was used to construct thirteen separate atlases such that none of the subjects was used simultaneously as a test subject and training data set.
Attenuation Map Generation
For each test subject, the dual-echo UTE images were first registered to the MPRAGE using SPM8 [25] with a 12 degrees of freedom transformation and then combined (as described in [6]) to enhance signal from bone and air respectively (Fig. 1e). The constructed atlas was also registered with SPM8 to the subject’s MPRAGE. The posterior probabilities of each tissue class at each voxel were then generated through a Bayesian combination of a priori atlas information P(Lm| Xn) and the likelihoods of MR image intensities belonging to a certain tissue class P(Ii, Ij, Ik| Lm)(Fig. 1f):
The posterior probabilities P(Lm| Ii, Ij, Ik) (Fig. 1g) obtained were weighted with the empirically derived LACs of 0, 0.0973 and 0.1593cm−1 (the nonzero values were the mean LACs obtained from the segmentation of the training data scaled-CT maps) for air, soft tissue, and bone, respectively, to obtain the continuous-valued LAC values inside a subject-specific MPRAGE-derived head mask (Fig. 1h). Voxels outside the head mask were assigned a LAC of 0.
Scaled CT-based μ-maps were obtained from each subject’s CT data by scaling the Hounsfield Units in the CT images according to the bilinear approach described in [26]. These maps were the “gold standard” for assessing the accuracy of the PAC-map generation method.
Evaluation of the Accuracy of the PAC-map Generation Method
We investigated the bias in PET data quantification by comparing the PET images reconstructed using the μ-maps obtained using the PAC-map method and the scaled CT approach. The radiofrequency coil μ-map (derived from a CT scan of the coil), stationary in the PET field of view, was added to the head μ-map to produce the final μ-map for a subject, which was then smoothed with a Gaussian kernel (4 mm full width at half maximum) to match the BrainPET scanner’s spatial resolution. The smoothed μ-map was forward projected and exponentiated to generate the attenuation correction factors sinogram. To assess the accuracy of the reconstructed PET images, the relative changes (RC) for all brain voxels were calculated using the equation RC=100×(PETMR–PETCT)/PETCT, where PETCT and PETMR denote the values from the PET images reconstructed using scaled CT μ-maps and PAC-maps, respectively, for AC. The mean and standard deviation of the absolute RC values in the brain voxels represented the bias and variability used to evaluate the proposed method. Bland-Altman plots comparing PETMR and PETCT values, converted to standard uptake values (SUVs), for all brain voxels were also generated. The regional accuracy of the proposed method was also evaluated in 10 brain regions of interest defined using an automated anatomical labeling (AAL)-based atlas [27] and warped using the diffeomorphic anatomical registration through exponentiated Lie algebra (DARTEL) method in SPM8 [28] to each individual patient and resliced with a nearest-neighbor scheme.
Evaluation of the Reproducibility of the PAC-map Generation Method
Data from patients who underwent three PET/MR scans within a 10-day period (N=9) were used for assessing the reproducibility of the proposed method. The PET emission data acquired at the first visit were reconstructed three times, in each case using a μ-map generated from the co-registered data acquired at a different visit (the resulting PET images were denoted PETMR1, PETMR2, and PETMR3). Absolute RC values and Bland-Altman plots (PETMR1, PETMR2, and PETMR3 values converted to SUVs) were calculated and plotted for the pair-wise comparisons between brain voxels from the first and second, first and third, and second and third visits.
Voxel-wise paired t-testing was carried out on each of the pair-wise comparisons using the SPM8 software. PET emission volumes were first warped into MNI space and smoothed using a 10×10×10 mm3 Gaussian kernel. We chose a more stringent p < 0.001, uncorrected for multiple comparisons, as the threshold for this test. Clusters were identified if the voxel number k > 5.
In addition, the overall accuracy of the PET images was quantified for all brain voxels for each patient visit by calculating the RC values between each of the resulting PET images (PETMR1, PETMR2, and PETMR3) and PETCT. For all three comparisons, the mean and standard deviation for absolute RC values in the brain voxels of each subject were computed.
Results
Accuracy of the PAC-map Generation Method
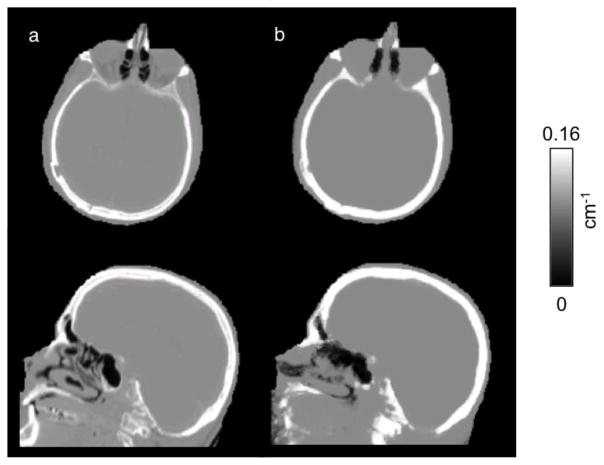
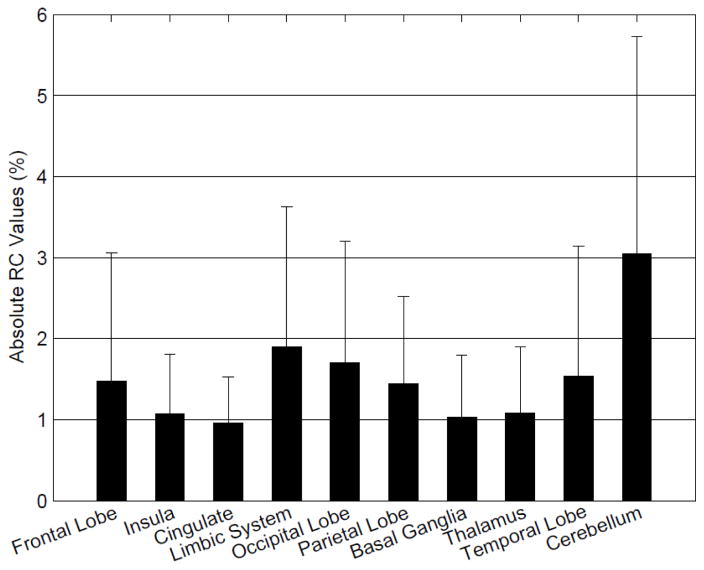
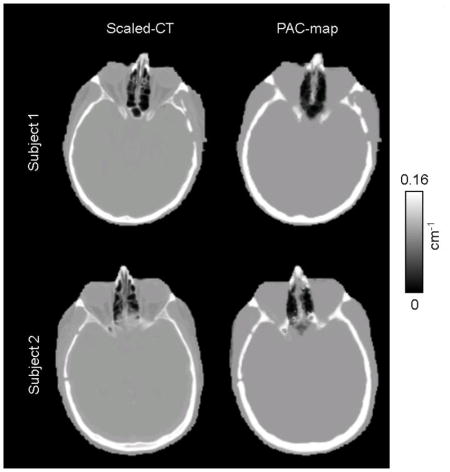
The CT-based μ-maps and PAC-maps for a representative subject are shown in Figure 2 (and transverse slices of the μ-maps for two additional subjects are provided in the Supplementary Data). The PET images reconstructed using the two methods for the same representative subject are shown in the two left panels of Figure 3 and the RC map is shown in the right panel. The effect of the linear combination of posterior probabilities was most evident in voxels near the sinus (a region with a mixture of multiple tissue types and varying attenuating properties), where the LACs assigned were between the values corresponding to air and soft tissue. Across all subjects, the bias and variability were on average 1.76% and 2.33%, respectively. For the specific subject shown in Figure 3, the bias and variability were 1.38% and 1.44%. The Bland-Altman plot for the voxel-based analyses comparing the PET activity reconstructed with the proposed method and the scaled-CT method are shown in Figure 4. The RC values for voxels in each of the 10 brain regions of interest are shown in Figure 5. Relatively greater RC bias and variability were observed in smaller cortical regions or those closer to regions with complex tissue composition, such as the base of the skull or sinus regions.
Fig 2.
Representative μ-maps, in the sagittal and transverse orientations, derived from the scaled CT method (a) and the PAC-map generation method (b)
Fig 3.
Representative PET images reconstructed with AC μ-maps derived from the scaled-CT method (PETCT, a) and the PAC-map generation method (PETMR, b). The corresponding RC map between the two PET reconstructions is shown in (c)
Fig 4.
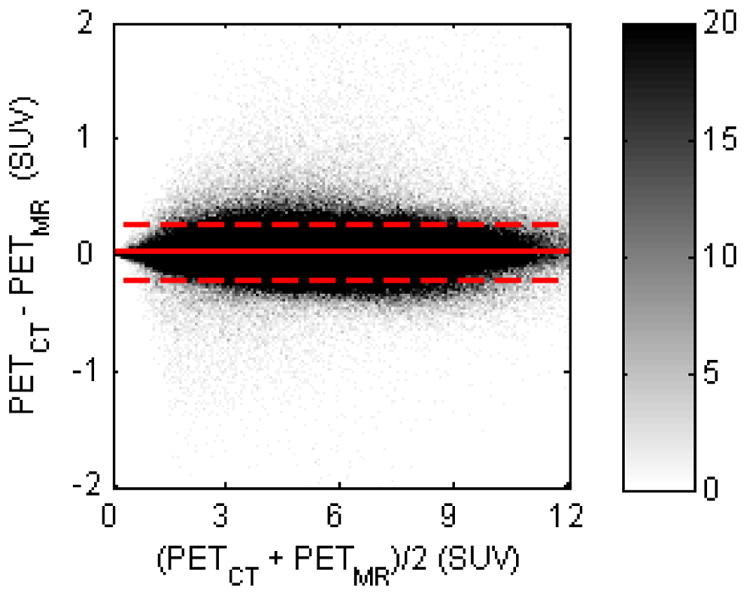
Bland-Altman plot for comparison between PETCT and PETMR (in SUVs) of all brain voxels for all subjects. The difference and average of all voxels were calculated and sorted into a histogram; the color bar shows the density of voxels in each histogram bin. The dashed line indicates the 2σ limit
Fig 5.
Mean absolute RC values between PETCT and PETMR in different regions of the brain
Reproducibility of the PAC-map Generation Method
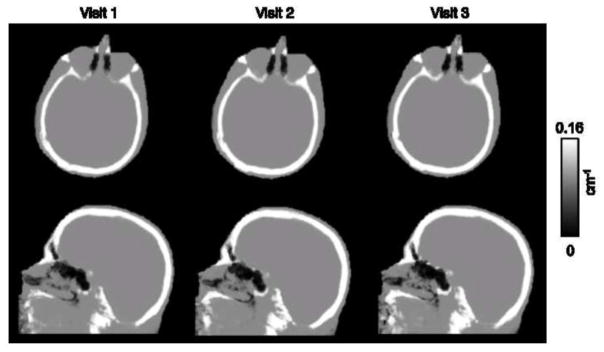
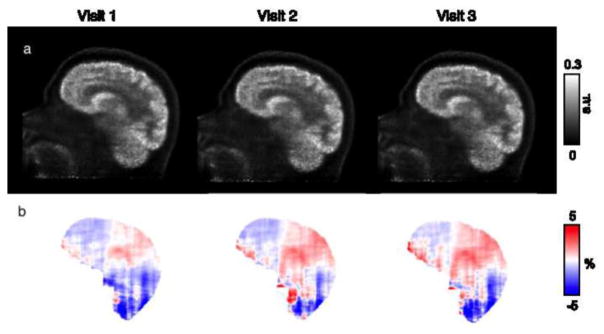
Representative PAC-maps for three visits of one subject are shown in Figure 6, while the PET reconstructions and the corresponding RC maps are shown in Figure 7. The μ-maps from the three visits showed good overall agreement. The sinus region, an area with complex tissue class composition, as well as the skull anatomical abnormalities, were also in agreement across visits. PET reconstructions from the three visits also showed similar RCs, with higher values in the cerebellar and inferior cortical regions of the brain consistently across visits. For each of the three visits, the mean bias and variability were 1.73% ± 2.29%, 1.88% ± 2.41%, and 1.66% ± 2.22% for the nine subjects analyzed. For the particular subject shown in Figures 6 and 7, the values were 1.38% ± 1.44%, 1.25% ± 1.30%, and 1.44% ± 1.49%.
Fig 6.
Representative μ-maps, in the sagittal and transverse orientations, derived from the PAC-map generation method. The μ-maps are from the same subject but with MR data collected from separate visits, in chronological order from left to right. All three visits are used jointly for assessment of the reproducibility of the method
Fig 7.
(a) PET reconstructions of the same subject data in three different visits, in chronological order from left to right, with AC from μ-maps using the PAC-map generation method; (b) the corresponding RC maps between reconstructions using the proposed method and the “gold standard” scaled-CT method
The RC maps of the pair-wise comparisons between the three MR-based PET reconstructions are shown in Figure 8. All the RC maps in Figure 8 showed lower absolute values than the maps shown in Figure 7. Across all subjects, the mean absolute RC for the pair-wise comparisons was 0.65% ± 0.95%. For the particular subject shown in Figure 6, the values were 0.71% ± 0.69%. The Bland-Altman plots for the voxel-based analyses in all three pair-wise comparisons are also shown in Figure 9, with no obvious skew towards the upper or lower portion of the plot. From the voxel-wise paired t-tests, only two clusters in the cerebellar region exceeded the threshold (p < 0.001 uncorrected) when comparing visits 1 and 3; no other significantly different clusters were identified for other pair-wise comparisons.
Fig 8.
RC of pair-wise PET reconstruction comparisons for the same representative subject
Fig 9.
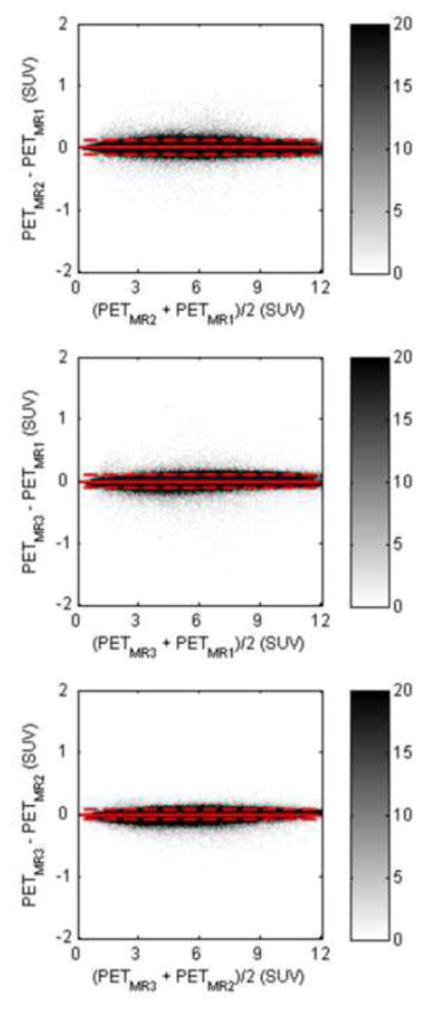
Bland-Altman plots for pair-wise comparisons of PET reconstructions (PETMR1, PETMR2, PETMR3) (in SUVs) of all brain voxels for all subjects, where the MR data were obtained from three different visits. The dashed line indicates the 2σ limit
Discussion
In this work, we proposed the PAC-map generation method and assessed its accuracy and reproducibility. Unlike pure atlas-based methods [4], the novel procedure incorporated elements from both atlas- and segmentation-based methods, a combination of features that yielded a method robust to local anatomical anomalies. In our previous work [7], we used this probabilistic atlas-based approach to produce segmented μ-maps and have shown that these agreed well with the segmented CT μ-maps. The PAC-map generation method on the other hand has the potential to produce results comparable to the “gold standard” scaled CT method. The μ-maps generated with the proposed method and the corresponding PET reconstructions have shown overall agreement with those obtained using the gold standard (Figure 3); in particular, while atlas-based methods such as [8, 29] may base LAC assignment heavily on the anatomical information of the atlas and rely on accurate registration to the subject, with the addition of MR intensity-based likelihood matrices that are independent of the subjects’ anatomy and the physiology, the μ-maps generated here demonstrated the ability of the method to account for local anatomical variation, as evidenced by anatomical irregularities (i.e., subject-specific anatomy not exhibited in the atlas) shown in the representative subject of Figure 2. The sinus regions, with a mix of different tissue types, were also accurately represented. The voxel-based analysis of the RC in brain regions also supported this observation, showing bias and variability within 5% and even lower values for most of the cerebrum.
Pure machine learning-based methods, such as those employing Gaussian mixture models [9, 10] or support vector machines [11] are difficult to generalize to different scanners due to variability in MR image intensities. In contrast, the proposed method could relatively easily be applied to data acquired on different scanners. In spite of the MR signal intensity variability between different scanners, customized atlases and likelihood matrices could be constructed from these data to produce continuous μ-maps specifically for each scanner. Moreover, this customizability also allows for more flexibility in terms of tissue class selection, or even pulse sequence substitution (such as using zero-echo-time sequences [30] instead of dual-echo UTE). As shown in this work, continuous-valued μ-maps are generated from a hybrid segmentation and atlas-based method using a three-tissue class CT-based segmentation, avoiding reliance on either MR intensity-derived information or atlas prior probabilities alone.
We then investigated the reproducibility of the PAC-map generation method by qualitatively assessing the μ-maps and PET images generated at different time points. The μ-maps from the three visits agreed with each other upon visual inspection (Figure 6). Similarly, the PETMR images shown in Figure 7 (top row) were similar to the PETCT ones shown in Figure 3. Quantitatively, the RC maps shown in Figure 7 (bottom row) also suggest similar RC patterns in the PETMR data across visits. Minimal bias was observed in the RC maps from comparisons between PETCT and each of the three PETMR values and even lower bias was observed for those calculated from pair-wise comparisons of the three PETMR reconstructions of each subject. The overall voxel-wise agreement between the three visits could also be appreciated from the Bland-Altman plots. Comparing Figures 4 and 9, it is evident that the distribution of the differences between the pair-wise PETMR values is narrower than that of the differences between the PETCT and PETMR voxels, attesting to the reproducibility of the method. The paired t-tests for the pair-wise comparisons of the PET reconstructions showed no significant differences at p < 0.001, uncorrected, aside from the two cerebellar clusters identified in one comparison. Although we focused on investigating the impact of PAC-maps on the static PET reconstructions (similar to those routinely used clinically), their influence on the parametric images generated from the dynamic data is likely more complex and warrants further investigation.
In principle, the proposed μ-map generation method could be extended to other body regions. One obvious challenge is obtaining good quality MR data over a larger field of view using dual-echo UTE sequences. Additionally, the co-registration task is more challenging because of the higher intersubject variability in organ and body shape and size. To address this issue, either more accurate co-registration methods or patch-based methods [31] could be used.
One limitation of the current implementation is that it is challenging to accurately characterize all the tissue types for atlas and likelihood matrix generation. For example, in the probabilistic three-tissue compartment segmented atlas used in this work, bone marrow was classified together with cortical bone although it has different attenuating properties. However, similar to other methods that use more than three tissue classes for segmentation [12, 32], the atlas generation method could also be modified to allow for a larger number of tissue classes and to select different Hounsfield Unit cutoffs for various tissue classes. For example, although μ-maps generated using atlases composed of five tissue classes demonstrated promising results (data not shown), one goal of this work was to assess the feasibility of generating continuous-valued μ-maps from the combination of segmentation and atlas-based approaches and thus, similar to other works that evaluate the effect of tissue class selection [33, 34], further studies are needed to assess the optimal combination. Selection of proper LAC values to weigh the posterior probabilities can also factor in obtaining the optimal combination for μ-map generation. We have tried to assess the accuracy of μ-maps generated with varying bone and soft tissue LAC weights but observed only marginal improvement in accuracy compared to the current LAC selection (data not shown).
Another limitation of the proposed method is in the way regions with complex tissue composition are represented. As shown in Figure 5, regions adjacent to the base of the skull or sinuses have in general higher bias and variability than other regions. The optimal combination suggested above could further improve the accuracy of the proposed method, reducing RC bias and variability compared to those reported using the current combination.
Finally, the limited number of data sets used to generate the atlas and likelihood matrix could affect the reliability of the method, as the a priori information on which the tissue class posterior probabilities are derived from highly depends on the training data anatomy.
Conclusion
In integrated PET/MRI scanners, an accurate and reproducible MR-based method to generate μ-maps similar to those obtained using the “gold standard” is needed for quantitative PET studies. Here, we introduced a continuous-valued μ-map generation method to extend our previous work in which a μ-map with a limited number of discrete tissue classes was proposed. This probabilistic atlas-based approach combines the strengths of voxel-based segmentation methods and atlas-based methods to account for local anatomical variability. This μ-map generation method was shown to be within 2% accurate compared to the CT-based method and reproducible within 1%.
Supplementary Material
Acknowledgments
Funding: This work was funded by NIH grant 1R01EB014894-01A1 and by the U.S. Department of Defense (DoD) through the National Defense Science & Engineering Graduate Fellowship (NDSEG) Program.
Footnotes
Conflict of Interest: The authors declare that they have no conflict of interest.
Ethical approval: All procedures performed in studies involving human participants were in accordance with the ethical standards of the institutional and/or national research committee and with the 1964 Helsinki declaration and its later amendments or comparable ethical standards.
References
- 1.Herzog H, Pietrzyk U, Shah NJ, Ziemons K. The current state, challenges and perspectives of MR-PET. Neuroimage. 2010;49:2072–82. doi: 10.1016/j.neuroimage.2009.10.036. S1053-8119(09)01107-0 [pii]. [DOI] [PubMed] [Google Scholar]
- 2.Catana C, Drzezga A, Heiss WD, Rosen BR. PET/MRI for Neurologic Applications. Journal of Nuclear Medicine. 2012;53:1916–25. doi: 10.2967/jnumed.112.105346. [DOI] [PMC free article] [PubMed] [Google Scholar]
- 3.Catana C, Guimaraes AR, Rosen BR. PET and MR imaging: the odd couple or a match made in heaven? J Nucl Med. 2013;54:815–24. doi: 10.2967/jnumed.112.112771jnumed.112.112771. [pii]. [DOI] [PMC free article] [PubMed] [Google Scholar]
- 4.Bezrukov I, Mantlik F, Schmidt H, Scholkopf B, Pichler BJ. MR-Based PET attenuation correction for PET/MR imaging. Semin Nucl Med. 2013;43:45–59. doi: 10.1053/j.semnuclmed.2012.08.002. S0001-2998(12)00078-5 [pii]. [DOI] [PubMed] [Google Scholar]
- 5.Hofmann M, Pichler B, Scholkopf B, Beyer T. Towards quantitative PET/MRI: a review of MR-based attenuation correction techniques. Eur J Nucl Med Mol Imaging. 2009;36(Suppl 1):S93–104. doi: 10.1007/s00259-008-1007-7. [DOI] [PubMed] [Google Scholar]
- 6.Catana C, van der Kouwe A, Benner T, Michel CJ, Hamm M, Fenchel M, et al. Toward implementing an MRI-based PET attenuation-correction method for neurologic studies on the MR-PET brain prototype. Journal of Nuclear Medicine. 2010;51:1431–8. doi: 10.2967/jnumed.109.069112. 51/9/1431 [pii] [DOI] [PMC free article] [PubMed] [Google Scholar]
- 7.Poynton CB, Chen KT, Chonde DB, Izquierdo-Garcia D, Gollub RL, Gerstner ER, et al. Probabilistic atlas-based segmentation of combined T1-weighted and DUTE MRI for calculation of head attenuation maps in integrated PET/MRI scanners. Am J Nucl Med Mol Imaging. 2014;4:160–71. [PMC free article] [PubMed] [Google Scholar]
- 8.Hofmann M, Steinke F, Scheel V, Charpiat G, Farquhar J, Aschoff P, et al. MRI-based attenuation correction for PET/MRI: a novel approach combining pattern recognition and atlas registration. Journal of Nuclear Medicine. 2008;49:1875–83. doi: 10.2967/jnumed.107.049353. jnumed.107.049353 [pii]. [DOI] [PubMed] [Google Scholar]
- 9.Johansson A, Karlsson M, Nyholm T. CT substitute derived from MRI sequences with ultrashort echo time. Medical Physics. 2011;38:2708–14. doi: 10.1118/1.3578928. [DOI] [PubMed] [Google Scholar]
- 10.Larsson A, Johansson A, Axelsson J, Nyholm T, Asklund T, Riklund K, et al. Evaluation of an attenuation correction method for PET/MR imaging of the head based on substitute CT images. MAGMA. 2013;26:127–36. doi: 10.1007/s10334-012-0339-2. [DOI] [PubMed] [Google Scholar]
- 11.Navalpakkam BK, Braun H, Kuwert T, Quick HH. Magnetic resonance-based attenuation correction for PET/MR hybrid imaging using continuous valued attenuation maps. Invest Radiol. 2013;48:323–32. doi: 10.1097/RLI.0b013e318283292f. [DOI] [PubMed] [Google Scholar]
- 12.Berker Y, Franke J, Salomon A, Palmowski M, Donker HC, Temur Y, et al. MRI-based attenuation correction for hybrid PET/MRI systems: a 4-class tissue segmentation technique using a combined ultrashort-echo-time/Dixon MRI sequence. J Nucl Med. 2012;53:796–804. doi: 10.2967/jnumed.111.092577. jnumed.111.092577 [pii]. [DOI] [PubMed] [Google Scholar]
- 13.Keereman V, Fierens Y, Broux T, De Deene Y, Lonneux M, Vandenberghe S. MRI-based attenuation correction for PET/MRI using ultrashort echo time sequences. J Nucl Med. 2010;51:812–8. doi: 10.2967/jnumed.109.065425. 51/5/812 [pii]. [DOI] [PubMed] [Google Scholar]
- 14.Ladefoged CN, Benoit D, Law I, Holm S, Kjaer A, Hojgaard L, et al. Region specific optimization of continuous linear attenuation coefficients based on UTE (RESOLUTE): application to PET/MR brain imaging. Phys Med Biol. 2015;60:8047–65. doi: 10.1088/0031-9155/60/20/8047. [DOI] [PubMed] [Google Scholar]
- 15.Izquierdo-Garcia D, Hansen AE, Forster S, Benoit D, Schachoff S, Furst S, et al. An SPM8-Based Approach for Attenuation Correction Combining Segmentation and Nonrigid Template Formation: Application to Simultaneous PET/MR Brain Imaging. J Nucl Med. 2014 doi: 10.2967/jnumed.113.136341. jnumed.113.136341 [pii] [DOI] [PMC free article] [PubMed] [Google Scholar]
- 16.Bini J, Robson PM, Calcagno C, Eldib M, Fayad ZA. Quantitative carotid PET/MR imaging: clinical evaluation of MR-Attenuation correction versus CT-Attenuation correction in (18)F-FDG PET/MR emission data and comparison to PET/CT. Am J Nucl Med Mol Imaging. 2015;5:293–304. [PMC free article] [PubMed] [Google Scholar]
- 17.Schlemmer HP, Pichler BJ, Schmand M, Burbar Z, Michel C, Ladebeck R, et al. Simultaneous MR/PET imaging of the human brain: feasibility study. Radiology. 2008;248:1028–35. doi: 10.1148/radiol.2483071927. 248/3/1028 [pii]. [DOI] [PubMed] [Google Scholar]
- 18.Hong IK, Chung ST, Kim HK, Kim YB, Son YD, Cho ZH. Ultra fast symmetry and SIMD-based projection-backprojection (SSP) algorithm for 3-D PET image reconstruction. IEEE Trans Med Imaging. 2007;26:789–803. doi: 10.1109/TMI.2002.808360. [DOI] [PubMed] [Google Scholar]
- 19.Byars LG, Sibomana M, Burbar Z, Jones J, Panin V, Barker WC, et al. Variance reduction on randoms from delayed coincidence histograms for the HRRT. Ieee Nucl Sci Conf R. 2005:2622–6. [Google Scholar]
- 20.Watson CC. New, faster, image-based scatter correction for 3D PET. Ieee T Nucl Sci. 2000;47:1587–94. doi: 10.1109/23.873020. [DOI] [Google Scholar]
- 21.Jenkinson M, Smith S. A global optimisation method for robust affine registration of brain images. Med Image Anal. 2001;5:143–56. doi: 10.1016/s1361-8415(01)00036-6. S1361841501000366 [pii]. [DOI] [PubMed] [Google Scholar]
- 22.Smith SM, Jenkinson M, Woolrich MW, Beckmann CF, Behrens TE, Johansen-Berg H, et al. Advances in functional and structural MR image analysis and implementation as FSL. Neuroimage. 2004;23(Suppl 1):S208–19. doi: 10.1016/j.neuroimage.2004.07.051. S1053-8119(04)00393-3 [pii] [DOI] [PubMed] [Google Scholar]
- 23.Dale AM, Fischl B, Sereno MI. Cortical surface-based analysis - I. Segmentation and surface reconstruction. Neuroimage. 1999;9:179–94. doi: 10.1006/nimg.1998.0395. [DOI] [PubMed] [Google Scholar]
- 24.Fonov V, Evans AC, Botteron K, Almli CR, McKinstry RC, Collins DL. Unbiased average age-appropriate atlases for pediatric studies. Neuroimage. 2011;54:313–27. doi: 10.1016/j.neuroimage.2010.07.033. S1053-8119(10)01006-2 [pii]. [DOI] [PMC free article] [PubMed] [Google Scholar]
- 25.Ashburner J, Friston K. Spatial transformation of images. In: Frackowiak RSJ, Friston K, Frith CD, Dolan RJ, Mazziotta JC, editors. Human Brain Function. Academic Press; USA: 1997. pp. 43–58. [Google Scholar]
- 26.Burger C, Goerres G, Schoenes S, Buck A, Lonn AH, Von Schulthess GK. PET attenuation coefficients from CT images: experimental evaluation of the transformation of CT into PET 511-keV attenuation coefficients. Eur J Nucl Med Mol Imaging. 2002;29:922–7. doi: 10.1007/s00259-002-0796-3. [DOI] [PubMed] [Google Scholar]
- 27.Tzourio-Mazoyer N, Landeau B, Papathanassiou D, Crivello F, Etard O, Delcroix N, et al. Automated anatomical labeling of activations in SPM using a macroscopic anatomical parcellation of the MNI MRI single-subject brain. Neuroimage. 2002;15:273–89. doi: 10.1006/nimg.2001.0978. S1053811901909784 [pii]. [DOI] [PubMed] [Google Scholar]
- 28.Ashburner J. A fast diffeomorphic image registration algorithm. Neuroimage. 2007;38:95–113. doi: 10.1016/j.neuroimage.2007.07.007. S1053-8119(07)00584-8 [pii] [DOI] [PubMed] [Google Scholar]
- 29.Malone IB, Ansorge RE, Williams GB, Nestor PJ, Carpenter TA, Fryer TD. Attenuation correction methods suitable for brain imaging with a PET/MRI scanner: a comparison of tissue atlas and template attenuation map approaches. J Nucl Med. 2011;52:1142–9. doi: 10.2967/jnumed.110.085076. 52/7/1142 [pii]. [DOI] [PubMed] [Google Scholar]
- 30.Delso G, Wiesinger F, Sacolick LI, Kaushik SS, Shanbhag DD, Hullner M, et al. Clinical evaluation of zero-echo-time MR imaging for the segmentation of the skull. J Nucl Med. 2015;56:417–22. doi: 10.2967/jnumed.114.149997. jnumed.114.149997 [pii]. [DOI] [PubMed] [Google Scholar]
- 31.Torrado-Carvajal A, Herraiz JL, Alcain E, Montemayor AS, Garcia-Canamaque L, Hernandez-Tamames JA, et al. Fast Patch-Based Pseudo-CT Synthesis from T1-Weighted MR Images for PET/MR Attenuation Correction in Brain Studies. J Nucl Med. 2016;57:136–43. doi: 10.2967/jnumed.115.156299. jnumed.115.156299 [pii]. [DOI] [PubMed] [Google Scholar]
- 32.Fei BW, Yang XF, Nye JA, Aarsvold JN, Raghunath N, Cervo M, et al. MR/PET quantification tools: Registration, segmentation, classification, and MR-based attenuation correction. Medical Physics. 2012;39:6443–54. doi: 10.1118/1.4754796. [DOI] [PMC free article] [PubMed] [Google Scholar]
- 33.Akbarzadeh A, Ay MR, Ahmadian A, Alam NR, Zaidi H. MRI-guided attenuation correction in whole-body PET/MR: assessment of the effect of bone attenuation. Ann Nucl Med. 2013;27:152–62. doi: 10.1007/s12149-012-0667-3. [DOI] [PubMed] [Google Scholar]
- 34.Martinez-Moller A, Souvatzoglou M, Delso G, Bundschuh RA, Chefd’hotel C, Ziegler SI, et al. Tissue classification as a potential approach for attenuation correction in whole-body PET/MRI: evaluation with PET/CT data. J Nucl Med. 2009;50:520–6. doi: 10.2967/jnumed.108.054726. jnumed.108.054726 [pii]. [DOI] [PubMed] [Google Scholar]
Associated Data
This section collects any data citations, data availability statements, or supplementary materials included in this article.


