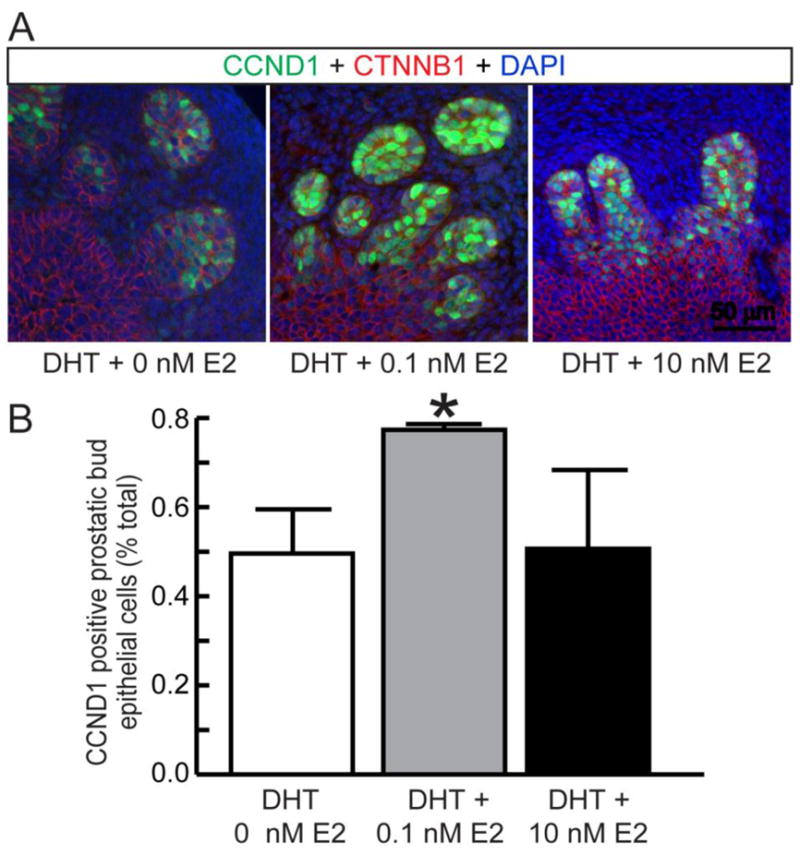
Figure 3. Low estrogen concentrations drive CCND1 expression in mouse UGS explants.

14 dpc male mouse UGS explants were grown for 4 days in media containing 5α-dihydrotestosterone (DHT, 10 nM) and vehicle (0.1% ethanol) or DHT and 17β-estradiol (E2, 0.1 nM, 10 nM). (A) 5 μm sections were immunofluorescently labeled to visualize CTNNB1 and CCND1 and cell nuclei were stained with DAPI. (B) The CCND1 immunolabeling index was determined as the number of CCND1 immunopositive prostatic bud epithelial cells divided by the number of visible prostatic bud epithelial bud cells. Results are the mean ± SE of at least three independent samples per group from at least three litters. Asterisks indicate significant differences between groups (p < 0.05).
