

Abstract
Key points
Kv2 channels underlie delayed‐rectifier potassium currents in various neurons, although their physiological roles often remain elusive. Almost nothing is known about Kv2 channel functions in medial entorhinal cortex (mEC) neurons, which are involved in representing space, memory formation, epilepsy and dementia.
Stellate cells in layer II of the mEC project to the hippocampus and are considered to be space‐representing grid cells. We used the new Kv2 blocker Guangxitoxin‐1E (GTx) to study Kv2 functions in these neurons.
Voltage clamp recordings from mEC stellate cells in rat brain slices showed that GTx inhibited delayed‐rectifier K+ current but not transient A‐type current.
In current clamp, GTx had multiple effects: (i) increasing excitability and bursting at moderate spike rates but reducing firing at high rates; (ii) enhancing after‐depolarizations; (iii) reducing the fast and medium after‐hyperpolarizations; (iv) broadening action potentials; and (v) reducing spike clustering.
GTx is a useful tool for studying Kv2 channels and their functions in neurons.
Abstract
The medial entorhinal cortex (mEC) is strongly involved in spatial navigation, memory, dementia and epilepsy. Although potassium channels shape neuronal activity, their roles in mEC are largely unknown. We used the new Kv2 blocker Guangxitoxin‐1E (GTx; 10–100 nm) in rat brain slices to investigate Kv2 channel functions in mEC layer II stellate cells (SCs). These neurons project to the hippocampus and are considered to be grid cells representing space. Voltage clamp recordings from SCs nucleated patches showed that GTx inhibited a delayed rectifier K+ current activating beyond –30 mV but not transient A‐type current. In current clamp, GTx (i) had almost no effect on the first action potential but markedly slowed repolarization of late spikes during repetitive firing; (ii) enhanced the after‐depolarization (ADP); (iii) reduced fast and medium after‐hyperpolarizations (AHPs); (iv) strongly enhanced burst firing and increased excitability at moderate spike rates but reduced spiking at high rates; and (v) reduced spike clustering and rebound potentials. The changes in bursting and excitability were related to the altered ADPs and AHPs. Kv2 channels strongly shape the activity of mEC SCs by affecting spike repolarization, after‐potentials, excitability and spike patterns. GTx is a useful tool and may serve to further clarify Kv2 channel functions in neurons. We conclude that Kv2 channels in mEC SCs are important determinants of intrinsic properties that allow these neurons to produce spatial representation. The results of the present study may also be important for the accurate modelling of grid cells.
Keywords: Kv2 channels, LII stellate cells, medial entorhinal cortex, neuronal excitability
Key points
Kv2 channels underlie delayed‐rectifier potassium currents in various neurons, although their physiological roles often remain elusive. Almost nothing is known about Kv2 channel functions in medial entorhinal cortex (mEC) neurons, which are involved in representing space, memory formation, epilepsy and dementia.
Stellate cells in layer II of the mEC project to the hippocampus and are considered to be space‐representing grid cells. We used the new Kv2 blocker Guangxitoxin‐1E (GTx) to study Kv2 functions in these neurons.
Voltage clamp recordings from mEC stellate cells in rat brain slices showed that GTx inhibited delayed‐rectifier K+ current but not transient A‐type current.
In current clamp, GTx had multiple effects: (i) increasing excitability and bursting at moderate spike rates but reducing firing at high rates; (ii) enhancing after‐depolarizations; (iii) reducing the fast and medium after‐hyperpolarizations; (iv) broadening action potentials; and (v) reducing spike clustering.
GTx is a useful tool for studying Kv2 channels and their functions in neurons.
Abbreviations
- ADP
after‐depolarization
- fAHP
fast after‐hyperpolarization
- Gmax
maximum conductance
- GTx
Guangxitoxin‐1E
- IA
transient A‐type current
- IK
delayed‐rectifier potassium current
- IM
M‐current
- ISI
interspike interval
- k
slope factor
- Kv
voltage‐gated potassium channels
- mAHP
medium after‐hyperpolarization
- mEC
medial entorhinal cortex
- SC
stellate cell
- RInput
input resistance
- V1/2
voltage for half‐maximum conductance
Introduction
The medial entorhinal cortex (mEC) is highly important for the representation of space, spatial navigation and memory formation (Buzsaki & Moser, 2013; Moser et al. 2014). This area is also strongly involved in dementia (Braak & Braak, 1991) and epilepsy (Schwarcz & Witter, 2002). Stellate cells (SCs) in layer II (LII) of mEC occupy a key position in the entorhinal‐hippocampal memory circuit because they receive information from all sensory modalities via diverse cortical areas (Burwell, 2000) and provide one of the main input pathways to the hippocampus: the perforant path (Tamamaki & Nojyo, 1993). The mEC LII SCs are also considered to constitute the largest population of grid cells that represents allocentric space in the mammalian brain (Hafting et al. 2005; Domnisoru et al. 2013; Schmidt‐Hieber & Hausser, 2013).
The SCs show distinct electrophysiological properties: prominent subthreshold membrane potential oscillations/fluctuations and resonance in the theta frequency range, spike clustering and triphasic postspike dynamics (Alonso & Llinas, 1989; Alonso & Klink R, 1993; Haas & White, 2002).
Previous research on SCs mainly focused on their integrative properties, which strongly depend on hyperpolarization‐activated cation channels (Dickson et al. 2000; Nolan et al. 2007; Giocomo & Hasselmo, 2008). Less is known about the functional roles of other ion channels in SCs (Pastoll et al. 2012). However, information about their intrinsic currents is important for the accurate modelling of grid cells and their functional properties (Pastoll et al. 2012).
Recently, it was shown that the M‐current (I M), as mediated by voltage‐gated (Kv) potassium channels of the Kv7/M type, controls excitability and spike frequency adaptation in SCs (Nigro et al. 2014), although the roles of several other Kv channel types are still unknown.
Among different types of potassium current, a transient A‐type current (I A) and a slowly inactivating delayed‐rectifier potassium current (I K) constitute most of the outward K+ current in SCs (Eder et al. 1991; Eder & Heinemann, 1996). The SCs exhibit a larger I K than pyramidal cells in the EC (Eder & Heinemann, 1994). Previous studies have shown that I K is largely encoded by Kv2 channels in a variety of neurons (Murakoshi & Trimmer, 1999; Malin & Nerbonne, 2002; Guan et al. 2007). I K activates and inactivates more slowly than I A encoded by Kv4 and Kv1 channels (Norris & Nerbonne, 2010), suggesting the different roles of these currents during repetitive firing. However, the functional role of different Kv‐mediated currents has remained unclear because of a lack of specific blockers.
Recently, Guangxitoxin‐1E (GTx), isolated from the chinese tarantula Plesiophrictus guangxiensis, was identified as a potent and selective blocker of Kv2.1 and 2.2 channels. Thus, GTx was found to inhibit Kv2 with an IC50 of 1–3 nm but had no significant effect on Kv1.2, Kv1.3, Kv1.5, Kv3.2 and BK potassium channels, nor on calcium and sodium channels Cav1.2, Cav2.2, Nav1.5, Nav1.7, Nav1.8, whereas the IC50 for Kv4.3 channels was 24–54 nm (Herrington et al. 2006). In pancreatic β‐cells, 40–100 nm GTx caused spike broadening and increased intracellular Ca2+ levels (Herrington et al. 2006). A recent study in acutely isolated sympathetic neurons and CA1 pyramidal neurons found that 100 nm GTx mainly blocked I K and caused spike broadening, depolarization of interspike voltages and a reduction of maintained firing (Liu & Bean, 2014; Bishop et al. 2015).
In the present study, we used GTx to investigate the physiological roles of Kv2 channels in rat mEC LII SCs in brain slices. Voltage clamp recordings showed that 100 nm GTx blocked I K, with no apparent effect on I A. In current clamp, GTx slowed spike repolarization, affected both after‐depolarizations (ADPs) and after‐hyperpolarizations (fAHPs, mAHPs), and modulated excitability, bursting and repetitive firing in these cells. Our main results have been presented previously in abstract form (Hönigsperger et al. 2013).
Methods
Ethical approval
All experimental procedures were approved by the responsible veterinarian of the Institute, in accordance with the statute regulating animal experimentation given by the Norwegian Ministry of Agriculture, 1996. The experiments reported in the present study comply with the policies and regulations of The Journal of Physiology (Grundy, 2015).
Animal housing
Animals were kept in the local animal facility under a 12:12 h light/dark cycle at 20–24°C and ∼55% relative humidity, with 18% fat feed (Harlan, Indianapolis, IN, USA) in a GR900 cage (Scanbur, Karlslunde, Denmark) (395 × 346 × 213 mm) with connected ventilation.
Sagittal slice preparation of the mEC
Young male Wistar rats (20–28 days old) were deeply anaesthetized with Suprane (Baxter Medical AB SE, Kista, Sweden) before decapitation. The brain was removed and transferred to ice‐cold (0°C) cutting solution containing (in mm): 87 NaCl, 1.25 KCl, 1.25 KH2PO4, 25 NaHCO3, 16 glucose, 75 sucrose, 7 MgCl2 and 0.5 CaCl2, saturated with 95% O2/5% CO2. Acute sagittal slices (350–400 μm thick) from the mEC were cut in ice‐cold cutting saline with a vibratome (VT1200S; Leica Microsystems, Wetzlar, Germany). The slices were immediately transferred to a submerged holding chamber and incubated at ∼32ºC for 30 min before being stored in cutting solution at room temperature (20–24ºC).
For current clamp experiments, slices were submerged in artificial cerebrospinal fluid containing (mm): 125 NaCl, 1.25 KCl, 1.25 KH2PO4, 25 NaHCO3, 16 glucose, 1.0 MgCl2 and 2.0 CaCl2, supplemented with 6,7‐dinitroquinoxaline‐2,3‐dione, dl‐2‐amino‐5‐phosphopentanoic acid and 6‐imino‐3‐(4‐methoxyphenyl)‐1(6H)‐pyridazinebutanoic acid hydrobromide (gabazine) saturated with 95% O2/5% CO2.
For voltage clamp experiments of Kv2 current, the recording medium contained (mm): 125 NaCl, 2.5 KCl, 25 NaHCO3, 16 glucose, 1.0 MgCl and 1.8 CaCl2, supplemented with 200 μm CdCl2, 0.5 μm TTX, 10 μm 4‐ethylphenylamino‐1,2‐dimethyl‐6‐methylaminopyrimidinum chloride (ZD‐7288) and 10 μm 10,10‐bis(4‐pyridinylmethyl)‐9(10H)‐anthracenone dihydrochloride (XE991) for better isolation of Kv2 current.
Electrophysiology
Whole‐cell patch clamp recordings were performed from somata and nucleated patches of entorhinal cortex layer LII SCs, viewed with an upright microscope with IR‐DIC optics (BX50; Olympus, Tokyo, Japan) at 34°C. Nucleated patch configuration was achieved by applying negative pressure (–125 mbar) over 10–15 s, followed by slow retraction of the patch pipette.
Patch clamp pipettes were pulled from borosilicate glass (outer diameter 1.5–2 mm; inner diameter 0.6–0.86 mm) (Sutter Instruments, Novato, CA, USA and Hilgenberg GmbH, Malsfeld, Germany).
Voltage and current clamp recordings were performed with a Multiclamp 700B patch clamp amplifier (Molecular Devices, Sunnyvale, CA, USA) using pipettes with similar resistance (3–4 MΩ and 4–5 MΩ, respectively) filled with the solution (mm): 120 K‐gluconate, 20 KCl, 10 4‐(2‐hydroxyethyl)‐1‐piperazineethanesulphonic acid (Hepes), 10 phosphocreatine disodium salt hydrate, 4 adenosine triphosphate magnesium salt and 0.3 guanosine triphosphate sodium salt hydrate (∼290 mOsm).
The pH was adjusted to 7.2–7.3 with KOH. In some experiments biocytin (0.3%) was added to the pipette solution.
Data were only collected from cells forming a 1 GΩ or tighter seal. The series resistance was carefully compensated for at the beginning of every protocol. The accepted series resistance (measured when uncompensated) in voltage clamp was 11.9 ± 3.5 MΩ (range 7–20 MΩ) and in current clamp was 14.2 (6) MΩ (range 6–35 MΩ). The average series resistance compensation in voltage clamp recordings was 74% ± 12% (range 50–80%). In current clamp experiments, pipette capacitance neutralization was applied and access resistance was compensated through the bridge balance circuit of the amplifier.
Membrane potentials were corrected for the liquid junction potential (–14 mV).
Histology and morphological reconstructions
Neurons that had been filled with biocytin (0.3%) were visualized with the avidin‐biotin‐peroxidase method using 3,3′‐diaminobenzidine as a chromogen (ABC kit; Vector Laboratories, Inc., Burlingame, CA, USA).
Chemicals
TTX and Guangxitoxin‐1E (GTx) were purchased from Alomone Labs (Jerusalem, Israel). ZD 7288 and XE991, as well as synaptic blockers 6,7‐dinitroquinoxaline‐2,3‐dione, dl‐2‐amino‐5‐phosphopentanoic acid and gabazine, were obtained from Tocris (Tocris Bioscience, St Louis, MO, USA). The GTx was prepared as a 100 μm stock solution in water and BSA (0.1% w/v) was added. Aliquots of the GTx stock solution were kept frozen (–20°C) and added to the perfusion fluid within less than 5 min before onset of the bath application.
Data acquisition and analysis
The data were acquired with pClamp, version 9 (Molecular Devices) and digitized with a Digidata 1322A analog/digital converter (Molecular Devices) at a sampling rate of 20–40 kHz and low‐pass filtered at 0.4–10 kHz. Analysis was performed using Clampfit, version 10.4 (Molecular Devices) and Origin 9.1 (OriginLab Corp., Northampton, MA, USA).
The resting membrane potential was measured at the beginning of each experiment by averaging values over a 1 min period.
The somatic input resistance (R input) was calculated by Ohm's law from the steady‐state voltage response at the end of a 1 s long current pulse.
During voltage clamp recordings from nucleated patches, leakage and capacitive currents were subtracted online using a P/4 procedure.
The GTx‐sensitive conductance G was calculated by:
where V is the voltage, I is the GTx‐sensitive current and E K is the K+ reversal potential (–106.5 mV) determined by the Nernst equation. The conductance was fitted with a single Boltzmann function:
where G 0 and G max are the initial and maximal conductance, V 1/2 is the voltage for half‐maximal conductance, and k is the slope factor.
Activation of the GTx‐sensitive current was fitted with a mono‐exponential function:
where t is time, A is the amplitude, τ is the time constant and y 0 is the offset. To determine the 80–20% decay time of the GTx‐sensitive/resistant current, the inactivation phase of the current was fitted with a mono‐exponential function (see above), or a multiple‐term exponential function:
The GTx sensitive‐current measured at the end of the voltage step was plotted against the dorsoventral position of recorded cells, which was defined as the distance from the dorsal border of the mEC (The dorsal border of the mECs is recognized below a parasubicular protrusion into layer I of the mEC).
The values of ADPs and AHPs reported during repetitive firing were measured for each action potential that occurred over the last 300 ms for each cell and then averaged.
Interspike intervals (ISIs) were analysed from 20 s long trains of action potentials (frequency range 3–6 Hz). Only traces containing a similar number of spikes in control and GTx were analysed. The ISI distribution was obtained by binning with a window of 5 ms. Spike clusters were defined as spike aggregations with ISIs between 50 and 200 ms. The cluster probability was calculated as the number of clusters divided by the total amount of ISIs in a train. Peaks in the ISI distribution corresponding to bursts and clusters were measured by fitting a single or dual Gaussian to ISI distribution of each cells and condition.
Statistical analysis
Statistical analysis was performed using Origin, version 9.1, Minitab, version 17 (Minitab Inc., State College, PA, USA) and SigmaStat, version 3.1 (Systat Software Inc., Chicago, IL, USA). Group data are expressed as the mean ± SD, and the sample size of cells (n) and the number of rats (N) used in the individual experiments are given. Data were checked for normal distribution according to a normal probability plot of their residuals and parametric tests were used: (i) Paired t tests for paired samples (control vs. drug) (Minitab, version 17) and (ii) one‐way repeated measures ANOVA for multiple comparisons (control vs. drug at different concentrations) (SigmaStat, version 3.1). 95% confidence intervals were calculated with Minitab, verison 17.
Results
Identification of mEC LII SCs
In the present study, we used somatic whole cell patch clamp to record from mEC layer II SCs (n = 35) with an average resting membrane potential of –75.2 ± 2.4 mV and input resistance of 40.1 ± 16.3 MΩ. SCs were identified by their characteristic electrophysiological properties (Alonso & Klink R, 1993), including prominent membrane potential sags at depolarized and hyperpolarized potentials, prominent fluctuations (oscillatory activity) in the theta frequency range (4–12 Hz) during steady depolarization just below to the spike threshold, spike clustering, and triphasic postspike dynamics (ADP, as well as fAHP and mAHP) (Fig. 1 A–C). In a subset of the experiments, biocytin was added to the intracellular solution (n = 8) for posthoc morphological identification (Fig. 1 D). All recorded cells showed multipolar morphology with spiny dendrites without a preferred orientation with reference to the pia (Fig. 1 D).
Figure 1. Identification of mEC LII SCs.
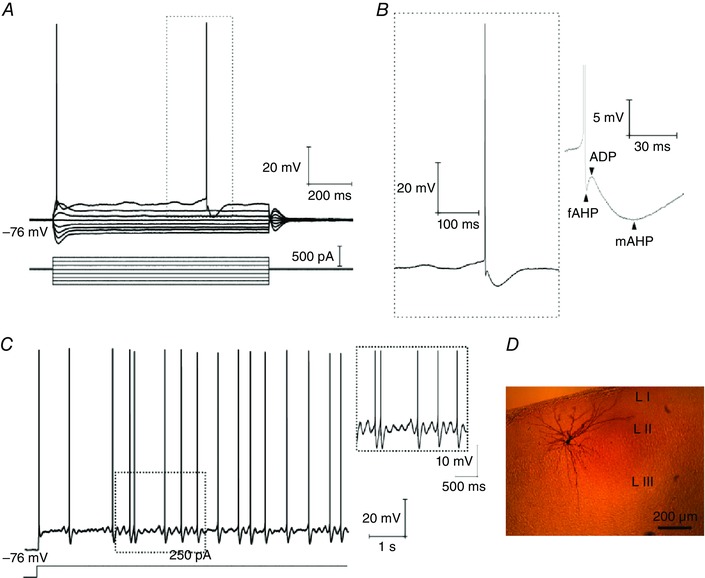
A, voltage responses evoked by a series of hyper‐ and depolarizing current steps show a prominent sag and spikes followed by the fAHP, ADP and mAHP sequence as indicated in (B). C, maintained depolarization around the spike threshold generates rhythmic oscillatory activity in the theta range (4–12 Hz), and spike clustering. D, the same cell as recorded in (A–C) was filled with biocytin and stained with 3,3′‐ diaminobenzidine for morphological identification. [Colour figure can be viewed at wileyonlinelibrary.com]
Voltage clamp recordings of a slowly inactivating GTx‐1E‐sensitive outward current from nucleated patches
LII SCs express different types of potassium currents, including (i) leak K+ current (I K, rest) (Deng et al. 2007; Garden et al. 2008); (ii) A‐type, voltage‐dependent, fast‐inactivating K+ current (I A) (Eder et al. 1991; Eder & Heinemann, 1996); (iii) delayed rectifier voltage‐dependent K+ current (I K) (Eder et al. 1991; Eder & Heinemann, 1996); (iv) M‐type voltage‐dependent K+ current (I M) (Nigro et al. 2014); (v) inward‐rectifier K+ current (I KIR) (Dickson et al. 2000); and (vi) various calcium‐activated K+ currents (I KCa) (Khawaja et al. 2007). Among the different types of potassium current, I A and I K constitute most of the outward current reported in LII SCs (Eder et al. 1991; Eder & Heinemann, 1996), which exhibit a larger I K than pyramidal cells in LII EC (Eder & Heinemann, 1994).
In the present study, we first investigated the relative contribution of Kv2 channels to outward current in identified LII SCs, using GTx, which is a recently described specific blocker for Kv2 channels (Herrington et al. 2006; Liu & Bean, 2014; Bishop et al. 2015). Voltage clamp recordings were performed on nucleated patches of SCs to minimize space clamp errors and to increase the voltage clamp speed. For better isolation of I K, recordings were performed in the presence of TTX (0.5 μm), ZD7288 (10 μm), XE991 (10 μm) and CdCl2 (200 μm) to block or reduce several voltage‐ and calcium‐dependent Na+, Ca2+ and K+ currents (i.e. I NaT, I NaP, I h, I M, I Ca,V, I BK, I SK and I sAHP) (Storm, 1990).
The recordings in control medium exhibited an outward current with fast activation and slow inactivation (Fig. 2 A, black trace) in response to a voltage pulse (400 ms) from –84 mV to –14 mV. Application of 100 nm GTx (Fig. 2 A, red trace) strongly reduced the total outward current throughout most of the pulse, so that the reduction was ∼40% during the last 30 ms of the 400 ms pulse: control: 98.67 ± 24.69 pA; +GTx: 56.98 ± 19.50 pA (P = 0.001) (Fig. 2 A–C). The remaining GTx‐resistant current showed very fast activation and fast early inactivation, which is typical of I A, as previously described in LII SCs (Eder et al. 1991; Eder & Heinemann, 1996). The slowly inactivating GTx‐insensitive/resistant current might be the result of incomplete block by GTx. However, 100 nm GTx had no significant effect on the peak outward current measured during the first 1–2 ms of the voltage pulse (i.e. +GTx compared to control): control: 209.6 ± 61.4 pA; +GTx: 195.0 ± 77.2 pA (P = 0.22) (Fig. 2 A, D, E). This indicates that 100 nm GTx has almost no effect on I A, and thus is a selective blocker.
Figure 2. GTx‐1E (100 nm) blocks IK in SCs.
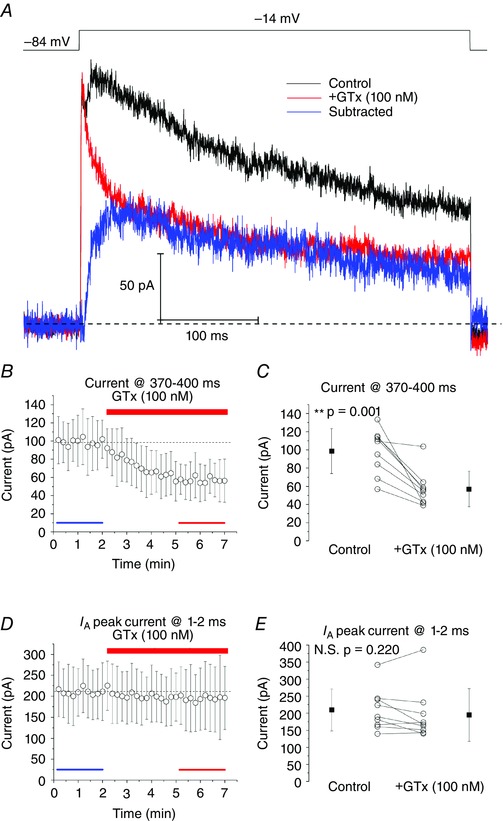
A, outward currents recorded from a nucleated patch evoked by 400 ms voltage pulses from –84 mV to –14 mV. Overlay of currents recorded in control (black), after bath‐application of 100 nm GTx (red) and the GTx‐sensitive current determined by subtracting currents recorded before and after applying GTx (blue). Individual traces represent averaged responses from four consecutive recordings. Note that the current blocked by GTx had slower activation kinetics than both control and GTx‐resistant currents. B, time plot showing the effects of GTx on the current at the end of a 400 ms voltage pulse (370–400 ms). Blue and red bars indicate the time points used for averaging current responses in (C), in control and after GTx application, respectively. C, summary, GTx significantly lowered the current measured at the end of the pulse. Control: 98.67 ± 24.69 pA; +GTx: 56.98 ± 19.50 pA; ** P = 0.001. D, time plot showing the effects of GTx on I A in the beginning of the voltage pulse (1‐2 ms). E, summary, GTx had no significant effect on the current measured in the beginning of the pulse. Control: 209.6 ± 61.4 pA; +GTx: 195.0 ± 77.2 pA; P = 0.22, paired t tests; n = 9 cells, n = 9 rats. Data are the mean ± SD. [Colour figure can be viewed at wileyonlinelibrary.com]
To isolate the GTx‐sensitive current, which is probably mediated by Kv2 channels, we subtracted the GTx‐resistant current from the total outward current obtained in control medium. The resulting GTx‐sensitive current (Fig. 2 A, blue trace) had significantly slower activation kinetics than the GTx‐resistant current (I A). The 20–80% rise time of the GTx‐resistant current was 2.2 ± 0.6 ms, whereas the rise time of the GTx‐sensitive current was 21.0 ± 4.6 ms (P < 0.01). Also, the 80–20% decay time of the GTx‐sensitive current was slower than that of the GTx‐resistant current (I A): GTx‐sensitive: 92.9 ± 15.0 ms; GTx‐resistant: 44.9 ± 19.7 ms (P < 0.001).
Several different membrane properties of EC SCs show dorsoventral gradients (Giocomo et al. 2007; Garden et al. 2008) that accompany the dorsoventral gradient in grid cell spacing (Hafting et al. 2005). Therefore, we tested whether the GTx‐sensitive current varies along the dorsoventral axis by comparing the GTx‐sensitive current with the dorsoventral position of recorded SCs. However, we did not find any significant correlation between these parameters (Pearson's r = –0.23; P = 0.58, n = 8; distance from dorsal border, range 457–1940 μm).
Next, we investigated the voltage‐dependence and activation kinetics of the GTx‐sensitive current in response to depolarizing voltage pulses (Fig. 3). The subtracted, GTx‐sensitive current started to activate between –30 and –20 mV (Fig. 3 A and B), similar to the I K previously described in this cell type (Eder et al. 1991; Eder & Heinemann, 1996), and exhibited faster activation time constants at more depolarized test potentials (–24 mV: 29.4 ms; –14 mV: 12.8 ms; –4 mV: 3.1 ms; +6 mV: 1.8 ms) (Fig. 3 A and B). The Kv2 activation curve was well fitted with a Boltzmann function and showed a half‐maximal conductance (V 1/2) at –13.4 ± 0.8 mV and slope factor (k) of 6.0 ± 0.6 mV, which is in good agreement with the properties of Kv2 isolated by GTx in sympathetic neurons and hippocampal CA1 neurons (Liu & Bean, 2014).
Figure 3. Voltage‐dependence and activation kinetics of GTx‐sensitive current evoked by depolarizing voltage pulses.
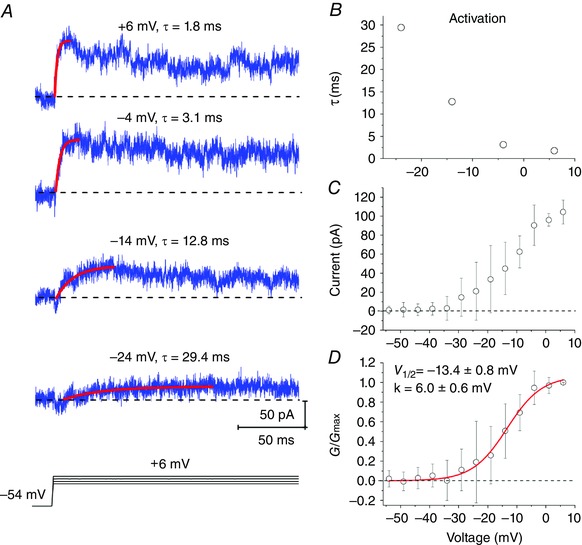
A, individual traces represent averaged responses from four different patches. The current was fitted by a mono‐exponential function (red, from baseline to peak) f(x) = A[exp(–x/τ)]+ y 0, where A is the amplitude, (τ) is the time constant and y 0 is the offset. B, time constants plotted against test voltages calculated from mono‐exponential fits in Fig 3 A. C, peak of GTx‐sensitive current plotted as a function of voltage (I–V). D, the conductance (G) was calculated from the peak of GTx‐sensitive current in Fig. 3 B, using a K+ equilibrium potential of 106.5 mV. The conductance was fitted with a single Boltzmann f(V) = (G 0 – G max)/(1 + exp((V – V 1/2)/k)) + G max, where G 0 and G max, are the initial and maximal conductance, V 1/2 is the voltage for half‐maximal conductance = –13.4 ± 0.8 mV, k is the slope factor = 6.0 ± 0.6 mV; n = 5 cells, n = 5 rats. Data are the mean ± SD. [Colour figure can be viewed at wileyonlinelibrary.com]
Blockade of Kv2 channels by 100 nm GTx increased burst firing and excitability during low spike rates and reduced maintained firing during higher spike rates
We next investigated how blockade of Kv2 channels by GTx affected the excitability and spike pattern in layer II SCs during whole‐cell current clamp recordings. To do this, we injected a 1 s long current pulse once every 1 min, adjusted to evoke ∼10–11 spikes s–1 in normal medium (Fig. 4 A, black trace). This resembles the average spike rates of SCs in vivo (Domnisoru et al. 2013; Schmidt‐Hieber & Hausser, 2013). After a 6 min control period, wash‐in of 100 nm GTx induced intermittent burst‐firing, consisting of 2–3 spikes burst–1 (Fig. 4 A, red trace, inset) and increased the average spike rate to ∼17 spikes s–1 (Fig. 4 B).
Figure 4. Blockade of Kv2 channels by 100 nm GTx increases burst firing and excitability in SCs during low spike rates and reduces maintained firing during higher spike rates.
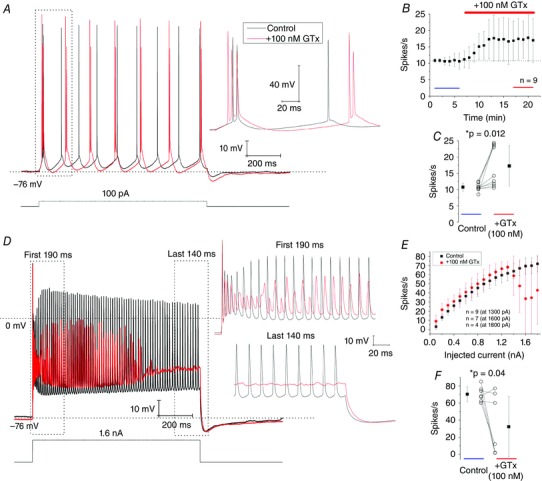
A, in control conditions (black traces) a 1 s long current pulse was adjusted to evoke ∼11 spikes s–1. Bath‐application of 100 nm GTx (red traces) induces intermittent burst firing (see inset) and increases the number of spikes s–1. B, time plot, showing the effects of 100 nm GTx on spikes s–1; n = 9 cells; n = 6 rats. Blue and red bars indicate the time points used for averaging spikes s–1 in (C), in control and after GTx application, respectively. C, summary, 100 nm GTx significantly increases the number of spikes s–1. Control: 10.8 ± 1.2 spikes s–1; +GTx: 17.3 ± 6.2 spikes s–1; * P = 0.012. D, in control conditions (black traces) a 1 s long, strong current pulse (1.6 nA) evoked ∼70 spikes s–1. Application of 100 nm GTx reduces mean spike rate and spike height and depolarizes interspike intervals. Insets show the first 190 ms and last 140 ms during the current pulse at an enlarged scale. E, effects of 100 nm GTx (red dots) on spike rates (spikes s–1) plotted against injected current (pA); n = 9 (at 1.3 nA), n = 7 (at 1.6 nA) and n = 4 cells (1.8 nA), respectively. F, summary, 100 nm GTx reduced spike rates during strong current pulses (1.6–1.8 nA). As a criteria, spikes below 0 mV (horizontal dashed lines in D) were not included for analysis. Control: 70.3 ± 8.7 spikes s–1; +GTx: 32.3 ± 35.2 spikes s–1; * P = 0.04, paired t tests. n = 7 cells, n = 5 rats. Data are the mean ± SD. [Colour figure can be viewed at wileyonlinelibrary.com]
Our summarized results show that SCs exhibited significantly higher spike rates in the presence of 100 nm GTx compared to control: control: 10.8 ± 1.2 spikes s–1; +GTx: 17.3 ± 6.2 spikes s–1 (P = 0.012) (Fig. 4 C).
In parallel, we investigated whether blockade of Kv2 channels by 100 nm GTx also increased excitability during higher spike rates. To cover a wide range of spike rates, we applied a series of 1 s long, depolarizing current pulses of increasing intensity, evoking up to ∼70 spikes s–1 under control conditions (Fig. 4 D and E, black traces). During strong pulses, the spike amplitudes usually decreased transiently after the first spike, followed by a partial recovery (increase) of spike amplitudes between the 5th and 11th spike (Fig. 4 D, inset, black traces). The decrease in spike‐height was accompanied by more depolarized interspike intervals during both the early and late firing.
After 100 nm GTx was applied (Fig. 4 D, red traces), the spike amplitudes were strongly reduced during strong pulses, except for the first spike in the train, and the interspike intervals were further depolarized, until spiking was abolished towards the end of the pulse, presumably reflecting Na+ channel inactivation (Fig. 4 D). The summarized data show that 100 nm GTx significantly reduced the number of spikes s–1 during strong current pulses (1.6–1.8 nA): control: 70.3 ± 8.7 spikes s–1; +GTx: 32.3 ± 35.2 spikes s–1 (P = 0.04) (Fig. 4 F). This strongly suggests that Kv2 channels are important for enabling maintained firing under normal conditions, presumably by preventing excessive Na+ channel inactivation.
Kv2 channels regulate excitability by modulating spike after‐potentials during repetitive firing
The results illustrated in Fig. 4 show that GTx increased burst‐firing and excitability at low and moderate spike rates (Fig. 4 B–F), strongly suggesting that Kv2 channels underlie these effects. Next, we tested whether Kv2 channels regulate burst‐firing and excitability by modulating ADP and/or fAHP and mAHP in SCs.
To measure fAHP, ADP and mAHP after single spikes and to avoid bursting during repetitive firing, we used lower doses of GTx (10 and 30 nm, in sequence) to isolate its effects on these after‐potentials.
We injected again a 1 s long current pulse once per minute, adjusted to evoke ∼10‐11 spikes s–1 in a 6 min control period (Fig. 5 Aa, black trace). Wash‐in of 10 nm, monitored for 10 min (Fig. 5 Ba), caused a slight increase in the average spike rate in seven of nine cells (Fig. 5 Ab, red trace) but had no statistically significant effects in all tested cells: control: 11.2 1.4 spikes s–1; +10 nm GTx: 13.1 ± 1.4 spikes s–1; not significant (P = 0.075) (Fig. 5 Bb).
Figure 5. Accumulative blockade of Kv2 channels by 10 and 30 nm GTx increases excitability.
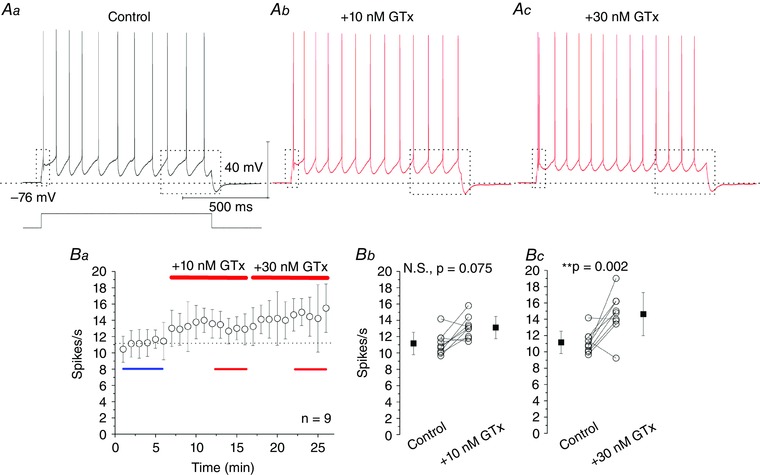
Aa, in control conditions, a 1 s long current pulse was adjusted to evoke ∼11 spikes s–1. Ab–c, application of 10 and 30 nm GTx subsequently increased the number of spikes s–1 and depolarized interspike intervals. Ba, time plot, showing effects of 10 and 30 nm GTx on spikes s–1; n = 9 cells; n = 6 rats. Bb, control: 11.2 ± 1.4 spikes s–1; +10 nm GTx: 13.1 ± 1.4 spikes s–1; not significant, P = 0.075. Bc, control: 11.2 ± 1.4 spikes s–1; +30 nm GTx: 14.6 ± 2.6 spikes s–1; ** P = 0.002. Data are the mean ± SD. [Colour figure can be viewed at wileyonlinelibrary.com]
Wash‐in of 30 nm GTx for 10 min (Fig. 5 Ba), again increased the spike rate (Fig. 5 Ac, red trace, seven of nine cells) and had significant effects when comparing all collected data: control: 11.2 ± 1.4 spikes s–1; +30 nm GTx: 14.6 ± 2.6 spikes s–1 (P = 0.002) (Fig. 5 Bc).
We next measured the membrane potential peaks (mV) of fAHP, ADP and mAHP following the first spike (Fig. 6 Aa and b) and during steady‐state firing in the last 300 ms of the train (Fig. 6 Ac–d), in control and after wash‐in of 10 and 30 nm GTx (representative traces shown at an enlarged scale in Fig. 6 Aa–d correspond to traces in Fig. 5 Aa–c, marked by dashed boxes).
Figure 6. Accumulative blockade of Kv2 channels by 10 and 30 nm GTx modulates fAHP, ADP and mAHP during repetitive firing.
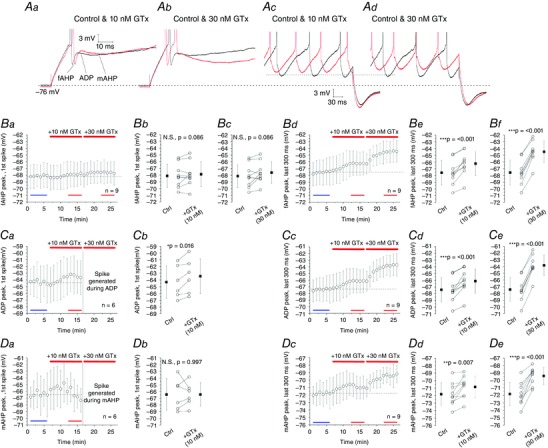
Aa–d, overlay of voltage responses during initial and late firing from traces in Fig. 5 Aa–c (dashed boxes), comparing fAHP, ADP and mAHP in control and after application of 10 and 30 nm GTx. Ba, Ca and Da, time plots showing effects of 10 and 30 nm GTx on fAHP, ADP and mAHP peaks (mV) after the 1st spike and in Bd, Cc and Dc averaged responses following spikes in the last 300 ms. Bb, fAHP peak after 1st spike; control: –68.1 ± 1.7 mV; +10 nm GTx: –67.9 ± 1.8 mV; not significant, P = 0.086. Bc, control: –68.1 ± 1.7 mV; +30 nm GTx: –67.6 ± 1.6 mV; not significant, P = 0.086; Be, fAHP peak, last 300 ms; control: –67.6 ± 1.8 mV; +10 nm GTx: –66.2 ± 1.8 mV; *** P < 0.001; Bf, control: –67.6 ± 1.8 mV; +30 nm GTx: –64.5 ± 1.6 mV; *** P < 0.001; Cb, ADP peak after 1st spike; control: –64.3 ± 2.4 mV; +10 nm GTx: –63.4 ± 2.6 mV; * P = 0.016; Cd, ADP peak, last 300 ms; control: –67.4 ± 1.8 mV; +10 nm GTx: –66.1 ± 1.8 mV; *** P < 0.001; Ce, control: –67.4 ± 1.8 mV; +30 nm GTx: –63.8 ± 1.5 mV; *** P < 0.001; Db, mAHP peak after 1st spike; control: –66.4 ± 2.3 mV; +10 nm GTx: –66.4 ± 1.7 mV; not significant, P = 0.997; Dd, mAHP peak, last 300 ms; control: –71.8 ± 1.6 mV; +10 nm GTx: –70.8 ± 1.5 mV; ** P = 0.007; De, control: –71.8 ± 1.6 mV; +30 nm GTx: –69.4 ± 1.1 mV; *** P < 0.001, One‐way repeated measures ANOVAs. Data are the mean ± SD. [Colour figure can be viewed at wileyonlinelibrary.com]
The fAHP peak following the first spike was not significantly affected by neither 10 nm GTx (P = 0.086) (Fig. 6 Bb), nor 30 nm GTx (P = 0.086) (Fig. 6 Bc), as seen in the time plot (Fig. 6 Ba). By contrast, the fAHP peak during steady‐state firing in the last 300 ms of the train was significantly depolarized during wash‐in of 10 and 30 nm GTx (P < 0.001) (Fig. 6 Bd–f).
Next, we analysed the ADP peak following the first spike (Fig. 6 Aa) and found that it was significantly higher (more depolarized) after wash‐in of 10 nm GTx (P = 0.016) (Fig. 6 Ca and b). After wash‐in of 30 nm GTx, a spike was triggered (Fig. 6 Ab, red trace), coinciding with the ADP peak in control conditions (Fig. 6 Ab, black trace), which indicates that blockade of Kv2 channels increases the ADP amplitude and thus enhances the probability of ADP‐triggered extra spikes and bursting in SCs.
Similarly, 10 and 30 nm GTx significantly increased the ADP peak during steady‐state firing during the last 300 ms of each spike train (P < 0.001) (Fig. 6 Cc–e) but did not induce bursting during the late repetitive firing (Fig. 6 Ac–d, red trace), in contrast to the beginning of the train (Fig. 6 Ab, red trace).
Unlike the ADP, the mAHP following the first spike was not significantly affected by wash‐in of 10 nm GTx (P = 0.997) (Fig. 6 Da and b). However, after application of 30 nm GTx, no mAHP could be measured after the first spike because a second spike appeared immediately afterwards during the ADP (Fig. 6 Ab, red trace).
By contrast, the mAHP peak during steady‐state firing in the last 300 ms of the train was significantly more depolarized during application of 10 and 30 nm GTx compared to control (P = 0.007 and P < 0.001) (Fig. 6 Dc–e), as seen in the representative traces (Fig. 6 Ac and d).
In conclusion, blockade of Kv2 channels by GTx significantly depolarized the ADP peak following the first spike, at the same time as depolarizing fAHP, ADP and mAHP during steady‐state firing in the last 300 ms of the train. This may be explained by the cumulative activation of Kv2 channels combined with inactivation of other K+ channels (e.g. BK channels, Kv4 and Kv1) (Gu et al. 2007). Thus, the observed effects of Kv2 blockade may not only depend on Kv2 channels directly, but also on other voltage‐ and calcium‐dependent membrane conductances.
Kv2 channels regulate the ADP following a single spike
Our previous results suggested that Kv2 channels regulate the ADP but not the fAHP and mAHP after the first spike evoked by 1 s long current pulses (Fig. 6). However, these experiments were only measured at relatively low concentrations of GTx (10 nm) because 30 nm often induced bursting (Fig. 6 Ab) during a 1 s long pulse.
We next investigated the effects of 100 nm GTx by applying a brief 10 ms long current pulse to evoke just a single spike in normal medium (Fig. 7 A, black trace) and after application of GTx (Fig. 7 A, red trace). We found that 100 nm GTx significantly increased the ADP amplitude from 10.4 ± 2.6 mV (control) to 14.5 ± 3.1 mV (P < 0.001) (Fig. 7 B) and increased the ADP area from 95.5 ± 39.3 mVms to 179.2 ± 61.9 mVms (P < 0.001) (Fig. 7 C) following a single spike. Application of of 100 nm GTx also significantly depolarized the fAHP peak: control: –52.2 ± 2.4 mV; +GTx: –50.6 ± 2.9 mV (P = 0.004). By contrast, 100 nm GTx had no significant effects on the mAHP amplitude following a single spike: control: 3.2 ± 0.5; GTx: 3.2 ± 0.6, not significant (P = 0.73) (Fig. 7 D). Furthermore, 100 nm GTx had no significant effects on the spike threshold: control: –59.6 ± 1.9 mV; +GTx: –59.3 ± 2.3 mV (P = 0.76) or rheobase, control: 401.4 ± 47.6 pA; +GTx: 404.1 ± 58.5 pA (P = 0.92). This is expected for blockade of Kv2 channels, which activate at more depolarized levels than the spike threshold (Fig. 3).
Figure 7. GTx increases ADP after a single spike.
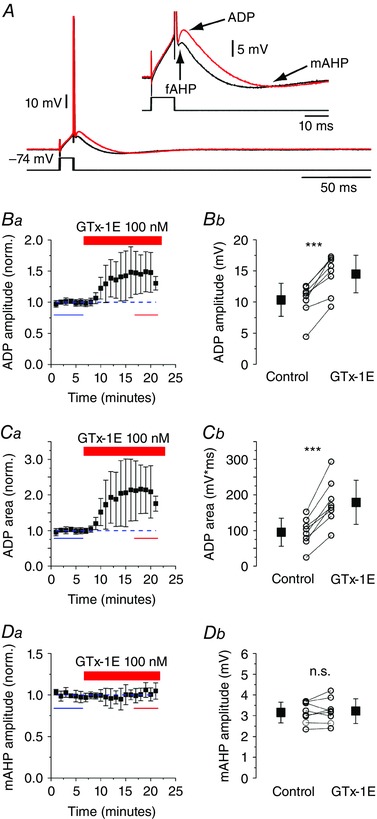
A, representative traces showing a single action potential evoked by a 10 ms depolarizing pulse from –74 mV. The insert shows the after‐potentials at a larger scale. Ba–b, GTx application strongly increased the ADP amplitude and area (Ca–b) after a single spike (n = 8, P < 0.001, paired t test). Da–b, GTx had no significant effect on the mAHP evoked by a single spike (n = 8, not significant, P = 0.73, paired t test). Data are the mean ± SD. [Colour figure can be viewed at wileyonlinelibrary.com]
Kv2 channels contribute to spike repolarization
As shown in Fig. 4 D, GTx reduced repetitive firing and strongly affected the shape of late spikes during strong current pulses. To test how GTx affects spike repolarization during repetitive firing, we compared spike widths measured at half‐spike height in control and after wash‐in of 100 nm GTx (Fig. 8 Aa–h) during a 1 s long current pulse. For better comparison, we adjusted the current pulses to evoke 50 spikes s–1 both in control medium and after wash‐in of the drug.
Figure 8. Kv2 channels contribute to spike repolarization.
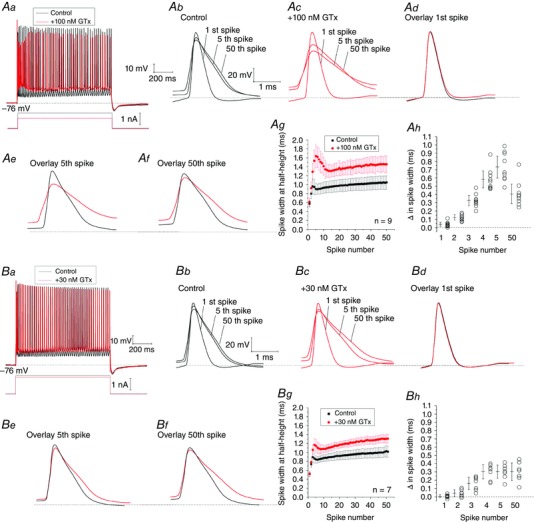
Aa, in control conditions a 1 s long current pulse evoked ∼50 spikes s–1 (black trace). After application of 100 nm GTx (red trace), the current pulse was reduced to evoke the same number of spikes relative to control. Ab–f, Overlay of the 1st, 5th and 50th spike in control and after application of 100 nm GTx. Ag, spike widths at half‐height (ms) in control (black) and after application of 100 nm GTx (red) plotted against spike number during the 1 s long current pulse. Ah, difference (Δ) in spike widths at half‐height (ms) for the 1st, 5th and 50th spike before and after wash‐in of 100 nm GTx. Error bars indicate 95% confidence limits for differences in spike widths: 1st spike (0.013 < Δ ms < 0.062); 2nd spike (0.091 < Δ ms < 0.155); 3rd spike (0.265 < Δ ms < 0.390); 4th spike (0.481 < Δ ms < 0.685); 5th spike (0.599 < Δ ms < 0.866); and 50th spike (0.289 < Δ ms < 0.525) (n = 9 cells, n = 6 rats). Ba, in a different set of experiments a 1 s long current pulse was again adjusted to evoke 50 spikes s–1 in control and after wash‐in of 30 nm GTx. Bb–f, overlay of the 1st, 5th and 50th spike in control and after wash‐in of 30 nm GTx. Bg, spike widths at half‐height (ms) in control (black) and after wash‐in of 30 nm GTx (red) plotted against spike number during the 1 s long current pulse. Bh, difference (Δ) in spike widths at half‐height (ms) for the 1st, 5th and 50th spike before and after wash‐in of 30 nm GTx. Error bars indicate 95% confidence limits for differences in spike widths: 1st spike (–0.013 < Δ ms < 0.026); 2nd spike (0.004 < Δ ms < 0.083); 3rd spike (0.085 < Δ ms < 0.237); 4th spike (0.217 < Δ ms < 0.390); 5th spike (0.223 < Δ ms < 0.384); and 50th spike (0.196 < Δ ms < 0.410) (n = 7 cells, n = 5 rats). Data are the mean ± SD. [Colour figure can be viewed at wileyonlinelibrary.com]
In normal medium, the spikes showed progressive broadening after the first spike as indicated by the superimposed traces in Fig. 8 Ab (1st, 5th and 50th spike). Wash‐in of 100 nm GTx caused additional spike broadening (Fig. 8 Ac) and the spike widths increased more strongly after the first spike compared to control (Fig. 8 Ad–g).
Our summarized data show that 100 nm GTx strongly slowed spike repolarization and increased the widths of the late spikes during repetitive firing, as indicated by the 95% confidence limits (Fig. 8 Ah), although it only slightly increased the width of the first spike in the train.
We also tested whether a lower dose of GTx (30 nm), which is probably less effective but even more specific for Kv2, had similar effects on spike repolarization during repetitive firing (Fig. 8 Ba–h). Again, we found that wash‐in of 30 nm GTx significantly increased the duration of the second spike and later spikes in the train (Fig. 8 Be–h) but had no significant effect on the first spike (Fig. 8 Bd and h).
In conclusion, blockade of Kv2 channels by 100 nm GTx or 30 nm GTx had minor or no effects on spike width of the 1st spike in a spike train (Pathak et al. 2016) but strongly increased spike width during subsequent spike firing.
In all cases, the GTx‐induced spike broadening suggested loss of repolarizing K+ current. Further, spike amplitude was reduced after application of GTx for all spikes except the 1st one in each spike train. The latter effect may reflect cumulative inactivation or incomplete recovery from inactivation of voltage‐gated Na+ channels (Gu et al. 2007; Johnston et al. 2008; Guan et al. 2013; Liu & Bean, 2014) because of the more depolarized interspike trajectories after Kv2 channel blockade (Figs 4, 5, 6).
Kv2 blockade reduces spike clustering and rebound depolarization
A relevant feature of the firing pattern of mEC is their ability to fire clusters of spikes in response to just suprathreshold current injections (Alonso & Klink, 1993; Nolan et al. 2007). The instantaneous frequency within clusters depends both on the amount of injected current and neuronal membrane properties, in particular the kinetics of the mAHP, which is largely controlled by I h (Nolan et al. 2007). To study the effects of GTx on spike clustering, we injected 20 s long depolarizing current steps to induce trains of spikes at frequencies of 3–6 Hz in normal medium and after application of 100 nm GTx (Fig. 9 A) and compared the traces with similar frequencies in both conditions. All cells tested showed clustering (n = 8) in control condition within the range of frequencies that we explored. Clustering was seen in the ISI distribution as a prominent peak at ∼180 ms (Fig. 9 C). Application of GTx induced bursting in seven of the eight cells tested, as shown by the peak below 10 ms in the ISI plot of Fig. 9 D. Moreover, blockade of Kv2 channels by GTx reduced the number of clusters from 58.4 ± 10.9 to 28.6 ± 12.9 (P = 0.002) (Fig. 9 E).
Figure 9. Kv2 blockade disrupts spike clustering in SCs.
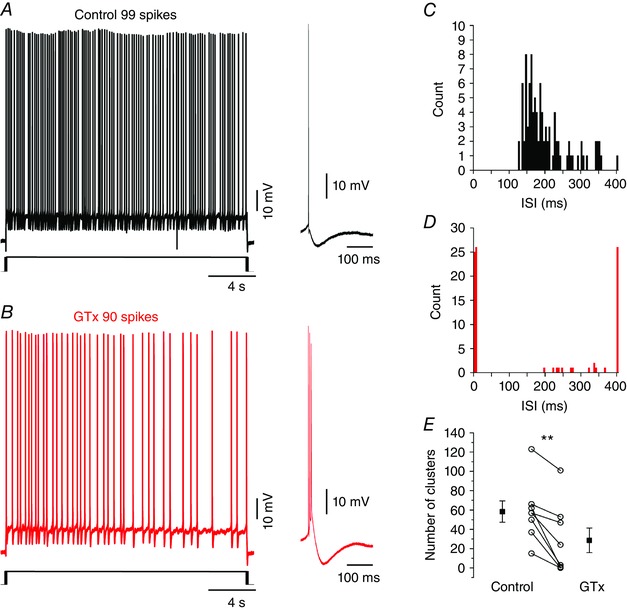
A, representative recording of a 20 s train of action potentials at 5 Hz in control conditions. Note that, in control conditions, SCs fire single action potentials with triphasic after‐potentials (right trace; see also Fig. 1 B, 6 A and 7 A). B, same cell as in (A) in the presence of 100 nm GTx and a firing frequency of 4.5 Hz. After the blockade of Kv2 channels, the cell fires bursts of action potentials (right trace). C, ISI distribution of the trace shown in (A). The main peak of the distribution corresponds to spikes belonging to clusters. D, ISI distribution of the trace in (B). After Kv2 blockade, around half of the spikes belong to bursts, the clustering is reduced and the intra‐cluster ISI is increased. E, summary plot of the number of cluster in control and GTx showing that Kv2 blockade decreases the amount of clusters in SCs. [Colour figure can be viewed at wileyonlinelibrary.com]
The reduction of clusters after GTx application was accompanied by a longer duration of ISIs around typical cluster values (200 ms) (Fig. 9 D). Indeed, the ISI distribution in control showed a first peak (cluster) at 153.4 ± 7.7 ms but, after GTx application, the corresponding peak was at 264.6 ± 40.4 ms (n = 8; P = 0.024). We found that this increased ISIs duration of clusters in GTx was not associated with an altered kinetics of the mAHP: half‐width control: 107.9 ± 6.1 ms; half‐width GTx: 120.2 ± 11.4 ms (P = 0.17) (Fig. 10 A and B), although it was probably the result of a reduced excitability following the bursts. Indeed, the rebound potential that underlies clustering in mEC SCs was reduced after blockade of Kv2 channels and was probably the result of an increased recruitment of the Ca2+‐activated potassium conductance responsible for the sAHP: control: –4.4 ± 0.3 mV; GTx: –5.7 ± 0.4 mV; n = 7 (P < 0.001) (Fig. 10 A and C).
Figure 10. Kv2 blockade reduces the excitability following a burst.
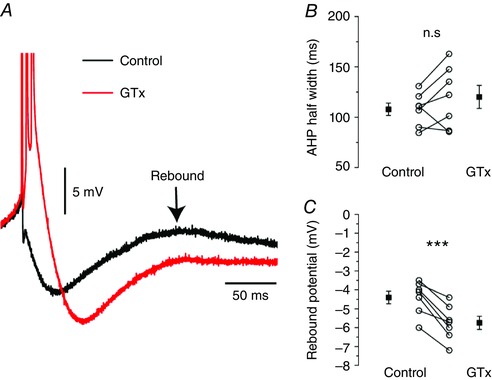
A, representative recording of a single spike in control (black) and a burst in GTx (red) from the traces in Fig. 9 A–B. B, summary plot of the mAHP half‐width in control and GTx showing that Kv2 blockade has no effect on mAHP duration. C, summary plot of the rebound potential measured from the action potential threshold in control and GTx. The membrane voltage remains significantly more hyperpolarized after blockade of Kv2 channels. [Colour figure can be viewed at wileyonlinelibrary.com]
As expected from the voltage dependence of Kv2 activation, we did not find any difference in the subthreshold fluctuations (‘oscillations’) measured at similar voltages in control (4.7 ± 0.4 Hz) and GTx (4.0 ± 0.3 Hz) (n = 8; P = 0.4).
Discussion
Main findings
In the present study, we used the Kv2 channel blocker GTx to investigate the physiological roles of Kv2 channels in mEC layer II SCs in rat brain slices. Voltage clamp recordings from nucleated patches showed that 100 nm GTx inhibited a delayed rectifier current (I K) which started to activate between –30 mV and –20 mV (Fig. 3), which is typical of Kv2 channels (Guan et al. 2007; Johnston et al. 2008; Liu & Bean, 2014). By contrast, GTx had essentially no effect on the transient A‐type current (Fig. 2). Previous results from other neuron types, showed only minimal, weak effects of GTx on the A‐type current (Liu & Bean, 2014; Pathak et al. 2016), indicating that GTx acts as a potent and apparently selective blocker of Kv2 channels under our experimental conditions. This is also supported by thorough testing of GTx in expression systems showing that this toxin had no significant effect on other channel types, including Kv1.2, Kv1.3, Kv1.5, Kv3.2 and BK potassium channels, as well as Cav1.2, Cav2.2, Nav1.5, Nav1.7 and Nav1.8 (Herrington et al. 2006).
When starting from a moderate spike rate (∼10 spikes s–1), we found that 100 nm GTx strongly enhanced burst firing and increased the overall spike rate (Fig. 4 A–C). By contrast, GTx reduced the maintained firing when starting from higher spike rates (∼70 spikes s–1) (Fig. 4 D–F), as was also found in other cell types (Du et al. 2000; Johnston et al. 2008; Guan et al. 2013; Liu & Bean, 2014).
We tested whether the increase in bursting and excitability was related to changes in the after‐potentials that follow each spike: the fAHP, ADP and mAHP (Fig. 5 and 6).
Indeed, blockade of Kv2 channels by 30 nm GTx, increased the average spike rate when starting from moderate spike rates (Fig. 5 Aa–c) and simultaneously increased the ADP amplitude following both the first and later spikes (Fig. 6 Ca–e). In parallel, the fAHP and mAHP amplitudes during steady‐state repetitive spike firing were reduced by GTx (Fig. 6 Bd–f and 6Dc–e). These effects suggest that Kv2 channels play a role in controlling the AHPs during steady‐state repetitive firing through cumulative activation of the slowly activating and slowly inactivating Kv2 current during repetitive firing. Moreover, inactivation of other K+ channels (i.e. BK channels, Kv1 and Kv4) might result in an increased contribution of Kv2 channels to AHPs during steady‐state repetitive firing, as suggested by earlier studies (Gu et al. 2007; Johnston et al. 2008; Liu & Bean, 2014). Similarly, a previous study in dissociated CA1 pyramidal neurons and sympathetic neurons suggested that blockade of Kv2 channels by GTx reduces AHPs during repetitive firing (Liu & Bean, 2014).
When a single spike was evoked by a brief, depolarizing pulse, however, GTx (100 nm) did not significantly change the mAHP amplitude, measured at a more negative potential (< –74 mV), although the ADP was clearly enhanced (Fig. 7). This apparent discrepancy probably reflects dual, voltage‐dependent mAHP mechanisms, similar to those previously found in CA1 pyramidal cells (Storm, 1989; Gu et al. 2005): the mAHP recorded below, or close to the resting membrane potential (–75 ± 2.4 mV), is probably mainly a result of the H‐current (hyperpolarization‐activated cation channels), which is transiently deactivated by the preceding depolarization (depolarizing pulse, spike and ADP), and is therefore scarcely affected by GTx (Fig. 7). By contrast, the mAHP amplitude recorded at more depolarized potentials (e.g. during a long depolarizing pulse) is more probably a result of other currents: (i) Kv2 current (Fig. 6 D); (ii) Kv7/M‐current (Storm, 1989; Nigro et al. 2014); and/or (iii) Ca2+‐ dependent K+ current (Khawaja et al. 2007). A previous study showed that the H‐current also promotes repolarization of the mAHP in SCs, thereby controlling spike firing during long depolarizing current pulses (Nolan et al. 2007).
GTx caused a clear broadening of the late spikes during a spike train, although the toxin had almost no effect on the first spike (Fig. 8) (Pathak et al. 2016). This strongly suggests that Kv2 channels contribute directly and considerably to the repolarization of late spikes. Part of the effect is probably also indirect, via depolarized interspike trajectories after Kv2 channel blockade of the mAHP, causing incomplete recovery from inactivation of voltage‐gated Na+ channels (Johnston et al. 2008; Guan et al. 2013; Liu & Bean, 2014), thus reducing the spike amplitude (Fig. 4), which in turn may reduce activation of other repolarizing K+ channels, in addition to the Kv2 channels that were directly blocked. Indeed, it is conceivable (but not probable) that all the slowing of the spike repolarization may be entirely the result of such indirect effects. Modelling is needed to quantitatively test these ideas.
Blockade of Kv2 channels and its effects on spike repolarization, interspike trajectories and Na+ channel availability was probably also the main cause of the observed reduction in maintained firing during higher spike rates (Fig. 4), as previously suggested in other cell types (Du et al. 2000; Gu et al. 2007; Johnston et al. 2008; Guan et al. 2013; Liu & Bean, 2014).
Significance of spike after‐potentials
In the hippocampus, ADPs and AHPs play an important role in shaping spike firing patterns (Storm, 1987; Azouz et al. 1996; Yue & Yaari, 2004; Gu et al. 2005) and regulate bursting, which is a characteristic mode of spike firing in vivo (Kandel & Spencer, 1961; Ranck, 1975). Furthermore, postsynaptic bursting paired with presynaptic activity is often required for induction of long‐term potentiation (Magee & Johnston, 1997; Thomas et al. 1998), which is considered to be a major cellular mechanism for learning and memory (Lisman, 1997).
Moreover, attractor network models implemented with realistic after‐spike dynamics have been shown to express phase precession, indicating that conductances controlling the amplitude and duration of the mAHP might play an important role in grid field formation (Navratilova et al. 2012). In the model proposed by Navratilova et al. (2012), the mAHP resets the network activity and the subsequent rebound potential allows a new activity bump of neurons active at a particular time ago (corresponding to the mAHP duration). Given that blockade of Kv2 channels decreases the intracluster frequency by reducing the rebound potential, we hypothesize that this effect would cause an increased size of the grid field in vivo, as shown in previous modelling and experimental work (Navratilova et al. 2012; Giocomo et al. 2011). The reduced rebound potential and excitability after Kv2 blockade could slow down phase precession, thus disrupting the optimal time window for long‐term potentiation and leading to impairment in spatial memory (Skaggs et al. 1996). Interestingly, in vivo juxtacellular recordings of mEC SCs showed that these cells do not normally produce bursts when the animal passes through the corresponding grid fields (Ebbesen et al. 2016). Our findings suggest that the cell‐specific absence of bursting might depend on the expression of Kv2 channels in SCs.
Previous work showed that different potassium currents regulate spike after‐potentials and bursting in hippocampal pyramidal cells, including Kv7/M‐type K+ current (Storm, 1989; Yue & Yaari, 2004; Gu et al. 2005), calcium‐activated K+ current (Storm, 1987; Storm, 1989), A‐type K+ current (Magee & Carruth, 1999) and D‐type K+ current (Metz et al. 2007).However, less is known about the role of K+ currents in mEC. One study reported that blockade of Kv7/M‐channels with linopirdine had only weak or no effects on ADP and intrinsic firing patterns in LII SCs but strongly increased ADP and bursting in LII/III non‐SCs (Yoshida & Alonso, 2007). A recent study showed that blockade of Kv7/M‐channels with XE991 increased the excitability of SCs (Nigro et al. 2014) but did not induce bursting as seen in other cell types (Yue & Yaari, 2004; Gu et al. 2005; Yoshida & Alonso, 2007). Kv2 channels are located mainly in the perisomatic compartments of cortical pyramidal cells (Murakoshi & Trimmer, 1999; Guan et al. 2007), where their control over cellular excitability is maximal. Our nucleated patch data show that also in mEC SCs Kv2 channels are located in the soma where these channels can exert a powerful control over ADPs, which can potentially be generated by a subthreshold sodium current or by dendritic T‐type Ca2+‐channels (Alessi et al. 2016).
Our present results, combined with those of Nigro et al. 2014, indicate that Kv2 channels are far more important than Kv7/M‐channels for regulation of ADPs and bursting in LII SCs. This division of labour between Kv2 and Kv7 probably has a strong impact on how acetylcholine, which blocks Kv7/M‐channels, and several other neuromodulators involved in arousal and memory, affect the response patterns in SCs vs. other cell types in mEC.
Modulation of Kv2 channel activity and role in disease
Previous work showed that the subcellular localization and biophysical properties of Kv2 channels are modulated by activation of glutamate receptors and an increase in intracellular Ca2+ levels (Misonou et al. 2004; Mohapatra et al. 2009) and cholinergic receptors (Mohapatra & Trimmer, 2006), nitric‐oxide associated pathways (Steinert et al. 2011), small ubiquitin like‐proteins (Plant et al. 2011) and cyclin E1 during ischaemia (Shah et al. 2014). In CA1 pyramidal neurons, modulation of the Kv2 channels by glutamate receptors tends to enhance the impact of the Kv2–mediated current (I K) by inducing a hyperpolarizing shift in its activation range (Misonou et al. 2004), thus causing a decrease in spike firing (Mohapatra et al. 2009). This has been associated with homeostatic regulation of neuronal excitability during epileptic seizures and ischaemia (Misonou et al. 2005; Misonou, 2010).
Our present data suggest that Kv2 channels serve to control excitability and bursting in SCs at physiological spike rates (Figs 4 A–C and 5). Thus, an increase in Kv2 activity by neuromodulation may further modulate excitability, and therefore also control excitotoxic injury during pathological conditions. By contrast, Kv2 channels can also promote neuronal apoptosis by cellular K+ efflux (Pal et al. 2003), as observed after stroke and in Alzheimer's disease (Cotella et al. 2012; Shah & Aizenman, 2014). Interestingly, neuropathological changes found in Alzheimer's disease start in the entorhinal cortex (Braak & Braak, 1991), although the possible roles of Kv2 channels remain to be determined. However, a recent study reported that afterspike dynamics and clustering are affected in the dorsal mEC in a mouse model of tauopathy (Booth et al. 2016).
In conclusion, we used GTx to characterize the properties and functions of the delayed rectifier current generated by Kv2 channels in mEC LII SCs. We found indications that these channels have multiple functions, including thhe control of spike waveform, spike after‐potentials, excitability, bursting and repetitive firing. GTx appears to be a useful tool for studying the functional roles of Kv2 channels, and may serve to further clarify their functional roles in the mEC and other parts of the cortex, as well as the possible involvement of this channel type in the representation of space, memory, dementia and epilepsy. Our results will hopefully also contribute to a more accurate computational modelling and understanding of grid cell mechanisms.
Additional information
Competing interests
The authors declare that they have no competing interests.
Author contributions
MJN, CH and JFS designed the experiments. CH and MJN performed the experiments. CH and MJN performed the data analysis. CH, MJN and JFS wrote the manuscript. All authors have approved the final version of the manuscript and agree to be accountable for all aspects of the work. All persons designated as authors qualify for authorship, and all those who qualify for authorship are listed. All authors have approved the final version of the manuscript and agree to be accountable for all aspects of the work. All persons designated as authors qualify for authorship, and all those who qualify for authorship are listed.
Funding
This study was supported by the Norwegian Research Council and the University of Oslo.
Acknowledgements
We thank Dr Ricardo Murphy, Dr Hua Hu and other members of the Storm laboratory for helpful discussions and comments on the manuscript.
References
- Alessi C, Raspanti A, Magistretti J (2016). Two distinct types of depolarizing afterpotentials are differentially expressed in stellate and pyramidal‐like neurons of entorhinal‐cortex layer II. Hippocampus 26,380–404. [DOI] [PubMed] [Google Scholar]
- Alonso A & Klink R (1993). Differential electroresponsiveness of stellate and pyramidal‐like cells of medial entorhinal cortex layer II. J Neurophysiol 70, 128–143. [DOI] [PubMed] [Google Scholar]
- Alonso A & Llinas RR (1989). Subthreshold Na+‐dependent theta‐like rhythmicity in stellate cells of entorhinal cortex layer II. Nature 342, 175–177. [DOI] [PubMed] [Google Scholar]
- Azouz R, Jensen MS, & Yaari Y (1996). Ionic basis of spike after‐depolarization and burst generation in adult rat hippocampal CA1 pyramidal cells. J Physiol 492, 211–223. [DOI] [PMC free article] [PubMed] [Google Scholar]
- Bishop HI, Guan D, Bocksteins E, Parajuli LK, Murray KD, Cobb MM, Misonou H, Zito K, Foehring RC, & Trimmer JS (2015). Distinct cell‐ and layer specific expression patterns and independent regulation of Kv2 channel subtypes in cortical pyramidal neurons. J Neurosci 35,14922–14942. [DOI] [PMC free article] [PubMed] [Google Scholar]
- Booth CA, Ridler T, Murray TK, Ward MA, de Groot E, Goodfellow M, Phillips KG, Randall AD, Brown JT (2016). Electrical and network neuronal properties are preferentially disrupted in dorsal, but not ventral, medial entorhinal cortex in a mouse model of tauopathy. J Neurosci 36,312–324. [DOI] [PMC free article] [PubMed] [Google Scholar]
- Braak H & Braak E (1991). Neuropathological stageing of Alzheimer‐related changes. Acta Neuropathol 82, 239–259. [DOI] [PubMed] [Google Scholar]
- Burwell R (2000). The parahippocampal region: corticocortical connectivity. Ann NY Acad Sci 911, 25–42. [DOI] [PubMed] [Google Scholar]
- Buzsaki G & Moser EI (2013). Memory, navigation and theta rhythm in the hippocampal‐entorhinal system. Nat Neurosci 16, 130–138. [DOI] [PMC free article] [PubMed] [Google Scholar]
- Cotella D, Hernandez‐Enriquez B, Wu X, Li R, Pan Z, Leveille J, Link CD, Oddo S, & Sesti F (2012). Toxic role of K+ channel oxidation in mammalian brain. J Neurosci 32, 4133–4144. [DOI] [PMC free article] [PubMed] [Google Scholar]
- Deng PY, Poudel SK, Rojanathammanee L, Porter JE, & Lei S (2007). Serotonin inhibits neuronal excitability by activating two‐pore domain K+ channels in the entorhinal cortex. Mol Pharmacol 72, 208–218. [DOI] [PubMed] [Google Scholar]
- Dickson CT, Magistretti J, Shalinsky MH, Fransén E, Hasselmo ME, & Alonso A (2000). Properties and role of Ih in the pacing of subthreshold oscillations in entorhinal cortex layer II neurons. J Neurophysiol 83, 2562–2579. [DOI] [PubMed] [Google Scholar]
- Domnisoru C, Kinkhabwala AA, & Tank DW (2013). Membrane potential dynamics of grid cells. Nature 495, 199–204. [DOI] [PMC free article] [PubMed] [Google Scholar]
- Du J, Haak LL, Phillips‐Tansey E, Russell JT, & McBain CJ (2000). Frequency‐dependent regulation of rat hippocampal somato‐dendritic excitability by the K+ channel subunit Kv2.1. J Physiol 522, 19–31. [DOI] [PMC free article] [PubMed] [Google Scholar]
- Ebbesen CL, Reifenstein ET, Tang Q, Burgalossi A, Ray S, Schreiber S, Kempter R, & Brecht M (2016) . Cell‐type specific differences in spike timing and spike shape in the rat parasubiculum and superficial medial entorhinal cortex. Cell Rep 16,1005–1015. [DOI] [PMC free article] [PubMed] [Google Scholar]
- Eder C, Ficker E, Gündel J, & Heinemann U (1991). Outward currents in rat entorhinal cortex stellate cells studied with conventional and perforated patch recordings. Eur J Neurosci 3, 1271–1280. [DOI] [PubMed] [Google Scholar]
- Eder C & Heinemann U (1994). Current density analysis of outward currents in acutely isolated rat entorhinal cortex cells. Neurosci Lett 174, 58–60. [DOI] [PubMed] [Google Scholar]
- Eder C & Heinemann U (1996). Potassium currents in acutely isolated neurons from superficial and deep layers of the juvenile rat entorhinal cortex. Pflügers Arch 432, 637–643. [DOI] [PubMed] [Google Scholar]
- Garden DLF, Dodson PD, O'Donnell C, White MD, & Nolan MF (2008). Tuning of synaptic integration in the medial entorhinal cortex to the organization of grid cell firing fields. Neuron 60, 875–889. [DOI] [PubMed] [Google Scholar]
- Giocomo LM, Zilli EA, Fransen E, & Hasselmo ME (2007). Temporal frequency of subthreshold oscillations scales with entorhinal grid cell field spacing. Science 315, 1719–1722. [DOI] [PMC free article] [PubMed] [Google Scholar]
- Giocomo LM & Hasselmo ME (2008). Time constants of h current in layer II stellate cells differ along the dorsal to ventral axis of medial entorhinal cortex. J Neurosci 28, 9414–9425. [DOI] [PMC free article] [PubMed] [Google Scholar]
- Giocomo LM, Moser MB, Moser EI (2011). Computational models of grid cells. Neuron 25, 589–603. [DOI] [PubMed] [Google Scholar]
- Grundy D (2015). Principles and standards for reporting animal experiments in J Physiol and Experimental Physiology . J Physiol 593, 2547–2549. [DOI] [PMC free article] [PubMed] [Google Scholar]
- Gu N, Vervaeke K, Hu H, & Storm JF (2005). Kv7/KCNQ/M and HCN/h, but not KCa2/SK channels, contribute to the somatic medium after‐hyperpolarization and excitability control in CA1 hippocampal pyramidal cells. J Physiol 566, 689–715. [DOI] [PMC free article] [PubMed] [Google Scholar]
- Gu N, Vervaeke K, & Storm JF (2007). BK potassium channels facilitate high‐frequency firing and cause early spike frequency adaptation in rat CA1 hippocampal pyramidal cells. J Physiol 580, 859–882. [DOI] [PMC free article] [PubMed] [Google Scholar]
- Guan D, Tkatch T, Surmeier DJ, Armstrong WE, & Foehring RC (2007). Kv2 subunits underlie slowly inactivating potassium current in rat neocortical pyramidal neurons. J Physiol 581, 941–960. [DOI] [PMC free article] [PubMed] [Google Scholar]
- Guan D, Armstrong WE, & Foehring RC (2013). Kv2 channels regulate firing rate in pyramidal neurons from rat sensorimotor cortex. J Physiol 591, 4807–4825. [DOI] [PMC free article] [PubMed] [Google Scholar]
- Haas JS & White JA (2002). Frequency selectivity of layer II stellate cells in the medial entorhinal cortex. J Neurophysiol 88, 2422–2429. [DOI] [PubMed] [Google Scholar]
- Hafting T, Fyhn M, Molden S, Moser MB, & Moser EI (2005). Microstructure of a spatial map in the entorhinal cortex. Nature 436, 801–806. [DOI] [PubMed] [Google Scholar]
- Herrington J, Zhou YP, Bugianesi RM, Dulski PM, Feng Y, Warren VA, Smith MM, Kohler MG, Garsky VM, Sanchez M, Wagner M, Raphaelli K, Banerjee P, Ahaghotu C, Wunderler D, Priest BT, Mehl JT, Garcia ML, McManus OB, Kaczorowski GJ, & Slaughter RS (2006). Blockers of the delayed‐rectifier potassium current in pancreatic ß‐cells enhance glucose‐dependent insulin secretion. Diabetes 55, 1034–1042. [DOI] [PubMed] [Google Scholar]
- Hönigsperger C, Nigro MJ, & Storm JF. Physiological roles of Kv2 channels in entorhinal cortex layer II cells revealed by Guangxitoxin‐1E Program No 320.03. Neuroscience 2013. Abstracts, San Diego, Society for Neuroscience, 2013. Online.
- Johnston J, Griffin SJ, Baker C, Skrzypiec A, Chernova T, Forsythe ID (2008). Initial segment Kv2.2 channels mediate a slow delayed rectifier and maintain high frequency action potential firing in medial nucleus of the trapezoid body neurons. J Physiol 586,3493–3509. [DOI] [PMC free article] [PubMed] [Google Scholar]
- Kandel ER & Spencer WA (1961). Electrophysiology of hippocampal neurons: II. after‐potentials and repetitive firing. J Neurophysiol 24, 243–259. [DOI] [PubMed] [Google Scholar]
- Khawaja FA, Alonso AA, & Bourque CW (2007). Ca2+‐dependent K+ currents and spike‐frequency adaptation in medial entorhinal cortex layer II stellate cells. Hippocampus 17, 1143–1148. [DOI] [PubMed] [Google Scholar]
- Lisman JE (1997). Bursts as a unit of neural information: making unreliable synapses reliable. Trends Neurosci 20, 38–43. [DOI] [PubMed] [Google Scholar]
- Liu PW & Bean BP (2014). Kv2 channel regulation of action potential repolarization and firing patterns in superior cervical ganglion neurons and hippocampal CA1 pyramidal neurons. J Neurosci 34, 4991–5002. [DOI] [PMC free article] [PubMed] [Google Scholar]
- Magee JC & Carruth M (1999). Dendritic voltage‐gated ion channels regulate the action potential firing mode of hippocampal CA1 pyramidal neurons. J Neurophysiol 82, 1895–1901. [DOI] [PubMed] [Google Scholar]
- Magee JC & Johnston D (1997). A synaptically controlled, associative signal for hebbian plasticity in hippocampal neurons. Science 275, 209–213. [DOI] [PubMed] [Google Scholar]
- Malin SA & Nerbonne JM (2002). Delayed rectifier K+ currents,I K, are encoded by Kv2 α‐subunits and regulate tonic firing in mammalian sympathetic neurons. J Neurosci 22, 10094–10105. [DOI] [PMC free article] [PubMed] [Google Scholar]
- Metz AE, Spruston N, & Martina M (2007). Dendritic D‐type potassium currents inhibit the spike afterdepolarization in rat hippocampal CA1 pyramidal neurons. J Physiol 581, 175–187. [DOI] [PMC free article] [PubMed] [Google Scholar]
- Misonou H (2010). Homeostatic regulation of neuronal excitability by K+ channels in normal and diseased brains. Neuroscientist 16, 51–64. [DOI] [PubMed] [Google Scholar]
- Misonou H, Mohapatra DP, Park EW, Leung V, Zhen D, Misonou K, Anderson AE, & Trimmer JS (2004). Regulation of ion channel localization and phosphorylation by neuronal activity. Nat Neurosci 7, 711–718. [DOI] [PubMed] [Google Scholar]
- Misonou H, Mohapatra DP, & Trimmer JS (2005). Kv2.1: a voltage‐gated K+ channel critical to dynamic control of neuronal excitability. Neurotoxicology 26, 743–752. [DOI] [PubMed] [Google Scholar]
- Mohapatra DP, Misonou H, Pan SJ, Held JE, Surmeier DJ, & Trimmer JS (2009). Regulation of intrinsic excitability in hippocampal neurons by activity‐dependent modulation of the Kv2.1 potassium channel. Channels (Austin) 3, 46–56. [DOI] [PMC free article] [PubMed] [Google Scholar]
- Mohapatra DP & Trimmer JS (2006). The Kv2.1 C terminus can autonomously transfer Kv2.1‐like phosphorylation‐dependent localization, voltage‐dependent gating, and muscarinic modulation to diverse Kv channels. J Neurosci 26, 685–695. [DOI] [PMC free article] [PubMed] [Google Scholar]
- Moser EI, Roudi Y, Witter MP, Kentros C, Bonhoeffer T, & Moser MB (2014). Grid cells and cortical representation. Nat Rev Neurosci 15, 466–481. [DOI] [PubMed] [Google Scholar]
- Murakoshi H & Trimmer JS (1999). Identification of the Kv2.1 K+ channel as a major component of the delayed rectifier K+ current in rat hippocampal neurons. J Neurosci 19, 1728–1735. [DOI] [PMC free article] [PubMed] [Google Scholar]
- Navratilova Z, Giocomo LM, Fellous JM, Hasselmo ME, & McNaughton BL (2012). Phase precession and variable spatial scaling in a periodic attractor map model of medial entorhinal grid cells with realistic after‐spike dynamics. Hippocampus 22, 772–789. [DOI] [PubMed] [Google Scholar]
- Nigro MJ, Mateos‐Aparicio P, & Storm JF (2014). Expression and functional roles of Kv7/KCNQ/M‐channels in rat medial entorhinal cortex layer II stellate cells. J Neurosci 34, 6807–6812. [DOI] [PMC free article] [PubMed] [Google Scholar]
- Nolan MF, Dudman JT, Dodson PD, & Santoro B (2007). HCN1 channels control resting and active integrative properties of stellate cells from layer II of the entorhinal cortex. J Neurosci 27, 12440–12451. [DOI] [PMC free article] [PubMed] [Google Scholar]
- Norris AJ & Nerbonne JM (2010). Molecular dissection of IA in cortical pyramidal neurons reveals three distinct components encoded by Kv4.2, Kv4.3, and Kv1.4 α‐subunits. J Neurosci 30, 5092–5101. [DOI] [PMC free article] [PubMed] [Google Scholar]
- Pal S, Hartnett KA, Nerbonne JM, Levitan ES, & Aizenman E (2003). Mediation of neuronal apoptosis by Kv2.1‐encoded potassium channels. J Neurosci 23, 4798–4802. [DOI] [PMC free article] [PubMed] [Google Scholar]
- Pastoll H, Ramsden H, & Nolan MF (2012). Intrinsic electrophysiological properties of entorhinal cortex stellate cells and their contribution to grid cell firing fields. Front Neural Circuits 6, 17. [DOI] [PMC free article] [PubMed] [Google Scholar]
- Pathak D, Guan D, & Foehring RC (2016). Roles of specific Kv channels in repolarization of the action potential in genetically identified subclasses of pyramidal neurons in mouse neocortex. J Neurophysiol 115, 2317–2329. [DOI] [PMC free article] [PubMed] [Google Scholar]
- Plant LD, Dowdell EJ, Dementieva IS, Marks JD, & Goldstein SAN (2011). SUMO modification of cell surface Kv2.1 potassium channels regulates the activity of rat hippocampal neurons. J Gen Physiol 137, 441–454. [DOI] [PMC free article] [PubMed] [Google Scholar]
- Ranck J (1975). Behavioral correlates and firing repertoires of neurons in the dorsal hippocampal formation and septum of unrestrained rats In The Hippocampus, eds. Isaacson R. & Pribram K, pp. 207–244. Springer, New York, NY. [Google Scholar]
- Schmidt‐Hieber C & Hausser M (2013). Cellular mechanisms of spatial navigation in the medial entorhinal cortex. Nat Neurosci 16, 325–331. [DOI] [PubMed] [Google Scholar]
- Schwarcz R & Witter MP (2002). Memory impairment in temporal lobe epilepsy: the role of entorhinal lesions. Epilepsy Res 50, 161–177. [DOI] [PubMed] [Google Scholar]
- Shah NH, Schulien AJ, Clemens K, Aizenman TD, Hageman TM, Wills ZP, & Aizenman E (2014). Cyclin E1 regulates Kv2.1 channel phosphorylation and localization in neuronal ischemia. J Neurosci 34, 4326–4331. [DOI] [PMC free article] [PubMed] [Google Scholar]
- Shah NH & Aizenman E (2014). Voltage‐gated potassium channels at the crossroads of neuronal function, ischemic tolerance, and neurodegeneration. Transl Stroke Res 5, 38–58. [DOI] [PMC free article] [PubMed] [Google Scholar]
- Skaggs WE, McNaughton BL, Wilson MA, Barnes CA (1996). Theta phase precession in hippocampal neuronal populations and the compression of temporal sequences. Hippocampus 6,149–172. [DOI] [PubMed] [Google Scholar]
- Steinert J, Robinson S, Tong H, Haustein M, Kopp‐Scheinpflug C, & Forsythe I (2011). Nitric oxide is an activity‐dependent regulator of target neuron intrinsic excitability. Neuron 71, 291–305. [DOI] [PMC free article] [PubMed] [Google Scholar]
- Storm JF (1987). Action potential repolarization and a fast after‐hyperpolarization in rat hippocampal pyramidal cells. J Physiol 385, 733–759. [DOI] [PMC free article] [PubMed] [Google Scholar]
- Storm JF (1989). An after‐hyperpolarization of medium duration in rat hippocampal pyramidal cells. J Physiol 409, 171–190. [DOI] [PMC free article] [PubMed] [Google Scholar]
- Storm JF (1990). Chapter 12 Potassium currents in hippocampal pyramidal cells In Progress in Brain Research. Understanding the brain through the hippocampus. The hippocampal region as a model for studying brain structure and function, ed. Storm‐Mathisen J, pp. 161–187. Elsevier, Amsterdam. [DOI] [PubMed] [Google Scholar]
- Tamamaki N & Nojyo Y (1993). Projection of the entorhinal layer II neurons in the rat as revealed by intracellular pressure‐injection of neurobiotin. Hippocampus 3, 471–480. [DOI] [PubMed] [Google Scholar]
- Thomas MJ, Watabe AM, Moody TD, Makhinson M & O'Dell TJ (1998). Postsynaptic complex spike bursting enables the induction of LTP by theta frequency synaptic stimulation. J Neurosci 18, 7118–7126. [DOI] [PMC free article] [PubMed] [Google Scholar]
- Yoshida M & Alonso A (2007). Cell‐type‐specific modulation of intrinsic firing properties and subthreshold membrane oscillations by the M(Kv7)‐current in neurons of the entorhinal cortex. J Neurophysiol 98, 2779–2794. [DOI] [PubMed] [Google Scholar]
- Yue C & Yaari Y (2004). KCNQ/M channels control spike afterdepolarization and burst generation in hippocampal neurons. J Neurosci 24, 4614–4624. [DOI] [PMC free article] [PubMed] [Google Scholar]