Abstract.
We propose a three-dimensional (3-D) registration method to correct motion artifacts and construct the volume structure for angiographic and structural optical coherence tomography (OCT). This algorithm is particularly suitable for the nonorthogonal wide-field OCT scan acquired by a ultrahigh-speed swept-source system ( A-scan rate). First, the transverse motion artifacts are corrected by the between-frame registration based on en face OCT angiography (OCTA). After A-scan transverse translation between B-frames, the axial motions are corrected based on the rebuilt boundary of inner limiting membrane. Finally, a within-frame registration is performed for local optimization based on cross-sectional OCTA. We evaluated this algorithm on retinal volumes of six normal subjects. The results showed significantly improved retinal smoothness in 3-D-registered structural OCT and image contrast on en face OCTA.
Keywords: optical coherence tomography, wide-field, three-dimensional registration, image processing
1. Introduction
Optical coherence tomography (OCT) uses interferometric analysis of low-coherence light to provide depth-resolved micrometer-resolution images of tissue, such as retina and optic nerve head.1 Clinically, both cross-sectional (B-frame) and three-dimensional (3-D) structural OCT are useful for detecting and monitoring anatomic alterations. With the increase of OCT imaging speed,2,3 an OCT angiography (OCTA) technique was developed.4–14 Multiple B-frames can be taken on the same position, and the changes of OCT reflectance properties can be measured to differentiate vasculature from static tissues. These B-frames can also be averaged to generate structural OCT images.
Multiple B-frames taken in the slow transverse direction can create a volumetric scan. A single volumetric scan usually takes 3 to 5 s, during which involuntary eye movements, such as microsaccades and saccades, can introduce motion artifacts.15–17 They appear as discontinuities on the en face projection of OCT volume and bright lines (saturated signals) on the en face OCTA. These large and rapid eye motions on the transverse direction can be mitigated by adding retinal tracking modality, such as scanning laser ophthalmoscope and infrared fundus video camera that can detect image shifts, pause the OCT scan, and then resume the scan at the proper position.18–23 Eye tracking strategy can reduce the discontinuities on en face images, but it cannot correct mild transverse or any axial motion. The remaining motion artifacts show as bright lines on en face OCTA. Therefore, additional processing is required to eliminate these lines.
Two-dimensional (2-D) registration algorithms have been developed to reduce motion in en face OCTA—one using the orthogonal method (registration of -fast and -fast en face angiograms)24 and one using the parallel method (registration of two -fast en face angiograms).25 These methods are simple and fast. However, they cannot correct motion on volumetric data, and the distortion of angiographic and structural B-frames on slow axis cannot be removed. Correction of motion artifacts on the volumetric data not only provides clinically useful cross-sectional images along slow axis but also improves the segmentation efficiency on retinal layers. In addition, a motion-corrected OCT volume can improve volume rendering of the retinal vasculature, the optic disc, and the fovea.
One successful algorithm for motion correction on OCT volume is the 3-D orthogonal method.26 It combines the information in -fast and -fast volumetric raster scans and registered A-scans individually by finding a 3-D motion field that minimizes an energy function. This algorithm has been adopted in the commercial Avanti OCT system (Optovue, Inc., Fremont, California) to register angiographic and structural OCT data by detecting the motions calculated from 3-D structural OCT. Although this technology greatly improves the merged scan quality, residual lines can still persist on OCTA.
In this study, we propose a 3-D registration algorithm for OCT volume based on both angiographic and structural OCT information. The vasculature on en face retinal OCTA is used for transverse registration, and the inner limiting membrane (ILM) boundary on structural OCT is taken as the reference for axial registration. Building on our previous work on parallel registration suitable for the ultrahigh-speed OCT (above 200 kHz), this algorithm will provide a comprehensive registration system for automated volume rebuilding in wide-field angiographic and structural OCT.
2. Method
2.1. Study Population
This study was conducted at the Casey Eye Institute, the Oregon Health and Science University. The study adhered to the tenets of the Declaration of Helsinki and was approved by the Institutional Review Board. Six healthy participants (aged ) were recruited for the study.
2.2. Image Acquisition
A 200-kHz prototype swept-source OCT system was used in this study. The source laser had a center wavelength of 1045 nm and a tuning range of (Axsun Technologies Inc., Billerica, Massachusetts). A dual-balanced detector (PDB471C, Thorlabs Inc.) converted the optical signal to electrical signal, and a high-speed digitizer (ATS 9360, Alazar Technologies Inc., Pointe-Claire, Quebec) acquired the electrical signal. The resulting system had an axial resolution of in air, a lateral resolution of , and an extended axial imaging range of 7 mm. The light exposure at the cornea was 1.4 mW, within the American National Standards Institute safety limit.27
Two () mm volumetric -fast scans were captured at the same region of posterior pole including the macula and the disc in each eye. Each volume consisted of 800 B-frames, composed of a set of 850 A-lines acquired twice at each of the 400 raster positions. This yielded a lateral sampling density of along the fast transverse scan axis and along the slow axis. One volumetric scan was acquired in approximately 4 s.
Structural OCT data were obtained by averaging the two B-frames acquired at the same raster position. The split-spectrum amplitude-decorrelation angiography algorithm4 was used to calculate OCTA data. The boundaries of ILM and outer plexiform layer (OPL) were detected on each B-frame by directional graph search method.28 The en face retinal angiogram was generated by using the maximum decorrelation value along the axial direction within a slab between ILM and OPL.
2.3. Volumetric Registration Algorithm
This proposed method is composed of four main steps (Fig. 1). First, the transverse motion artifacts on en face retinal OCTA are corrected by an affine registration algorithm on the parallel microsaccade-free strips. This step corrects the motion artifacts between B-frames caused by translational, rotational, and focusing differences (Fig. 2).25 Each A-line of reflectance and decorrelation signal in the volumetric OCT is translated based on the transformation matrix of the corresponding strip. Then, the ILM boundaries on the new transformed slow axis B-frames at the same position in each volume are averaged and smoothed to recover a motion-free ILM boundary. Based on this new boundary, each pair of A-line was initially registered along the axial direction at each B-frame. The final axial position of each A-line was fine-tuned by correlation of reflectance of each pair of A-line. Next, a registration based on cross-sectional OCTA was applied between each pair of fast axis B-frame to refine the final transverse position of each A-line. Lastly, two volumes of structural OCT and OCTA were averaged and merged, respectively, to produce the final motion-corrected volumes.
Fig. 1.
The flow chart of the 3-D registration and volume rebuilding algorithm.
Fig. 2.
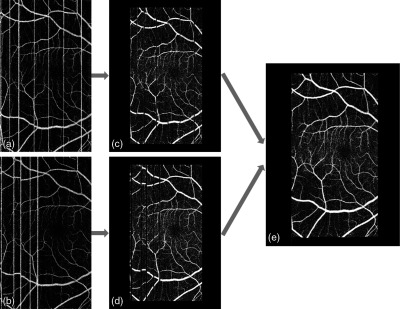
The schematic diagram of the between-frame registration process between two -fast volumetric scans. (a) First en face OCTA. The white vertical line artifacts are caused by microsaccadic bulk motion. (b) Second en face OCTA. (c, d) The microsaccadic line artifacts are detected and removed, leaving intermicrosaccadic strips for registration. (e) The merged en face OCTA after affine registration of the strips.
2.3.1. Between-frame registration
We first detected and removed the large motion artifacts shown as bright lines on en face OCTA. The algorithm detected these bright line artifacts as projected B-frames with summed flow signal above the threshold, set as 2.3 standard deviations above the mean. Then en face angiogram was divided into microsaccade-free strips at the detected motion lines [Figs. 2(c) and 2(d)]. We initiated the registration process on two strips, one from each scan that contains the largest overlap. Using the larger of the two strips as the reference strip and the other as the moving strip, we applied the affine registration algorithm. It utilizes a gradient descent to search for a similarity transformation, which allows translation, scaling, rotation, and skewing within the transverse () plane. The goal is to find a transformation of the moving strip that minimizes the squared difference of the reference vasculature and transformed moving vasculature
| (1) |
where is the pixel coordinate, is a vector of transformation parameters, is the reference vasculature, is the moving vasculature, and is the transformation matrix. This minimization can be solved iteratively. The new registered and merged strip was then defined as the new reference strip and the strip with the largest overlap with the new reference strip as the new moving strip. The process was repeated until all strips were registered and merged into one comprehensive en face OCTA image [Fig. 2(e)].
This step provides the transverse transform matrix. Each A-line of the first and second volumetric structural OCT and OCTA was translated, and the between-frame transformation was completed.
2.3.2. Rebuilding of the inner limiting membrane boundary
Next, the ILM boundary was rebuilt by merging and smoothing ILM boundaries on two transformed volumetric structural OCT.28 This rebuilding process was performed in the slow axis and included three steps: first, a pair of slow axis ILM boundaries from each volume was adjusted to the closest position [Figs. 3(a) and 3(b)]. In this step, the ILM boundary from the reference volume is the reference boundary , and the ILM boundary from the moving volume is the moving boundary . The newly moved boundary was obtained when the moving boundary adjusted to the closest position to the reference boundary based on the below equation:
| (2) |
where is the displacement of the , is the cost function, is the number of the A-line in corresponding slow axis B-frame, and the optimized displacement is selected when the cost function achieves the smallest value. The height profiles of reference boundary and the moved boundary were averaged to generate the initial merged ILM boundary [Fig. 3(c)]
| (3) |
Fig. 3.
The rebuilding process of the ILM boundary height profile along the (slow)-axis. (a) The original reference (red) and moving (yellow) boundaries. (b) The transformed moving boundary (yellow) is translated to match the reference boundary (red) in average height. (c) The average height profile (green) of the reference (red) and transformed moving (yellow) boundary. (d) The average height profile is smoothed using a moving average filter to obtain the final ILM boundary (green).
Then, the final rebuilt ILM boundary of this B-frame was obtained after a smooth process on
| (4) |
where sp is the smooth parameter and means round down [Fig. 3(d)].
2.3.3. Axial registration
After the rebuilt, the ILM boundary was obtained, and each A-line of two OCT and OCTA volumes was translated based on the displacement between and corresponding ILM boundary
| (5) |
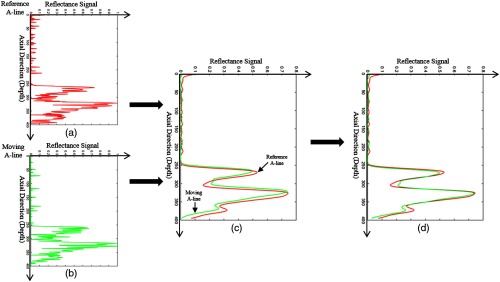
where and are the displacement of each A-line in reference and moving volumes, respectively, and is the coordinate of each A-line. Each A-line was then translated based on the corresponding displacements. To reduce the registration error caused by ILM segmentation, another registration between these two A-lines was applied to fine-tune the axial final positions. Before the registration, the reflectance of two A-lines [Figs. 4(a) and 4(b)] was first normalized to [0, 1] and filtered by a pixel Gaussian filter with 5 pixel standard deviation [Fig. 4(c)]. The registration was optimized by a cost function
| (6) |
where is the cost function of the registration, is the normalized reflectance of the reference A-line, is the normalized reflectance of the moving A-line after a displacement , and is the number of pixel in each A-line. The optimized displacement was selected when the cost function achieved the smallest value. In the final axial registration step, and were translated to and, respectively, [Fig. 4(d)].
Fig. 4.
The axial registration process. (a) The reference A-line of the normalized reflectance signal (red). (b) The moving A-line of the normalized reflectance signal (green). (c) The reference and moving A-line low-pass filtered by the Gaussian function. (d) The moving and reference A-line were registered by minimizing their sum squared difference and shifted to their mean position.
2.3.4. Within-frame registration
To further improve the transverse registration accuracy, a within-frame registration based on the cross-sectional decorrelation signal profile was performed.
The decorrelation signal on each pair of B-frames along (fast)-axis was registered by an affine registration (Fig. 5). Since there were just some small distortions between two initially registered volumes, the ranges of translation, scale, rotation, and skew were limited to , , , and .
Fig. 5.
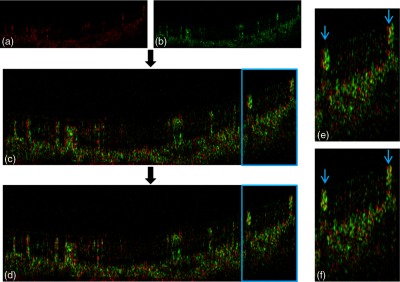
An example of the within-frame registration between a pair of OCTA B-frames. (a) The reference B-frame (flow signal in red). (b) The moving B-frame (green). (c) The moving B-frame is overlaid on the reference B-frame without registration. (d) The two B-frames after affine registration to minimize sum squared difference. The enlarged regions are outlined in blue. (e) Enlargement of panel c showing mismatch in the position of two large vessels (blue arrows). (f) Enlargement of panel d showing registration of the two mismatched vessels.
After the within-frame registration, the final merged volumetric scans were obtained by averaging two registered OCT and OCTA together. A postprocessing, including Gabor filter and multiscale vessel enhancement filter, was performed to improve the image quality of the en face OCTA.29,30
3. Evaluations
The automated volumetric registration of two scans took an average of 7 min. The test was performed on a workstation with Inter(R) Xeon(R) CPU E3-1226 v3 at 3.30 GHz and 16.0 GB RAM using MATLAB® 2014b (Mathworks, Natick, Massachusetts).
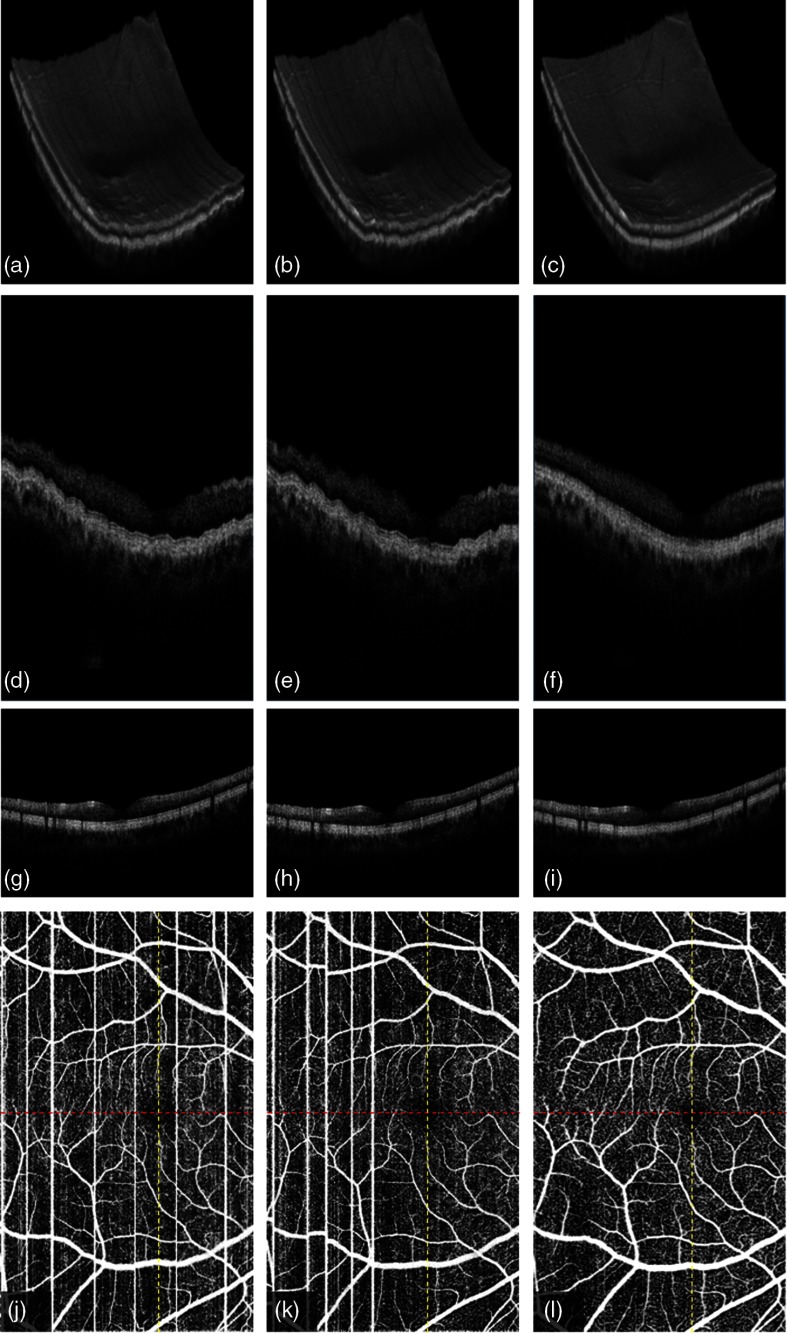
Figure 6 shows the registration results of two -fast scans on central macula. The volumetric rendering of the scan volumes (first row) before and after motion correction shows the surface ripples due to axial motion on the original -fast volume [Figs. 6(a) and 6(b)]. The correction recovers the smoothness of volume surface [Fig. 6(c)]. B-frames on slow axis, seen on the second row, also show the performance of axial registration. The microsaccades along axial direction distort the retinal and choroidal layers in the original B-frames [Figs. 6(d) and 6(e)]. Axial registration recovers the smooth boundaries of retina and choroid, including the outer boundary of the choroid [Fig. 6(f)]. No motion artifact is shown on B-frames along the (fast)-axis [Figs. 6(g) and 6(h)] due to the high A-line rate on the vertical priority. Our results show no registration error is introduced on fast axis in the merged B-frame [Fig. 6(i)], although the axial registration is performed on the slow axis. In addition, the transverse motion artifacts and the vasculature incoherence are all corrected on OCTA [Figs. 6(j)–6(l)].
Fig. 6.
3-D registration of two -fast volumetric OCT and OCTA () of macular region on a normal eye: (a) first volumetric OCT, (b) second volumetric OCT, (c) merged volumetric OCT after the 3-D registration of a and b, (d) the B-frame along (slow)-axis in first volume (red line in j), (e) the B-frame along -axis in second volume (red line in k), (f) the B-frame along -axis in the merged volume (red line in l), (g) the B-frame along (fast)-axis in first volume (yellow line in j), (h) the B-frame along -axis in second volume (yellow line in k), (i) the B-frame along -axis in the merged volume (yellow line in l), (j) first en face OCTA, (k) second en face OCTA, and (l) the merged en face OCTA after 3-D registration of two volumes.
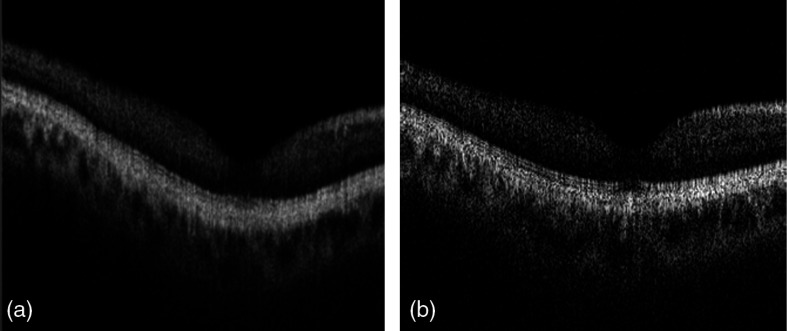
Figure 7 shows that the registered and merged structural B-frame on slow axis crossing fovea mimics the B-frame acquired by -fast scan on the same position of the same eye, indicating that the axial registration based on ILM boundary rebuilding on slow axis resembles the anatomic retinal contour.
Fig. 7.
(a) A comparison of the slow axis B-frame of the merged OCT and (b) the -fast B-frame crossing the fovea, which represents the true contour of the retina.
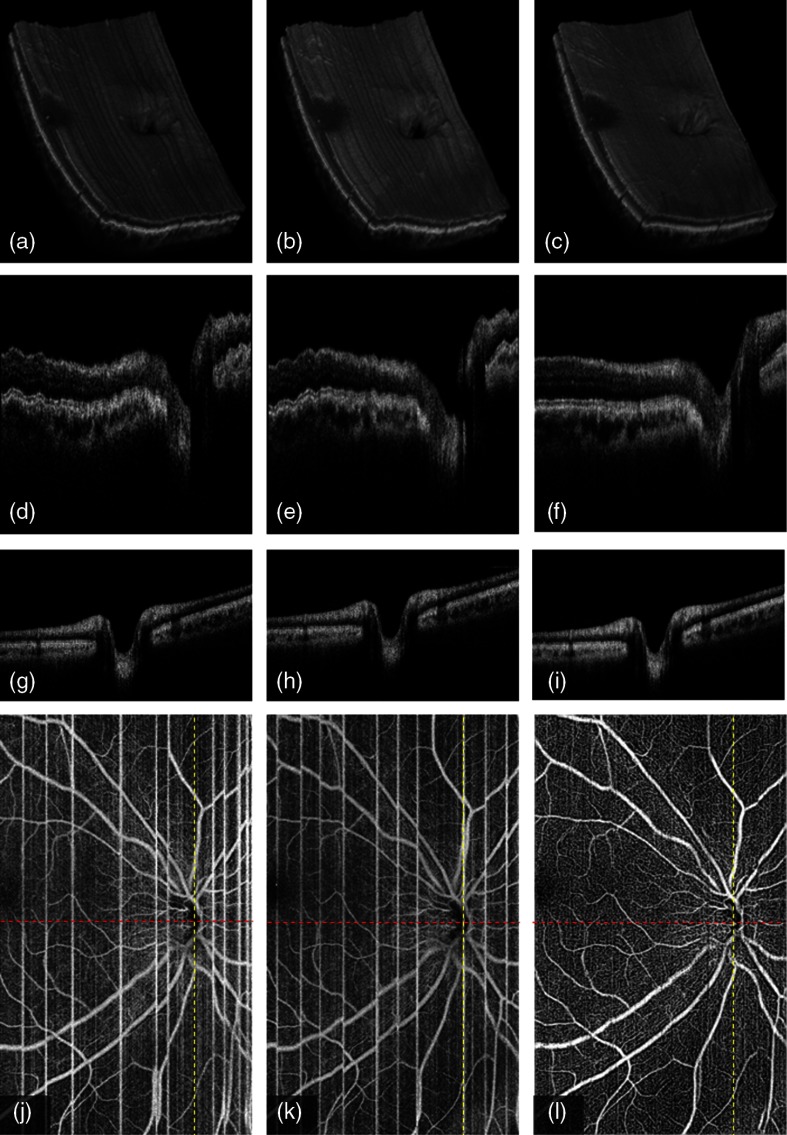
To further demonstrate the stability and adaptability of this method, we also show the registration results on a scan that includes the optic nerve head, which is more complex than the fovea. The registration performance can be globally reviewed by volumetric rendering of the scan volumes before and after registration [Figs. 8(a)–8(c)]. The registered volume shows the even and regular appearance of the optic nerve head and surrounding retina structures. The distorted cross-sectional B-frames on slow axis in the original volumes were corrected in the registered volume [Figs. 8(d)–8(f)]. The image contrast of retinal layers and its microstructures are enhanced. Similar to the original fast axis B-frames, the registered and merged B-frame shows no translation artifacts [Figs. 8(g)–8(i)]. En face OCTA after registration shows more continuous and distinctive vasculature than that in the nonregistered volume. Again, the retinal layer profiles and the regular anatomic microstructures of disc shown in the merged B-frame are highly correlated to the corresponding -fast B-frame on the same position (Fig. 9).
Fig. 8.
3-D registration of two -fast volumetric OCT and OCTA () of disc region on a normal eye: (a) first volumetric OCT, (b) second volumetric OCT, (c) merged volumetric OCT after the 3-D registration of a and b, (d) the B-frame along (slow)-axis in first volume (red line in j), (e) the B-frame along -axis in second volume (red line in k), (f) the B-frame along -axis in the merged volume (red line in l), (g) the B-frame along (fast)-axis in first volume (yellow line in j), (h) the B-frame along -axis in second volume (yellow line in k), (i) the B-frame along -axis in the merged volume (yellow line in l), (j) first en face OCTA, (k) second en face OCTA, and (l) the merged en face OCTA after 3-D registration of two volumes.
Fig. 9.
(a) A comparison of the slow axis of the merged OCT and (b) the -fast B-frame across the optic nerve head, which represents the true contour of the retina.
To quantitatively evaluate the registration accuracy, the average pixel distance (APD) between the ILM boundary of fast axis and the slow axis was calculated using the below equation:
| (7) |
where is the number of the A-line in the overlap region between the fast axis and slow axis B-frames across foveal and disc regions, respectively. This overlap region was obtained after a rigid registration that includes translation and rotation only between a pair of fast axis and slow axis B-frames. This registration is also based on the affine registration using en face OCTA vascular information. To ensure the accuracy of this evaluation, only the B-frames across fovea and disc that have a distinctive structure feature were chosen in this assessment. The comparison to original retinal contours (ILM along fast axis) between registered and original slow axis B-frames is shown in Table 1.
Table 1.
The comparison of APD to fast axis B-frames on slow axis B-frames before and after registration.
| APD (, ) | Before registration | After registration | Decrease (%) |
|---|---|---|---|
| Macula | 21.1 | ||
| Disc | 32.6 |
To quantitatively measure the improvement of contrast on en face OCTA, the root-mean-square (RMS) contrast31 was used and calculated using the below equation:
| (8) |
where is the area of the merged image, is the en face OCTA of the inner retinal slab, and is its mean decorrelation value.
These quantitative analyses demonstrate significant improvement of the retinal structural contour (Table 1) on the structural OCT and the RMS contrast (Table 2) on the en face OCTA.
Table 2.
The comparison of RMS contrast on en face OCTA before and after registration.
| RMS contrast (, ) | Before registration | After registration | Improvement (%) |
|---|---|---|---|
| Macula | 10.3 | ||
| Disc | 33.1 |
4. Discussion
We have developed a 3-D registration method that removes motion artifacts and merges two volumetric angiographic and structural OCT volumes in the same transverse priority. This is well suited for OCTA using ultrahigh-speed OCT. The algorithm effectively eliminates axial and transverse motion artifacts, resulting in smooth volume rendering and high-contrast angiography with excellent vessel continuity.
The main interest of this study is the use of OCTA and structural OCT information separately for transverse and axial registration. To the best of our knowledge, no previous work has used a motion indicator on OCTA to guide volumetric registration. Compared to shadow-graphic pattern of large vessels on en face structural OCT, the detailed vasculature on OCT angiograms provides a better reference for transverse registration. Another advantage of using en face OCTA is that the microsaccade motions have been naturally shown as the bright motion artifact, eliminating the need to compute the cross-correlation between contiguous lines (projected B-frames) to detect this type of motion on en face structural OCT.
Unlike the previously reported orthogonal 3-D registration methods26 using full A-scan profiles, our method performs transverse and axial registration separately to achieve 3-D registration. This strategy allows a more efficient processing, especially on the large scan volume with large number of A-lines.
The transverse registration method in this study differs from our previous work25 in that we did not apply free-form deformation, which is a type of local nonrigid registration, because the translation of A-lines based on this deformation requires much computation time and memory space. Although the registration on the en face direction may not be as accurate as the work reported on 2-D OCTA,25 by adding the within-frame affine registration based on cross-sectional flow profile between each pair of -fast B-frames, we were able to further improve the registration accuracy in 3-D.
To correct the motion in axial direction, we needed to rebuild the anatomic structure on the slow axis. Although we do not have a reference scan with different scan priority, we have demonstrated that the convergence of two B-frames on the slow axis from different OCT volumes can effectively recover a smooth retinal surface. However, the notable limitation of this method is that the registered retinal surface is still a few pixels different from the true retinal contour. This deficit may not be clinically significant because the recovered contour allows for accurate segmentation of retinal sublayers and generation of high-quality en face structural and angiographic images. Moreover, in this step, it is critical to accurately trace ILM boundaries. The large gradient of reflectance between the vitreous and the ILM usually allows accurate segmentation of this boundary. In our study, we applied the directional graph search method28 to further improve the segmentation efficacy.
Finally, this registration method is complementary to a real-time eye tracking function. Even with the acquisition of two volumetric scans, there is still a small probability of gaps occurring in the same place at both volumes, causing registration error and stripe defect in the merged volume. We have recently shown that we can reduce this failure probability to near zero by combining tracking assisted scanning with registration.18 Therefore, the registration algorithms developed by us and other groups would be useful in the correction of residual tracking error.
5. Conclusion
We propose an automated 3-D registration algorithm to remove motion artifacts and merging two volumetric OCT and OCTA scanned by an ultrahigh-speed swept-source OCT. We removed the motion artifacts in the “transverse” direction using the between-frame registration and corrected the “axial” location based on the ILM boundary of the retina. Two volumetric scans were merged after the axial registration and within-frame registration. We demonstrated our algorithm on OCT and OCTA volume including the macula and the disc in healthy volunteers. By improving the volume rendering of the retina and the quality of OCTA, this method may improve the utility of OCT-based ocular imaging.
Acknowledgments
This work was supported by National Institutes of Health under Grants Nos. DP3 DK104397, R01 EY024544, R01 EY023285, and P30 EY010572, the Oregon Health and Science University (OHSU) foundation, National Natural Science Foundation of China (Grant No. 61471226), the Natural Science Foundation for Distinguished Young Scholars of Shandong Province (Grant No. JQ201516), and an unrestricted grant from Research to Prevent Blindness.
Biographies
Pengxiao Zang is a master student of Shandong Normal University. He is also a research assistant at the Center for Ophthalmic Optics and Lasers Laboratory, Oregon Health and Science University (OHSU). His research interests include OCT, OCT angiography, and image processing.
Dengwang Li received his PhD from Shandong University through a joint PhD program with the University of Sydney sponsored by CSC. Currently, he is a professor in Shandong Normal University and is the vice director in the Shandong Province Key Laboratory of Medical Physics and Image Processing Technology. His research interests include medical image processing and its clinical applications.
Yali Jia received her PhD in biomedical engineering from OHSU, in 2010. She is an assistant professor of ophthalmology at OHSU. Her research interests include OCT and OCT angiography as well as their applications in retinal diseases.
Biographies for the other authors are not available.
Disclosures
Financial interests: OHSU, David Huang, and Yali Jia have a significant financial interest in Optovue. David Huang also has a financial interest in Carl Zeiss Meditec. These potential conflicts of interest have been reviewed and managed by OHSU.
References
- 1.Huang D., et al. , “Optical coherence tomography,” Science 254(5035), 1178–1181 (1991). 10.1126/science.1957169 [DOI] [PMC free article] [PubMed] [Google Scholar]
- 2.Potsaid B., et al. , “Ultrahigh speed spectral/Fourier domain OCT ophthalmic imaging at 70,000 to 312,500 axial scans per second,” Opt. Express 16, 15149–15169 (2008). 10.1364/OE.16.015149 [DOI] [PMC free article] [PubMed] [Google Scholar]
- 3.Nankivil D., et al. , “Coherence revival multiplexed buffered swept source optical coherence tomography: 400 kHz imaging with a 100 kHz source,” Opt. Lett. 39, 3740–3743 (2014). 10.1364/OL.39.003740 [DOI] [PMC free article] [PubMed] [Google Scholar]
- 4.Jia Y., et al. , “Split-spectrum amplitude-decorrelation angiography with optical coherence tomography,” Opt. Express 20(4), 4710–4725 (2012). 10.1364/OE.20.004710 [DOI] [PMC free article] [PubMed] [Google Scholar]
- 5.Wang R. K., et al. , “Three dimensional optical angiography,” Opt. Express 15(7), 4083–4097 (2007). 10.1364/OE.15.004083 [DOI] [PubMed] [Google Scholar]
- 6.Yousefi S., Zhi Z., Wang R. K., “Eigen decomposition-based clutter filtering technique for optical micro-angiography,” IEEE Trans. Biomed. Eng. 58(8), 2316–2323 (2011). 10.1109/TBME.2011.2152839 [DOI] [PMC free article] [PubMed] [Google Scholar]
- 7.Makita S., et al. , “Optical coherence angiography,” Opt. Express 14(17), 7821–7840 (2006). 10.1364/OE.14.007821 [DOI] [PubMed] [Google Scholar]
- 8.Mariampillai A., et al. , “Speckle variance detection of microvasculature using swept-source optical coherence tomography,” Opt. Lett. 33(13), 1530–1532 (2008). 10.1364/OL.33.001530 [DOI] [PubMed] [Google Scholar]
- 9.Liu G., et al. , “Intensity-based modified Doppler variance algorithm: application to phase instable and phase stable optical coherence tomography systems,” Opt. Express 19(12), 11429–11440 (2011). 10.1364/OE.19.011429 [DOI] [PMC free article] [PubMed] [Google Scholar]
- 10.Kim D. Y., et al. , “In vivo volumetric imaging of human retinal circulation with phase-variance optical coherence tomography,” Biomed. Opt. Express 2(6), 1504–1513 (2011). 10.1364/BOE.2.001504 [DOI] [PMC free article] [PubMed] [Google Scholar]
- 11.Yang V. X. D., et al. , “Improved phase-resolved optical Doppler tomography using the Kasai velocity estimator and histogram segmentation,” Opt. Commun. 208(4–6), 209–214 (2002). 10.1016/S0030-4018(02)01501-8 [DOI] [Google Scholar]
- 12.Park B. H., et al. , “Real-time multi-functional optical coherence tomography,” Opt. Express 11(7), 782–793 (2003). 10.1364/OE.11.000782 [DOI] [PubMed] [Google Scholar]
- 13.Nam A. S., Chico-Calero I., Vakoc B. J., “Complex differential variance algorithm for optical coherence tomography angiography,” Biomed. Opt. Express 5(11), 3822–3832 (2014). 10.1364/BOE.5.003822 [DOI] [PMC free article] [PubMed] [Google Scholar]
- 14.Enfield J., Jonathan E., Leahy M., “In vivo imaging of the microcirculation of the volar forearm using correlation mapping optical coherence tomography (cmOCT),” Biomed. Opt. Express 2(5), 1184–1193 (2011). 10.1364/BOE.2.001184 [DOI] [PMC free article] [PubMed] [Google Scholar]
- 15.Martinez-Conde S., Macknik S. L., Hubel D. H., “The role of fixational eye movements in visual perception,” Nat. Rev. Neurosci. 5(3), 229–240 (2004). 10.1038/nrn1348 [DOI] [PubMed] [Google Scholar]
- 16.Ratliff F., Riggs L. A., “Involuntary motions of the eye during monocular fixation,” J. Exp. Psychol. 40, 687–701 (1950). 10.1037/h0057754 [DOI] [PubMed] [Google Scholar]
- 17.Yun S., et al. , “Motion artifacts in optical coherence tomography with frequency-domain ranging,” Opt. Express 12, 2977–2998 (2004). 10.1364/OPEX.12.002977 [DOI] [PMC free article] [PubMed] [Google Scholar]
- 18.Camino A., et al. , “Evaluation of artifact reduction in optical coherence tomography angiography with real-time tracking and motion correction technology,” Biomed. Opt. Express 7(10), 3905–3915 (2016). 10.1364/BOE.7.003905 [DOI] [PMC free article] [PubMed] [Google Scholar]
- 19.Larocca F., et al. , “Handheld simultaneous scanning laser ophthalmoscopy and optical coherence tomography system,” Biomed. Opt. Express 4, 2307–2321 (2013). 10.1364/BOE.4.002307 [DOI] [PMC free article] [PubMed] [Google Scholar]
- 20.Ferguson R. D., et al. , “Tracking optical coherence tomography,” Opt. Lett. 29, 2139–2141 (2004). 10.1364/OL.29.002139 [DOI] [PMC free article] [PubMed] [Google Scholar]
- 21.Braaf B., et al. , “Real-time eye motion correction in phase-resolved OCT angiography with tracking SLO,” Biomed. Opt. Express 4(1), 51–65 (2013). 10.1364/BOE.4.000051 [DOI] [PMC free article] [PubMed] [Google Scholar]
- 22.Gorczynska I., et al. , “En face projection imaging of the human choroidal layers with tracking SLO and swept source OCT angiography methods,” Proc. SPIE 9541, 954112 (2015). 10.1117/12.2183603 [DOI] [Google Scholar]
- 23.Zhang Q., et al. , “Wide-field imaging of retinal vasculature using optical coherence tomography-based microangiography provided by motion tracking,” J. Biomed. Opt. 20(6), 066008 (2015). 10.1117/1.JBO.20.6.066008 [DOI] [PMC free article] [PubMed] [Google Scholar]
- 24.Hendargo H. C., et al. , “Automated non-rigid registration and mosaicing for robust imaging of distinct retinal capillary beds using speckle variance optical coherence tomography,” Biomed. Opt. Express 4(6), 803–821 (2013). 10.1364/BOE.4.000803 [DOI] [PMC free article] [PubMed] [Google Scholar]
- 25.Zang P., et al. , “Automated motion correction using parallel-strip registration for wide-field en face OCT angiogram,” Biomed. Opt. Express 7(7), 2823–2836 (2016). 10.1364/BOE.7.002823 [DOI] [PMC free article] [PubMed] [Google Scholar]
- 26.Kraus M. F., et al. , “Motion correction in optical coherence tomography volumes on a per A-scan basis using orthogonal scan patterns,” Biomed. Opt. Express 3(6), 1182–1199 (2012). 10.1364/BOE.3.001182 [DOI] [PMC free article] [PubMed] [Google Scholar]
- 27.Laser Institute of America, American National Standard for the Safe Use of Lasers, Laser Institute of America, Orlando, Florida: (2014). [Google Scholar]
- 28.Zhang M., et al. , “Advanced image processing for optical coherence tomographic angiography of macular diseases,” Biomed. Opt. Express 6(12), 4661–4675 (2015). 10.1364/BOE.6.004661 [DOI] [PMC free article] [PubMed] [Google Scholar]
- 29.Estrada R., et al. , “Enhanced video indirect ophthalmoscopy (VIO) via robust mosaicing,” Biomed. Opt. Express 2(10), 2871–2887 (2011). 10.1364/BOE.2.002871 [DOI] [PMC free article] [PubMed] [Google Scholar]
- 30.Frangi A. F., et al. , “Multiscale vessel enhancement filtering,” in Medical Image Computing and Computer Assisted Intervention (MICCAI), Springer, pp. 130–137 (1998). [Google Scholar]
- 31.Peli E., “Contrast in complex images,” J. Opt. Soc. Am. A 7(10), 2032–2040 (1990). 10.1364/JOSAA.7.002032 [DOI] [PubMed] [Google Scholar]


