

Abstract
Loss of primary cilia is frequently observed in tumor cells, including pancreatic ductal adenocarcinoma (PDAC) cells, suggesting that the absence of this organelle may promote tumorigenesis through aberrant signal transduction and the inability to exit the cell cycle. However, the molecular mechanisms that explain how PDAC cells lose primary cilia are still ambiguous. In this study, we found that inhibition or silencing of histone deacetylase 2 (HDAC2) restores primary cilia formation in PDAC cells. Inactivation of HDAC2 results in decreased Aurora A expression, which promotes disassembly of primary cilia. We further showed that HDAC2 controls ciliogenesis independently of Kras, which facilitates Aurora A expression. These studies suggest that HDAC2 is a novel regulator of primary cilium formation in PDAC cells.
Keywords: HDAC2, pancreatic ductal adenocarcinoma, primary cilia
Subject Categories: Cancer; Cell Adhesion, Polarity & Cytoskeleton; Post-translational Modifications, Proteolysis & Proteomics
Introduction
The primary cilium is a hair‐like protrusion from the surface of most mammalian cells, functioning as a cellular “antenna” by transducing extracellular signals to the cell body 1, 2, 3. Cylindrical centrioles, which are distinguished as mother and daughter centrioles, compose a centrosome and serve as spindle poles during mitosis, whereas the mother centriole differentiates into a basal body to extend a primary cilium in quiescent cells. Structural and/or functional abnormalities of the cilium are implicated in multiple genetic disorders, collectively termed ciliopathies.
Recent studies have shown that defects associated with primary cilia have strong correlations with cancer 4, 5. As primary cilia are important for signaling and are assembled from centrioles that organize spindle poles, it is likely that the absence of the organelle may promote tumorigenesis by aberrant signal transduction and cell cycle regulation. Primary cilia are diminished or lost in multiple cancers, including pancreatic ductal adenocarcinoma (PDAC) 6, 7, renal cell carcinoma 8, basal cell carcinoma 9, breast cancer 10, 11, 12, ovarian cancer 13, prostate cancer 14, medulloblastoma 15, cholangiocarcinoma 16, glioblastoma 17, and melanoma 18.
PDAC accounts for the most frequently occurring pancreatic tumor, which has one of the highest mortality rates with a 5‐year survival rate lower than 5% in patients 19. Oncogenic Kras is the most commonly mutated gene in PDACs, which occurs in > 90% of the cells, leading to a constitutively active form of Kras 20. Previously, it has been shown that primary cilia are absent from human PDAC lesions and cultured PDAC cells, independent of proliferation 7. Moreover, inhibition of Kras downstream effectors, MEK and PI3K, has been shown to restore primary cilia formation in PDAC cells, suggesting that ciliogenesis is suppressed by aberrant Kras signaling in a proliferation‐independent manner. However, molecular mechanisms that explain how primary ciliogenesis is repressed in PDAC cells remain unclear.
In this study, we identified a histone deacetylase, HDAC2, as a regulator of primary cilia formation in PDAC cells. HDAC2 has been known to regulate gene expression by removing acetyl groups from lysine residues within histones 21. We found that expression of Aurora A kinase, previously reported to promote disassembly of primary cilia 22, is positively regulated by HDAC2 in PDAC cells. We further showed that HDAC2 and Kras independently control ciliogenesis by regulating Aurora A expression. These results suggest that HDAC2 contributes to suppression of primary cilia formation by controlling Aurora A levels in a Kras‐independent manner in PDAC cells.
Results
Treatment of HDAC inhibitors restores primary cilia in PDAC cells
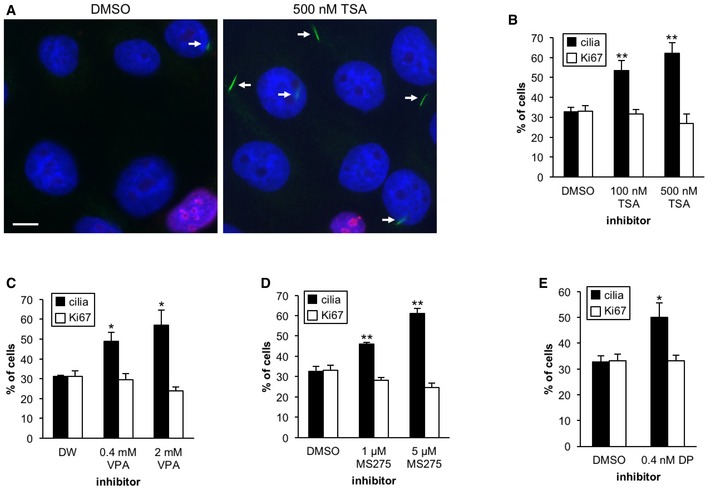
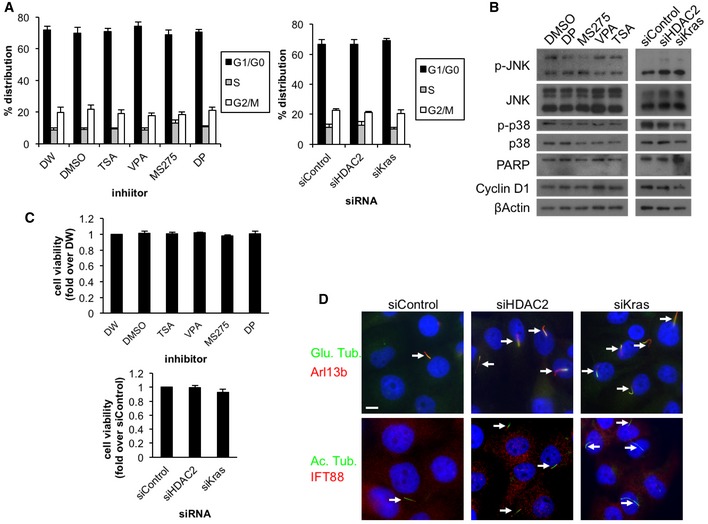
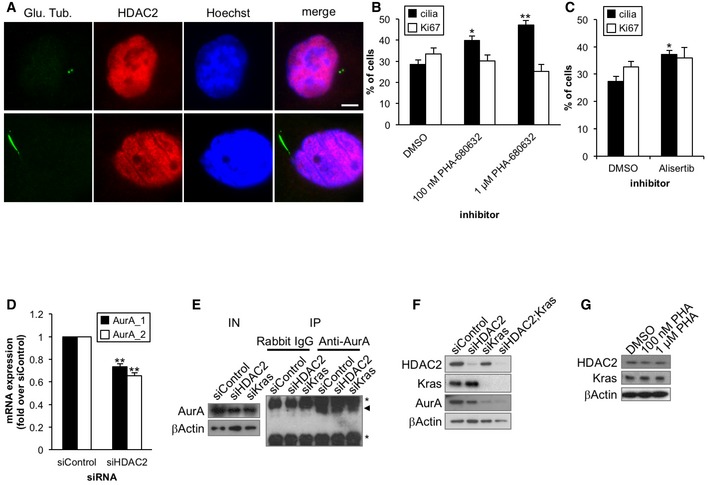
To clarify how primary cilia formation is suppressed in PDAC cells, we first used Panc1 cells, which possess an oncogenic mutation in Kras 23 and assemble primary cilia with low frequency after induction of quiescence 24. The cells were induced to quiesce to identify proteins that contribute to suppression of primary ciliogenesis in a proliferation‐independent manner. HDAC6 is known to play a role in disassembly of primary cilia 22. Therefore, to identify factors that regulate primary cilia formation in PDAC cells, we investigated whether inhibitors of this histone deacetylase (HDAC), or others, have an effect on ciliation in Panc1 cells. We initially treated Panc1 cells with trichostatin A (TSA), an inhibitor of class I, II, and IV HDACs (HDAC1‐11) 25, and performed immunofluorescence experiments with antibodies against glutamylated tubulin and Ki67 to quantitate cells that had assembled primary cilia and that were cycling, respectively. Treatment with TSA significantly restored primary cilia formation at 100 and 500 nM (Fig 1A and B). These data suggest that TSA treatment induces primary cilia formation in Panc1 cells. However, we showed that TSA treatment did not significantly impact the cell cycle by determining the percentage of cells with Ki67‐positive nuclei, flow cytometry, and expression of a cell cycle marker (Figs 1B and EV1A and B), suggesting that cilium assembly in TSA‐treated cells does not occur as a result of cell cycle perturbation. To further pinpoint which HDACs are responsible for repression of primary cilia in Panc1 cells, we next tested other HDAC inhibitors, such as valproic acid (VPA), MS‐275, and FK228/depsipeptide. VPA, MS‐275, and depsipeptide inhibit class I and IIa (HDAC1‐5, 7‐9), HDAC1‐3, and HDAC1‐2, respectively 25. The frequency of ciliation was significantly increased by treatment with VPA, MS‐275, or depsipeptide without altering the cell cycle (Figs 1C–E and EV1A and B). We confirmed that the treatment with HDAC inhibitors did not overtly influence cell viability or expression of markers for apoptosis and stress signaling (Fig EV1B and C). These data suggest that HDAC1 and/or HDAC2 could play a role in suppression of primary cilia in Panc1 cells.
Figure 1. Treatment with HDAC inhibitors restores primary cilia in Panc1 cells.
-
APanc1 cells in serum‐starved medium were treated with DMSO or 500 nM TSA for 48 h. Cells were visualized with antibodies against glutamylated tubulin (GT335) (green) and Ki67 (red). DNA was stained with Hoechst (blue). Arrows indicate primary cilia. Scale bar, 10 μm.
-
B–EPanc1 cells in serum‐starved medium were incubated with the indicated concentration of (B) TSA, (C) VPA, (D) MS‐275, and (E) depsipeptide/FK228 (DP) for 48 h. The percentages of ciliated or Ki67‐positive cells were determined by immunostaining with antibodies against glutamylated tubulin and Ki67. Average of three to five independent experiments is shown. Error bars represent standard error of the mean (SEM). *P < 0.05, **P < 0.01 compared with DMSO (B, D, E) or DW (C) (two‐tailed Student's t‐test).
Figure EV1. Depletion or inhibition of HDAC2 does not impact on cell cycle, cell growth, and expression of various signaling markers in serum‐starved PDAC cells.
-
A–CPanc1 cells were treated with the indicated inhibitors or siRNAs and cultured in serum‐starved medium for 48 h. (A) FACS analysis. Average of five to six (inhibitor) or three (knockdown) independent experiments is shown. (B) Cell extracts were immunoblotted with antibodies against phospho‐JNK, JNK, phospho‐p38, p38, PARP, and cyclin D1. β‐Actin was used as a loading control. (C) MTT cell viability analysis. Average of three (inhibitor) or five (knockdown) independent experiments is shown. Error bars represent SEM.
-
DPanc1 cells transiently transfected with control, HDAC2#2, or Kras siRNA were cultured in serum‐starved medium for 48 h and immunostained with antibodies to (upper row) glutamylated tubulin (green) and Arl13b (red), and (lower row) acetylated tubulin (green) and IFT88 (red). DNA was stained with Hoechst (blue). Scale bar, 10 μm. Arrows indicate primary cilia.
Depletion of HDAC2 induces primary ciliogenesis in PDAC cells
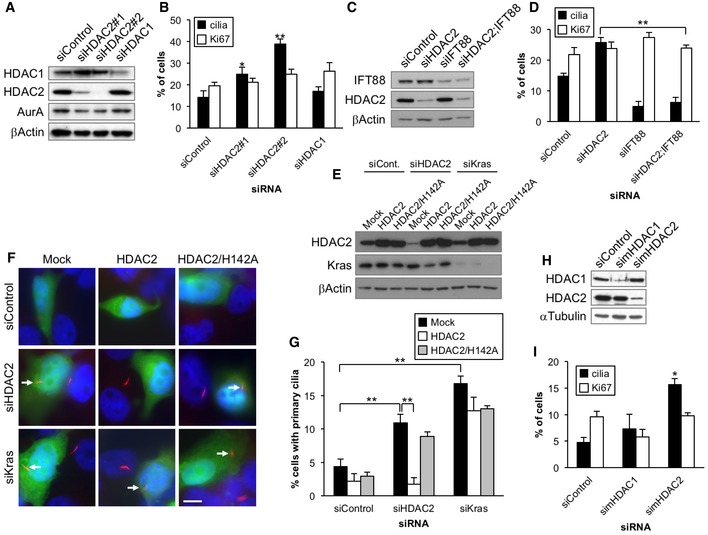
To determine whether HDAC1 and/or HDAC2 suppress primary ciliogenesis in PDAC cells, we next investigated the consequences of HDAC1 or HDAC2 depletion. We transfected siRNAs and verified that the levels of HDAC1 or HDAC2 were considerably reduced in Panc1 cells (Fig 2A). Ablation of HDAC2 using two different siRNAs led to a significant increase in primary cilia in Panc1 cells without affecting the cell cycle (Figs 2B and EV1A and B). We further verified that silencing of HDAC2 did not affect cell viability and expression of markers for apoptosis and stress signaling (Fig EV1B and C). On the other hand, depletion of HDAC1 did not restore primary cilia formation, suggesting that HDAC2 is responsible for the suppression of primary cilia formation (Fig 2B). Next, we used additional markers against primary cilia, such as acetylated tubulin, IFT88, and Arl13b to further verify that HDAC2 depletion in Panc1 cells induces cilium formation (Fig EV1D). Furthermore, we depleted IFT88, a protein essential for the formation and maintenance of the cilium, in HDAC2‐ablated Panc1 cells and found that loss of IFT88 abrogated increased primary cilium formation without impacting on cell cycle (Fig 2C and D). These data collectively indicate that knockdown of HDAC2 promotes bona fide primary cilium assembly in Panc1 cells.
Figure 2. Depletion of HDAC2 induces primary ciliogenesis in PDAC cells.
-
A, BPanc1 cells transiently transfected with control, HDAC2#1, HDAC2#2, or HDAC1 siRNA were cultured in serum‐starved medium for 48 h. (A) Cell extracts were immunoblotted with antibodies against HDAC1, HDAC2, and Aurora A. β‐Actin was used as a loading control. (B) The percentages of cells with primary cilia or Ki67‐positive nuclei were determined as described in Fig 1. Average of three to five independent experiments is shown.
-
C, DPanc1 cells transiently transfected with control, HDAC2#2, IFT88, or HDAC2#2 and IFT88 siRNA were cultured in serum‐starved medium for 48 h. (C) Cell extracts were immunoblotted with antibodies against IFT88 and HDAC2. β‐Actin was used as a loading control. (D) The percentages of ciliated or Ki67‐positive cells were determined as described in Fig 1. Average of three independent experiments is shown.
-
E–GPanc1 cells treated with control, HDAC2#2, or Kras siRNA were transfected with plasmids expressing GFP and mock, siRNA‐resistant (siR‐)HDAC2 or siR‐HDAC2/H142A and induced to quiescence for 72 h. (E) Cell extracts were immunoblotted with antibodies against HDAC2 and Kras. β‐Actin was used as a loading control. (F) Cells were immunostained with an anti‐glutamylated tubulin antibody (red). DNA was stained with Hoechst (blue). Arrows indicate primary cilia in GFP‐positive cells. Scale bar, 10 μm. (G) The percentages of GFP‐positive Panc1 cells with primary cilia were determined. Average of three independent experiments is shown.
-
H, IKrasPDEC cells transiently transfected with control, mouse HDAC1 (simHDAC1), or mouse HDAC2 (simHDAC2) siRNA were induced to quiescence for 48 h. (H) Cell extracts were immunoblotted with antibodies against HDAC1 and HDAC2. α‐Tubulin was used as a loading control. (I) The percentages of ciliated or Ki67‐positive cells were determined as described in Fig 1. Average of three independent experiments is shown.
To test whether HDAC2 suppresses primary ciliogenesis through its histone deacetylase activity in PDAC cells, we carried out rescue experiments in which we expressed siRNA‐resistant wild‐type HDAC2 or a catalytically inactive mutant of HDAC2 (H142A) in serum‐starved Panc1 cells depleted of endogenous HDAC2 (Fig 2E). We found that while wild‐type HDAC2 canceled ciliation by HDAC2 ablation, the deacetylase mutant did not (Fig 2F and G). These data suggest that histone deacetylase activity of HDAC2 contributes to suppression of primary cilia formation in Panc1 cells.
We next verified whether HDAC2 suppresses primary cilia formation in other PDAC cells. To this end, we investigated CFPAC1 cells, which were previously shown to assemble primary cilia with low frequency 24. We observed that TSA treatment or HDAC2 knockdown in CFPAC1 restored primary cilia without affecting proliferation (Fig EV2A and data not shown). We next examined mouse primary Kras/G12D‐expressing pancreatic duct epithelial cells (KrasPDEC) that are recognized as potential cells of origin for PDAC 26, 27, 28. We treated KrasPDEC cells with several HDAC inhibitors, including TSA, VPA, MS‐275, and depsipeptide, and found that such treatments restored primary cilia formation without significant alterations in proliferative index (Fig EV2B–D). Similar to Panc1 and CFPAC1 cells, we were able to confirm that the inhibition of HDAC2 induced primary cilia formation in KrasPDEC cells, and depletion of HDAC1 did not impinge upon the frequency of ciliation (Fig 2H and I). These observations collectively suggest that primary cilium formation is commonly suppressed by HDAC2 in PDAC cells.
Figure EV2. Depletion or inhibition of HDAC2 restores primary cilia in PDAC cells.
-
ACFPAC1 cells transiently transfected with control or HDAC2#2 siRNA were cultured in serum‐starved medium for 48 h. The percentages of cells with primary cilia or Ki67‐positive nuclei were determined as described in Fig 1. Average of three independent experiments is shown.
-
B–DKrasPDEC cells in serum‐starved medium were incubated with the indicated concentration of (B) TSA, (C) VPA, and (D) MS‐275 or depsipeptide for 24 h. The percentages of cells with primary cilia or Ki67‐positive nuclei were determined as described in Fig 1. Average of three to four independent experiments is shown.
-
EU87‐MG cells transiently transfected with control or HDAC2#2 siRNA were cultured in serum‐starved medium for 48 h. The percentages of cells with primary cilia or Ki67‐positive nuclei were determined as described in Fig 1. Average of three independent experiments is shown.
-
F, GRPE1 cells transiently transfected with control, HDAC2#2, IFT88 or HDAC2#2, and IFT88 siRNA were cultured in serum‐containing medium for 48 h. (F) Cell extracts were immunoblotted with antibodies against IFT88 and HDAC2. β‐Actin was used as a loading control. (G) The percentages of ciliated or Ki67‐positive cells were determined as described in Fig 1. Average of three independent experiments is shown.
-
H–JIMCD3 cells transiently transfected with plasmids expressing GFP and mock, HDAC2 or HDAC2/H142A were cultured without serum for 72 h. (H) Cell extracts were immunoblotted with an antibody against HDAC2. β‐Actin was used as a loading control. (I) Cells were immunostained with an anti‐Arl13b antibody (red). DNA was stained with Hoechst (blue). Arrows indicate primary cilia in GFP‐positive cells. Scale bar, 5 μm. (J) The percentages of GFP‐positive IMCD3 cells with primary cilia were determined. Average of three independent experiments is shown.
We further investigated whether HDAC2 generally contributes to suppression of primary cilia. First, we depleted HDAC2 in human glioblastoma U87‐MG cells and found that HDAC2 ablation caused primary ciliogenesis (Fig EV2E). We next used human diploid retinal pigment epithelial cells (RPE1), which rarely form primary cilia in cycling cells and assemble primary cilia with high frequency after induction of quiescence. We depleted HDAC2 in proliferating RPE1 cells and found that HDAC2 ablation induced primary ciliogenesis and a simultaneous decrease in Ki67‐positive cells (Fig EV2F and G). To test whether a decrease in cycling cells is caused by cilia formation, we performed double knockdown of HDAC2 and IFT88. Silencing of IFT88 significantly canceled cilia formation and a decrease in Ki67‐positive cells after HDAC2 ablation (Fig EV2G), suggesting that loss of HDAC2 induces primary cilia formation which does not occur as a result of cell cycle perturbation. Collectively, these results suggest that HDAC2 generally contributes to suppression of primary cilia.
To investigate the impact of enforced HDAC2 expression on primary cilia formation, we expressed HDAC2 in mouse inner medullary collecting duct (IMCD3) cells, which assemble primary cilia with high frequency after serum deprivation. We found that ciliation was significantly decreased by HDAC2 expression, but not by the HDAC2 deacetylase mutant (Fig EV2H–J), strongly supporting our conclusion that primary cilia formation is suppressed by HDAC2.
HDAC2 positively regulates expression of Aurora A kinase
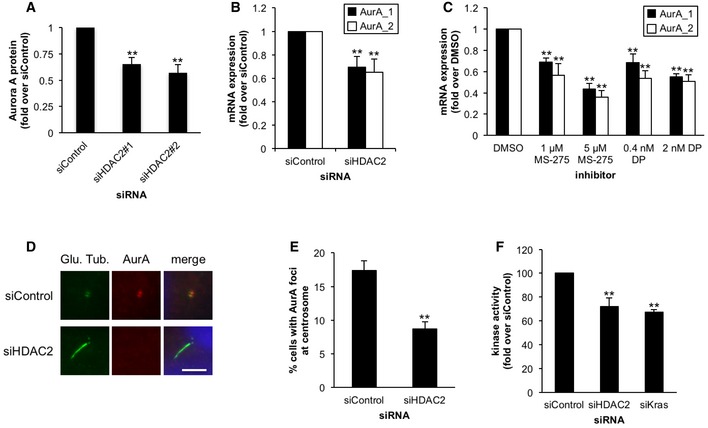
HDAC2 predominantly localizes to the nucleus 21 and is not detected at the centrosome or primary cilium in Panc1 cells (Fig EV3A). This implies that HDAC2 suppresses primary cilia formation by regulating the expression of genes that are involved in the assembly or disassembly of primary cilia. The mitotic kinase, Aurora A, has been reported to promote disassembly of primary cilia in several ciliated cell types 22, and recently, it has been shown to promote loss of primary cilia in ovarian carcinoma 13. In addition, Aurora A expression is elevated in PDAC cells 29, which led us to hypothesize that its expression is regulated by HDAC2 in PDAC cells. We investigated whether Aurora A is involved in repression of primary cilia in Panc1 cells, and found that the treatment of Aurora A inhibitors, PHA‐680632 and alisertib, significantly restored primary cilia (Fig EV3B and C). This suggested that Aurora A promotes loss of primary cilia in Panc1 cells. We then examined Aurora A levels in HDAC2‐depleted Panc1 cells and found that Aurora A levels were substantially reduced (Figs 2A and 3A). mRNA levels of Aurora A were significantly decreased after ablation of HDAC2 in both Panc1 and CFPAC1 cells and in HDAC inhibitor‐treated Panc1 cells (Figs 3B and C, and EV3D). We also observed significant diminution of Aurora A foci at centrosomes after silencing of HDAC2 in Panc1 cells (Fig 3D and E). Moreover, kinase activity of Aurora A immunoprecipitated from HDAC2‐depleted Panc1 was remarkably lower than the control (Figs 3F and EV3E). These results collectively suggest that HDAC2 positively regulates levels of Aurora A, likely leading to suppression of primary ciliogenesis in PDAC cells.
Figure EV3. Aurora A contributes to suppress primary ciliogenesis in PDAC cells.
-
APanc1 cells were visualized with antibodies against glutamylated tubulin (GT335)(green) and HDAC2 (red). DNA was stained with Hoechst (blue). Scale bar, 5 μm.
-
B, CPanc1 cells in serum‐starved medium were treated with the indicated concentration of PHA‐680632 (B) or 10 nM alisertib (C) for 48 h. The percentages of cells with primary cilia or Ki67‐positive nuclei were determined as described in Fig 1. Average of three independent experiments is shown.
-
DCFPAC1 cells transiently transfected with control or HDAC2#2 siRNA were cultured in serum‐starved medium for 48 h. Relative amount of Aurora A mRNA was determined using quantitative PCR and GAPDH was used as a control. Average of three independent experiments is shown.
-
ECell extracts and immunoprecipitated fractions were immunoblotted with an anti‐Aurora A antibody. Asterisks and arrowhead indicate IgG and Aurora A, respectively. β‐Actin was used as a loading control.
-
FPanc1 cells transiently transfected with control, HDAC2#2, Kras, or HDAC2#2 and Kras siRNA were cultured in serum‐starved medium for 48 h. Cell extracts were immunoblotted with antibodies against Kras, HDAC2, and Aurora A. β‐Actin was used as a loading control.
-
GPanc1 cells in serum‐starved medium were treated with the indicated concentration of PHA‐680632 for 48 h. Cell extracts were immunoblotted with antibodies against Kras and HDAC2. β‐Actin was used as a loading control.
Figure 3. HDAC2 positively regulates expression of Aurora A kinase.
-
A, BPanc1 cells transiently transfected with control, HDAC2#1, or HDAC2#2 siRNA were cultured in serum‐starved medium for 48 h. (A) Cell extracts were immunoblotted with an anti‐Aurora A antibody. Relative amount of Aurora A protein was quantified, and β‐actin was used as a loading control. Average of three to four independent experiments is shown. (B) Relative amount of Aurora A mRNA was determined using quantitative PCR. GAPDH was used as a control. Average of six independent experiments is shown.
-
CPanc1 cells in serum‐starved medium were treated with the indicated inhibitors for 48 h. Relative amount of Aurora A mRNA was determined as described in panel (B). Average of five to six independent experiments is shown.
-
D, EPanc1 cells transiently transfected with control or HDAC2#2 siRNA were cultured in serum‐starved medium for 48 h. Cells were immunostained with anti‐glutamylated tubulin and anti‐Aurora A antibodies. (D) DNA was stained with Hoechst (blue). Scale bar, 5 μm. (E) The percentages of Panc1 cells that stain for Aurora A at centrosomes were determined. Average of four independent experiments is shown.
-
FPanc1 cells transiently transfected with control, HDAC2#2, or Kras siRNA were cultured in medium lacking serum for 48 h. Cell extracts were immunoprecipitated with control rabbit IgG or anti‐Aurora A antibody, and the precipitated Aurora A was subjected to in vitro kinase assay. Average of three to four independent experiments is shown.
HDAC2 and Kras independently control loss of primary cilia in Panc1 cells
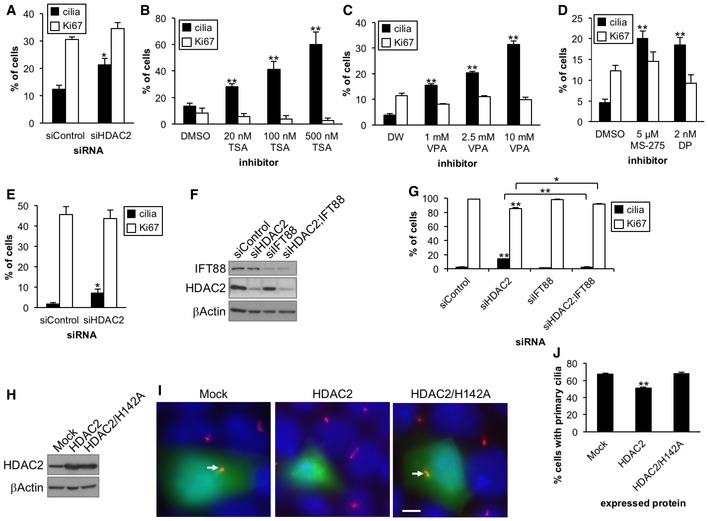
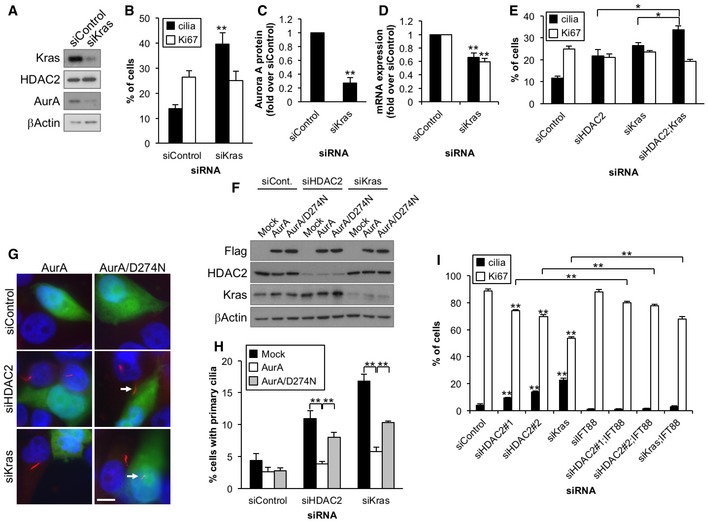
A previous study showed that inhibition of Kras effectors, MEK and PI3K, restores primary cilium formation in pancreatic cancer cells 7. In PDAC cells, Aurora A transcription is positively regulated by the ETS2 transcription factor, which is activated by the Kras–MAPK1 pathway 30. Therefore, we asked whether Kras signaling, which is de‐regulated in > 90% of PDACs through constitutive activity, suppresses primary cilium formation by inducing Aurora A expression. We found that siRNA‐mediated knockdown of Kras in Panc1 cells deprived of serum led to a significant increase in cilium formation without affecting cell cycle, cell viability, or expression of markers for apoptosis and stress signaling (Figs 4A and B, and EV1A–D). We then evaluated the protein and mRNA levels of Aurora A in the Kras‐depleted cells and found that loss of Kras led to a significant decrease in levels of this kinase (Figs 4A, C and D, and EV3F). We further observed that Aurora A kinase activity in Kras‐depleted cells was lower than control cells (Figs 3F and EV3E). These results suggest that Kras suppresses primary ciliogenesis by augmenting mRNA expression of Aurora A in PDAC cells. However, we do not rule out the possibility that Kras depletion impacts Aurora A level after transcription, as Aurora A protein levels are more dramatically decreased than mRNA level (Fig 4C and D). Since both HDAC2 and Kras positively regulate Aurora A expression, we next tested whether HDAC2 and Kras function in the same pathway to inhibit primary ciliogenesis. To our surprise, we found that combined ablation of Kras and HDAC2 showed significantly enhanced ciliation as compared to singly ablated cells (Fig 4E). Silencing Kras did not have an impact on HDAC2 expression, which was reciprocally confirmed (Figs 4A and EV3F). Furthermore, ectopic expression of HDAC2 did not significantly abrogate ciliation induced by Kras silencing (Fig 2E–G). These results suggest that Kras and HDAC2, at least in part, independently control primary cilia in PDAC cells.
Figure 4. Kras and HDAC2 independently suppress formation of primary cilia through Aurora A in Panc1 cells.
-
A–DPanc1 cells transiently transfected with control or Kras siRNA were cultured in serum‐starved medium for 48 h. (A) Cell extracts were immunoblotted with antibodies against Kras, HDAC2, and Aurora A. β‐Actin was used as a loading control. (B) The percentages of ciliated or Ki67‐positive cells were determined as described in Fig 1. Average of four independent experiments is shown. (C) Relative amount of Aurora A protein was quantified, and β‐actin was used as a loading control. Average of three independent experiments is shown. (D) Relative amount of Aurora A mRNA was determined as described in Fig 3B. Average of three to four independent experiments is shown.
-
EPanc1 cells transiently transfected with control, HDAC2#2, Kras, or HDAC2#2 and Kras siRNA were cultured in serum‐starved medium for 48 h. The percentages of ciliated or Ki67‐positive cells were determined as described in Fig 1. Average of three independent experiments is shown.
-
F–HPanc1 cells treated with control, HDAC2#2, or Kras siRNA were transfected with plasmids expressing GFP and Flag, Flag‐Aurora A, or Flag‐Aurora A/D274N and induced to quiescence for 72 h. Cells were immunostained with an anti‐glutamylated tubulin antibody (red). (F) Cell extracts were immunoblotted with antibodies against Flag, HDAC2, and Kras. β‐Actin was used as a loading control. (G) DNA was stained with Hoechst (blue). Arrows indicate primary cilia in GFP‐positive cells. Scale bar, 10 μm. (H) The percentages of GFP‐positive Panc1 cells with primary cilia were determined. Average of at least three independent experiments is shown.
-
IPanc1 cells transiently transfected with control, HDAC2#1, HDAC2#2, Kras, IFT88, HDAC2#1 and IFT88, HDAC2#2 and IFT88, or Kras and IFT88 siRNA were cultured in serum‐containing medium for 48 h. The percentages of ciliated or Ki67‐positive cells were determined as described in Fig 1. Average of at least three independent experiments is shown.
Based on our data, we hypothesized that HDAC2 and Kras promote loss of primary cilia by augmentation of Aurora A expression in PDAC cells. To test this, we expressed Aurora A in Panc1 cells, depleted of HDAC2 or Kras to determine whether ectopic Aurora A could rescue the induction of primary cilia formation. We found that Aurora A expression suppressed the increase in primary cilia formation provoked by HDAC2 or Kras depletion (Fig 4F–H). On the other hand, a catalytically inactive mutant (D274N) of the Aurora A was less efficient in reversing the ciliation phenotype, suggesting that kinase activity of Aurora A is important for suppressing ciliogenesis in Panc1 cells (Fig 4F–H). We further observed that inhibition of Aurora A by PHA‐680632 did not affect the expression of HDAC2 and Kras (Fig EV3G), suggesting that HDAC2 and Kras are not downstream of Aurora A signaling. These results support our hypothesis that HDAC2 and Kras enhance Aurora A expression, thereby leading to disappearance of primary cilia in Panc1 cells.
HDAC6 is not involved in regulation of primary ciliogenesis in PDAC cells
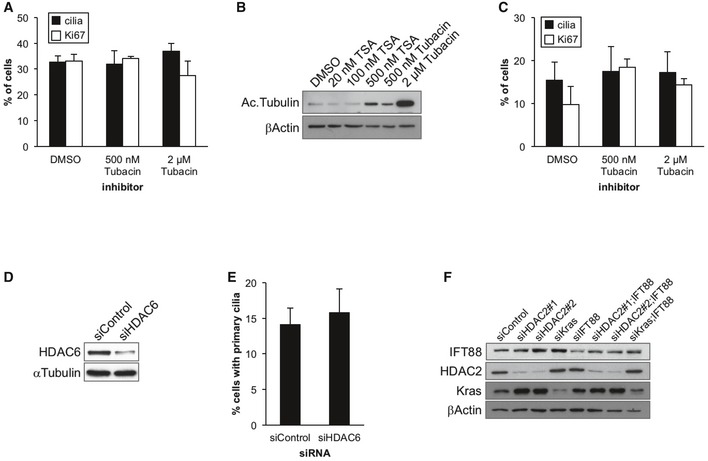
Previous work has shown that Aurora A promotes the resorption of primary cilia by activating HDAC6, a cytoplasmic deacetylase, resulting in the deacetylation of microtubules of the ciliary axoneme 22. We then asked whether HDAC6 is involved in the regulation of primary cilia formation in PDAC cells. We treated Panc1 cells with an HDAC6‐specific inhibitor, tubacin, and assessed primary cilium formation. As shown in Fig EV4A, tubacin did not have significant effects on the number of primary cilia in Panc1 cells. To exclude the possibility that tubacin was unable to suppress HDAC6 function in our experiment, we examined the amount of acetylated tubulin, which is a substrate of HDAC6, in tubacin‐ or TSA‐treated Panc1 cells by Western blotting. We detected a significant increase in acetylated tubulin in cells treated with 2 μM tubacin‐treated cells as compared to controls and cells treated with 500 nM TSA (Fig EV4B), confirming that tubacin treatment substantially inhibited HDAC6. Given that 500 nM TSA significantly induced ciliogenesis (Fig 1B), these data suggest that HDAC6 does not negatively regulate primary cilium assembly in Panc1 cells. Tubacin also had no impact on primary cilia formation in KrasPDEC cells (Fig EV4C). Moreover, ablation of HDAC6 using a siRNA oligo did not have any impact on primary ciliogenesis in Panc1 cells (Fig EV4D and E). Taken together, these data suggest that HDAC6 is not involved in abrogation of primary cilia in PDAC cells.
Figure EV4. HDAC6 is not involved in primary cilia formation in PDAC cells.
-
A, BPanc1 cells in serum‐starved medium were treated with the indicated inhibitors for 48 h. (A) The percentages of cells with primary cilia or Ki67‐positive nuclei were determined as described in Fig 1. Average of three independent experiments is shown. (B) Cell extracts were immunoblotted with an anti‐acetylated tubulin antibody. β‐Actin was used as a loading control.
-
CKrasPDEC cells in serum‐starved medium were treated with the indicated concentration of tubacin for 24 h. The percentages of cells with primary cilia or Ki67‐positive nuclei were determined as described in Fig 1. Average of three independent experiments is shown.
-
D, EPanc1 cells transiently transfected with control or HDAC6 siRNA were cultured in serum‐starved medium for 48 h. (D) Cell extracts were immunoblotted with an anti‐HDAC6 antibody. α‐Tubulin was used as a loading control. (E) The percentages of cells with primary cilia were determined as described in Fig 1. Average of three independent experiments is shown.
-
FPanc1 cells transiently transfected with control, HDAC2#1, HDAC2#2, Kras, IFT88, HDAC2#1 and IFT88, HDAC2#2 and IFT88, or Kras and IFT88 siRNA were cultured in serum‐containing medium for 48 h. Cell extracts were immunoblotted with antibodies against IFT88, HDAC2, and Kras. β‐Actin was used as a loading control.
HDAC2 and Kras promote cell proliferation by suppressing primary cilia formation
We next asked whether restoration of ciliation through depletion of HDAC2 or Kras affects proliferation of Panc1 cells. To this end, we ablated HDAC2 or Kras in Panc1 cells in serum‐containing medium and evaluated primary cilia formation and Ki67 expression. Ablation of these proteins led to significantly increased ciliation (Figs 4I and EV4F); however, in contrast to previous data in serum‐free medium, significant decreases in Ki67‐positive cells were observed. To investigate whether this increase in quiescence was caused by cilia formation, we co‐depleted HDAC2 or Kras and IFT88. Ablation of IFT88 abolished ciliation in HDAC2‐ or Kras‐depleted cells and, modestly but significantly, increased Ki67 expression as compared with corresponding singly ablated cells (Figs 4I and EV4F). These results suggest that inhibition of ciliation provoked by HDAC2 or Kras could promote proliferation in PDAC cells.
Discussion
As primary cilia are usually disassembled in cycling cells, it appears that cancer cells could lose primary cilia because of their vigorous proliferation. However, a previous study indicated that primary cilia are not assembled in quiescent PDAC cells 7. The proliferation‐independent loss of primary cilia was also observed in renal cell carcinoma and breast cancer 8, 11. These findings suggest that primary ciliogenesis is actively inhibited in these cancer cells independent of their proliferative state. In this study, we showed that HDAC2 plays a role in suppression of primary cilia formation in PDAC cells. In PDAC, HDAC2 is known to be overexpressed in comparison with the normal duct 31. It has been reported that loss of HDAC2 sensitizes PDAC cells to etoposide‐ and TRAIL‐induced apoptosis 31, 32. Our study, together with these previous reports, provides evidence that excessive expression of HDAC2 could accelerate loss of primary cilia and drug resistance in PDAC cells. We also showed that HDAC1 is not involved in loss of primary cilia in PDAC cells. Interestingly, HDAC1 and HDAC2 are structurally very similar and are often found together in repressive transcriptional complexes 21. However, several studies have reported distinct roles for both proteins, namely HDAC1 regulates embryonic stem cell differentiation 33, whereas HDAC2 has been shown to be involved in neurological functions, such as memory formation and synaptic plasticity 34. Our work further uncovers a novel HDAC2‐specific function in suppression of primary ciliogenesis in PDAC cells and raises the possibility of using specific HDAC2 inhibitors therapeutically.
We have identified Aurora A as a downstream target of Kras and HDAC2 in the suppression of ciliogenesis in PDAC cells. As Aurora A is known to be overexpressed or amplified in many cancer cells, including PDAC cells, and it is associated with tumorigenesis 29, 35, it is plausible that Aurora A‐dependent loss of primary cilia is common and may partly contribute to the malignancy in several cancer types. On the other hand, it remains unclear how Aurora A decreases primary cilia in PDAC cells. We did not detect restoration of primary cilia in PDAC cells by inhibition or silencing of HDAC6, which was previously reported as a downstream regulator of Aurora A in the disassembly of primary cilia 22. Previous reports have demonstrated HDAC6‐dependent and HDAC6‐independent loss of primary cilia in cholangiocarcinoma and ovarian cancer, respectively 13, 16, suggesting that Aurora A suppresses primary ciliogenesis by activating distinct downstream proteins in each cancer type. Recently, microtubule depolymerizing kinesins, Kif24 and Kif2A, were reported to negatively control primary cilium formation 36, 37, 38. These proteins might serve to reduce primary cilia downstream of Aurora A in PDAC cells. How HDAC2 controls mRNA expression of Aurora A is also unclear. Although the activity of HDACs is generally associated with gene silencing, other evidence also suggests that HDACs can activate transcription 21. Therefore, HDAC2 may positively control Aurora A transcription in PDAC cells.
The significance of primary cilia in PDAC cells is still enigmatic. Hedgehog signaling, which is critical for development of many cancers, including PDAC 39, is known to require primary cilia in vertebrates 40. PDAC cells exhibit active Hh signaling, leading to initiation and metastasis of PDAC 6, 41. Primary cilia in pancreatic epithelial cells were reported to impede inappropriate Hh activation 42. It has been also shown that Kras signaling promotes Hh signaling in PDAC cells 43. These studies raise the possibility that oncogenic Kras signaling‐dependent abrogation of primary cilia may contribute to enhanced Hh signaling. Moreover, it was recently shown that combined inhibition of Kras effectors and HDACs has drastic therapeutic effects against PDAC cells 44. Since we demonstrated that Kras and HDAC2 independently induce loss of primary cilia in PDAC cells, restoration of primary cilia by inhibition of Kras and HDAC2 may be essential for therapeutic efficacy. Future studies will be needed to elucidate whether and how primary cilia play roles in PDAC development and progression, and cilia‐dependent Hh signaling.
Materials and Methods
Cell culture, plasmids, and reagents
Panc1, RPE1, and U87‐MG cells were grown in DMEM supplemented with 10% FBS. CFPAC1 cells were grown in IMDM supplemented with 10% FBS. IMCD3 cells were grown in DMEM:F12 supplemented with 10% FBS. Isolation and culture of KrasG12D PDEC (KrasPDEC) cells were carried out as described previously 27, 45.
To generate Flag‐tagged Aurora A protein, human Aurora A fragment encoding residues 1–1,212 was amplified by PCR and sub‐cloned into pCMV5‐Flag 46. pCMV6‐XL4‐hHDAC2 was obtained from ORIGENE. Aurora A/D274N, HDAC2/H142A, siRNA‐resistant HDAC2, and HDAC2/H142A constructs were made by PCR‐based mutagenesis using the following primers. Aurora A/D274N: AATTTTGGGTGGTCAGTACATGCT and TGCAATTTTAAGCTCTCCAGCTGA underlined nucleotides resulted in conversion of D to A at position 274. HDAC2/H142A: GCTGCTAAGAAATCAGAAGCATCA and ATGTAATCCTCCAGCCCAATTAAC underlined nucleotides resulted in conversion of H to A at position 142. siRNA‐resistant HDAC2: GCCACAGCGGAAGAAATGACAAA and CTTGTGGGGCCTATATATTTCCA underlined nucleotides resulted in silent mutations at positions at 58, 59, 61, and 62. pEGFP‐C1 was transfected to express GFP in cells. Plasmid transfection into Panc1 and IMCD3 cells was performed using Lipofectamine 2000 (Invitrogen) according to the manufacturer's instruction. Reagents used in this study included TSA, VPA, tubacin (all from Sigma‐Aldrich), MS275 (Santa Cruz), depsipeptide/FK228 (BioVision), PHA‐680632 (Selleckchem), and alisertib (ChemScene).
Antibodies
Antibodies used in this study included anti‐HDAC1 (Millipore), anti‐HDAC2, anti‐Ki67, anti‐Aurora A (for immunoprecipitation) (all from Abcam), anti‐Aurora A (for immunoblotting and immunostaining), anti‐phospho‐JNK, anti‐phospho‐p38 (all from Cell signaling), anti‐Kras, anti‐IFT88, anti‐Arl13b (all from Proteintech), anti‐glutamylated tubulin (GT335) (Adipogen), anti‐HDAC6 (Upstate), anti‐α‐tubulin, anti‐β‐actin, anti‐Flag, anti‐acetylated tubulin (all from Sigma‐Aldrich), anti‐JNK, anti‐p38, anti‐PARP, and anti‐cyclin D1 (all from SantaCruz).
RNAi
Synthetic siRNA oligonucleotides were obtained from Dharmacon or Ambion. Transfection of siRNAs using Lipofectamine RNAiMAX (Invitrogen) was performed according to the manufacturer's instruction. The siRNA for luciferase (siControl) was 5′‐CGTACGCGGAATACTTCGA‐3′. The siRNAs for human HDAC2 were #1: 5′‐CCAATGAGTTGCCATATAA‐3′; and #2: 5′‐CCATAAAGCCACTGCCGAA‐3′. The siRNAs for human HDAC1 (SmartPool) were #1: 5′‐CTAATGAGCTTCCATACAA‐3′, #2: 5′‐GAAAGTCTGTTACTACTAC‐3′, #3: 5′‐GGACATCGCTGTGAATTGG‐3′, and #4: 5′‐CCGGTCATGTCCAAAGTAA‐3′. The siRNA for human HDAC6 was 5′‐GGGAGGTTCTTGTGAGATC‐3′. The siRNA for Kras was 5′‐GGAGGGCTTTCTTTGTGTA‐3′. The siRNAs for mouse HDAC1 (SmartPool) were #1: 5′‐ACACAGAGATCCCTAATGA‐3′, #2: 5′‐GAACTCTTCTAACTTCAAA‐3′, #3: 5′‐ACAATTTGCTGCTCAACTA‐3′, #4: 5′‐GAGGAAGAGTTCTCGGACT‐3′. The siRNAs for mouse HDAC2 (SmartPool) were #1: 5′‐CCAATGAGTTGCCATATAA‐3′, #2: 5′‐CAATTGGGCTGGAGGACTA‐3′, #3: 5′‐GGACAGGCTTGGTTGTTTC‐3′, #4: 5′‐GATTTAACGTCGGAGAAGA‐3′. The siRNA for human IFT88 was 5′‐GGCAGTTACTAGACCTATA‐3′.
Western blotting
Cells were lysed with lysis buffer (50 mM Hepes pH 7.5, 150 mM NaCl, 5 mM EDTA/pH 8, 0.5% NP‐40, 1 mM DTT, 0.5 mM PMSF, 2 μg/ml leupeptin, 10% glycerol, 5 mM NaF, 10 mM β‐glycerophosphate, and 1 mM Na3VO4) at 4°C for 30 min. 10 μg of lysates was loaded and analyzed by SDS–PAGE and immunoblotting.
Immunofluorescence microscopy
Cells were fixed with cold methanol for 5 min or 4% PFA in PBS for 10 min and permeabilized with 0.2% Triton X‐100/PBS for 10 min. Slides were blocked with 5% BSA in PBS prior to incubation with primary antibodies. Secondary antibodies used were AlexaFluor488‐ or AlexaFluor594 (Invitrogen)‐conjugated goat anti‐mouse or anti‐rabbit IgG. Cells were stained with Hoechst33342 (Dojindo) to visualize DNA. Mounted slides with PermaFluor Mounting Medium (Thermo Scientific) were observed and photographed using AxioObserver (Zeiss) with a 63× lens. Image analysis was performed using Photoshop (Adobe).
Quantitative PCR
Total RNA was isolated from cultured cells using Sepasol (Nacalai), and following reverse transcription reaction was performed using ReverTra Ace qPCR RT kit (TOYOBO). Quantitative PCR was performed using THUNDERBIRD SYBR qPCR mix (TOYOBO) and LightCycler96 (Roche). All reaction was performed according to manufacturer's instruction. Primers are listed in Appendix Table S1.
Flow cytometry
Cell cycle distribution was monitored by propidium iodide staining as described previously 36 and analyzed using FACS Calibur (Beckton Dickinson).
Aurora A kinase assay
Cells were lysed with lysis buffer at 4°C for 30 min. For immunoprecipitation, 0.5 mg of the resulting supernatant after centrifugation was incubated with anti‐Aurora A or control rabbit IgG (SIGMA) at 4°C for 1 h and collected using protein A‐Sepharose. The resin was washed with lysis buffer and resuspended with Kinase buffer (50 mM Tris–HCl pH 7.5, 20 mM MgCl2, 0.1 mg/ml BSA, 0.05 mM DTT). The reaction was initiated by incubating the resin in Kinase buffer for 60 min at 30°C with 0.5 μg histone H3 (NEB) and 50 μM ATP. ADP produced during kinase reaction was measured using ADP‐Glo kinase assay (Promega) according to the manufacturer's instruction. The reaction mixture was transferred to a 96‐well plate, and luminescence was measured using ARVO MX (PerkinElmer).
MTT assay
Cells in 96‐well plate were incubated with 0.5 mg/ml MTT (Nacalai) for 3 h in CO2 incubator. Cells were solubilized with solubilization buffer (90% isopropanol, 10% Triton X‐100, 0.1 N HCl) at 37°C for 2 h. The solution was transferred to a 96‐well plate, and absorbance was measured using ARVO MX.
Statistical analysis
The statistical significance of the difference between two means was determined using a two‐tailed Student's t‐test. Differences were considered significant when P < 0.05. **P < 0.01; *P < 0.05.
Author contributions
TK, KN, MT and YM performed experiments. TK, BDD and HI coordinated the study and oversaw all experiments. TK wrote the manuscript. All authors discussed the results and commented on the manuscript.
Conflict of interest
The authors declare that they have no conflict of interest.
Supporting information
Appendix
Expanded View Figures PDF
Review Process File
Acknowledgements
We thank D. Bar‐Sagi and K.E. Lee for providing KrasPDEC cells. We thank K. Ikegami for providing IMCD3 cells. We thank S. Kim for valuable comments. T.K. was supported by grants from JSPS KAKENHI (26112712, 15K07931, 15H01215), The Kurata Memorial Hitachi Science and Technology Foundation, Takeda Science Foundation, Daiichi Sankyo Foundation of Life Science, Sagawa Foundation for Promotion of Cancer Research, Mochida Memorial Foundation for Medical and Pharmaceutical Research and Foundation for Nara Institute of Science and Technology. B.D.D. was supported by NIH grant R01HD069647 and 9R01GM120776‐05A1.
EMBO Reports (2017) 18: 334–343
References
- 1. Ishikawa H, Marshall WF (2011) Ciliogenesis: building the cell's antenna. Nat Rev Mol Cell Biol 12: 222–234 [DOI] [PubMed] [Google Scholar]
- 2. Kobayashi T, Dynlacht BD (2011) Regulating the transition from centriole to basal body. J Cell Biol 193: 435–444 [DOI] [PMC free article] [PubMed] [Google Scholar]
- 3. Sánchez I, Dynlacht BD (2016) Cilium assembly and disassembly. Nat Cell Biol 18: 711–717 [DOI] [PMC free article] [PubMed] [Google Scholar]
- 4. Hassounah NB, Bunch TA, McDermott KM (2012) Molecular pathways: the role of primary cilia in cancer progression and therapeutics with a focus on Hedgehog signaling. Clin Cancer Res 18: 2429–2435 [DOI] [PMC free article] [PubMed] [Google Scholar]
- 5. Seeger‐Nukpezah T, Little JL, Serzhanova V, Golemis EA (2013) Cilia and cilia‐associated proteins in cancer. Drug Discov Today Dis Mech 10: e135–e142 [DOI] [PMC free article] [PubMed] [Google Scholar]
- 6. Bailey JM, Mohr AM, Hollingsworth MA (2009) Sonic hedgehog paracrine signaling regulates metastasis and lymphangiogenesis in pancreatic cancer. Oncogene 28: 3513–3525 [DOI] [PMC free article] [PubMed] [Google Scholar]
- 7. Seeley ES, Carrière C, Goetze T, Longnecker DS, Korc M (2009) Pancreatic cancer and precursor pancreatic intraepithelial neoplasia lesions are devoid of primary cilia. Cancer Res 69: 422–430 [DOI] [PMC free article] [PubMed] [Google Scholar]
- 8. Schraml P, Frew IJ, Thoma CR, Boysen G, Struckmann K, Krek W, Moch H (2009) Sporadic clear cell renal cell carcinoma but not the papillary type is characterized by severely reduced frequency of primary cilia. Mod Pathol 22: 31–36 [DOI] [PubMed] [Google Scholar]
- 9. Wong SY, Seol AD, So PL, Ermilov AN, Bichakjian CK, Epstein EH, Dlugosz AA, Reiter JF (2009) Primary cilia can both mediate and suppress Hedgehog pathway‐dependent tumorigenesis. Nat Med 15: 1055–1061 [DOI] [PMC free article] [PubMed] [Google Scholar]
- 10. Yuan K, Frolova N, Xie Y, Wang D, Cook L, Kwon YJ, Steg AD, Serra R, Frost AR (2010) Primary cilia are decreased in breast cancer: analysis of a collection of human breast cancer cell lines and tissues. J Histochem Cytochem 58: 857–870 [DOI] [PMC free article] [PubMed] [Google Scholar]
- 11. Nobutani K, Shimono Y, Yoshida M, Mizutani K, Minami A, Kono S, Mukohara T, Yamasaki T, Itoh T, Takao S et al (2014) Absence of primary cilia in cell cycle‐arrested human breast cancer cells. Genes Cells 19: 141–152 [DOI] [PubMed] [Google Scholar]
- 12. Menzl I, Lebeau L, Pandey R, Hassounah NB, Li FW, Nagle R, Weihs K, McDermott KM (2014) Loss of primary cilia occurs early in breast cancer development. Cilia 3: 7 [DOI] [PMC free article] [PubMed] [Google Scholar]
- 13. Egeberg DL, Lethan M, Manguso R, Schneider L, Awan A, Jørgensen TS, Byskov AG, Pedersen LB, Christensen ST (2012) Primary cilia and aberrant cell signaling in epithelial ovarian cancer. Cilia 1: 15 [DOI] [PMC free article] [PubMed] [Google Scholar]
- 14. Hassounah NB, Nagle R, Saboda K, Roe DJ, Dalkin BL, McDermott KM (2013) Primary cilia are lost in preinvasive and invasive prostate cancer. PLoS ONE 8: e68521 [DOI] [PMC free article] [PubMed] [Google Scholar]
- 15. Han YG, Kim HJ, Dlugosz AA, Ellison DW, Gilbertson RJ, Alvarez‐Buylla A (2009) Dual and opposing roles of primary cilia in medulloblastoma development. Nat Med 15: 1062–1065 [DOI] [PMC free article] [PubMed] [Google Scholar]
- 16. Gradilone SA, Radtke BN, Bogert PS, Huang BQ, Gajdos GB, LaRusso NF (2013) HDAC6 inhibition restores ciliary expression and decreases tumor growth. Cancer Res 73: 2259–2270 [DOI] [PMC free article] [PubMed] [Google Scholar]
- 17. Yang Y, Roine N, Mäkelä TP (2013) CCRK depletion inhibits glioblastoma cell proliferation in a cilium‐dependent manner. EMBO Rep 14: 741–747 [DOI] [PMC free article] [PubMed] [Google Scholar]
- 18. Kim J, Dabiri S, Seeley ES (2011) Primary cilium depletion typifies cutaneous melanoma in situ and malignant melanoma. PLoS ONE 6: e27410 [DOI] [PMC free article] [PubMed] [Google Scholar]
- 19. Feng W, Zhang B, Cai D, Zou X (2014) Therapeutic potential of histone deacetylase inhibitors in pancreatic cancer. Cancer Lett 347: 183–190 [DOI] [PubMed] [Google Scholar]
- 20. Eser S, Schnieke A, Schneider G, Saur D (2014) Oncogenic KRAS signalling in pancreatic cancer. Br J Cancer 111: 817–822 [DOI] [PMC free article] [PubMed] [Google Scholar]
- 21. Haberland M, Montgomery RL, Olson EN (2009) The many roles of histone deacetylases in development and physiology: implications for disease and therapy. Nat Rev Genet 10: 32–42 [DOI] [PMC free article] [PubMed] [Google Scholar]
- 22. Pugacheva EN, Jablonski SA, Hartman TR, Henske EP, Golemis EA (2007) HEF1‐dependent Aurora A activation induces disassembly of the primary cilium. Cell 129: 1351–1363 [DOI] [PMC free article] [PubMed] [Google Scholar]
- 23. Sumi S, Beauchamp RD, Townsend CM, Pour PM, Ishizuka J, Thompson JC (1994) Lovastatin inhibits pancreatic cancer growth regardless of RAS mutation. Pancreas 9: 657–661 [DOI] [PubMed] [Google Scholar]
- 24. Nielsen SK, Møllgård K, Clement CA, Veland IR, Awan A, Yoder BK, Novak I, Christensen ST (2008) Characterization of primary cilia and Hedgehog signaling during development of the human pancreas and in human pancreatic duct cancer cell lines. Dev Dyn 237: 2039–2052 [DOI] [PubMed] [Google Scholar]
- 25. Carew JS, Giles FJ, Nawrocki ST (2008) Histone deacetylase inhibitors: mechanisms of cell death and promise in combination cancer therapy. Cancer Lett 269: 7–17 [DOI] [PubMed] [Google Scholar]
- 26. Agbunag C, Bar‐Sagi D (2004) Oncogenic K‐ras drives cell cycle progression and phenotypic conversion of primary pancreatic duct epithelial cells. Cancer Res 64: 5659–5663 [DOI] [PubMed] [Google Scholar]
- 27. Agbunag C, Lee KE, Buontempo S, Bar‐Sagi D (2006) Pancreatic duct epithelial cell isolation and cultivation in two‐dimensional and three‐dimensional culture systems. Methods Enzymol 407: 703–710 [DOI] [PubMed] [Google Scholar]
- 28. Jackson EL, Willis N, Mercer K, Bronson RT, Crowley D, Montoya R, Jacks T, Tuveson DA (2001) Analysis of lung tumor initiation and progression using conditional expression of oncogenic K‐ras. Genes Dev 15: 3243–3248 [DOI] [PMC free article] [PubMed] [Google Scholar]
- 29. Li D, Zhu J, Firozi PF, Abbruzzese JL, Evans DB, Cleary K, Friess H, Sen S (2003) Overexpression of oncogenic STK15/BTAK/Aurora A kinase in human pancreatic cancer. Clin Cancer Res 9: 991–997 [PubMed] [Google Scholar]
- 30. Furukawa T, Kanai N, Shiwaku HO, Soga N, Uehara A, Horii A (2006) AURKA is one of the downstream targets of MAPK1/ERK2 in pancreatic cancer. Oncogene 25: 4831–4839 [DOI] [PubMed] [Google Scholar]
- 31. Fritsche P, Seidler B, Schüler S, Schnieke A, Göttlicher M, Schmid RM, Saur D, Schneider G (2009) HDAC2 mediates therapeutic resistance of pancreatic cancer cells via the BH3‐only protein NOXA. Gut 58: 1399–1409 [DOI] [PubMed] [Google Scholar]
- 32. Schüler S, Fritsche P, Diersch S, Arlt A, Schmid RM, Saur D, Schneider G (2010) HDAC2 attenuates TRAIL‐induced apoptosis of pancreatic cancer cells. Mol Cancer 9: 80 [DOI] [PMC free article] [PubMed] [Google Scholar]
- 33. Dovey OM, Foster CT, Cowley SM (2010) Histone deacetylase 1 (HDAC1), but not HDAC2, controls embryonic stem cell differentiation. Proc Natl Acad Sci USA 107: 8242–8247 [DOI] [PMC free article] [PubMed] [Google Scholar]
- 34. Guan JS, Haggarty SJ, Giacometti E, Dannenberg JH, Joseph N, Gao J, Nieland TJ, Zhou Y, Wang X, Mazitschek R et al (2009) HDAC2 negatively regulates memory formation and synaptic plasticity. Nature 459: 55–60 [DOI] [PMC free article] [PubMed] [Google Scholar]
- 35. Fu J, Bian M, Jiang Q, Zhang C (2007) Roles of Aurora kinases in mitosis and tumorigenesis. Mol Cancer Res 5: 1–10 [DOI] [PubMed] [Google Scholar]
- 36. Kobayashi T, Tsang WY, Li J, Lane W, Dynlacht BD (2011) Centriolar kinesin Kif24 interacts with CP110 to remodel microtubules and regulate ciliogenesis. Cell 145: 914–925 [DOI] [PubMed] [Google Scholar]
- 37. Kim S, Lee K, Choi JH, Ringstad N, Dynlacht BD (2015) Nek2 activation of Kif24 ensures cilium disassembly during the cell cycle. Nat Commun 6: 8087 [DOI] [PMC free article] [PubMed] [Google Scholar]
- 38. Miyamoto T, Hosoba K, Ochiai H, Royba E, Izumi H, Sakuma T, Yamamoto T, Dynlacht BD, Matsuura S (2015) The microtubule‐depolymerizing activity of a mitotic kinesin protein KIF2A drives primary cilia disassembly coupled with cell proliferation. Cell Rep 10: 664–673 [DOI] [PMC free article] [PubMed] [Google Scholar]
- 39. Teglund S, Toftgård R (2010) Hedgehog beyond medulloblastoma and basal cell carcinoma. Biochim Biophys Acta 1805: 181–208 [DOI] [PubMed] [Google Scholar]
- 40. Rohatgi R, Milenkovic L, Scott MP (2007) Patched1 regulates hedgehog signaling at the primary cilium. Science 317: 372–376 [DOI] [PubMed] [Google Scholar]
- 41. Feldmann G, Fendrich V, McGovern K, Bedja D, Bisht S, Alvarez H, Koorstra JB, Habbe N, Karikari C, Mullendore M et al (2008) An orally bioavailable small‐molecule inhibitor of Hedgehog signaling inhibits tumor initiation and metastasis in pancreatic cancer. Mol Cancer Ther 7: 2725–2735 [DOI] [PMC free article] [PubMed] [Google Scholar]
- 42. Cervantes S, Lau J, Cano DA, Borromeo‐Austin C, Hebrok M (2010) Primary cilia regulate Gli/Hedgehog activation in pancreas. Proc Natl Acad Sci USA 107: 10109–10114 [DOI] [PMC free article] [PubMed] [Google Scholar]
- 43. Ji Z, Mei FC, Xie J, Cheng X (2007) Oncogenic KRAS activates hedgehog signaling pathway in pancreatic cancer cells. J Biol Chem 282: 14048–14055 [DOI] [PubMed] [Google Scholar]
- 44. Ischenko I, Petrenko O, Hayman MJ (2015) A MEK/PI3K/HDAC inhibitor combination therapy for KRAS mutant pancreatic cancer cells. Oncotarget 6: 15814–15827 [DOI] [PMC free article] [PubMed] [Google Scholar]
- 45. Lee KE, Bar‐Sagi D (2010) Oncogenic KRas suppresses inflammation‐associated senescence of pancreatic ductal cells. Cancer Cell 18: 448–458 [DOI] [PMC free article] [PubMed] [Google Scholar]
- 46. Kobayashi T, Hori Y, Ueda N, Kajiho H, Muraoka S, Shima F, Kataoka T, Kontani K, Katada T (2009) Biochemical characterization of missense mutations in the Arf/Arl‐family small GTPase Arl6 causing Bardet‐Biedl syndrome. Biochem Biophys Res Commun 381: 439–442 [DOI] [PubMed] [Google Scholar]
Associated Data
This section collects any data citations, data availability statements, or supplementary materials included in this article.
Supplementary Materials
Appendix
Expanded View Figures PDF
Review Process File