

Abstract
Cell activation is a vital step for T‐cell memory/effector differentiation as well as for productive HIV infection. To identify novel regulators of this process, we used next‐generation sequencing to profile changes in microRNA expression occurring in purified human naive CD4 T cells in response to TCR stimulation and/or HIV infection. Our results demonstrate, for the first time, the transcriptional up‐regulation of miR‐34c‐5p in response to TCR stimulation in naive CD4 T cells. The induction of this miR was further consistently found to be reduced by both HIV‐1 and HIV‐2 infections. Overexpression of miR‐34c‐5p led to changes in the expression of several genes involved in TCR signaling and cell activation, confirming its role as a novel regulator of naive CD4 T‐cell activation. We additionally show that miR‐34c‐5p promotes HIV‐1 replication, suggesting that its down‐regulation during HIV infection may be part of an anti‐viral host response.
Keywords: HIV‐1, HIV‐2, miR‐34c‐5p, naive CD4 T cells, T‐cell activation
Subject Categories: Immunology; Microbiology, Virology & Host Pathogen Interaction
Introduction
CD4 T helper cells are the central orchestrators of immune responses. Priming of naive CD4 T cells via their specific T‐cell receptor (TCR) induces distinctive gene expression programs leading to cell activation, proliferation, and ultimately differentiation into specialized subsets of effector and regulatory cells (Yamane & Paul, 2013). This complex chain of events has been shown to be tightly regulated by microRNAs (miRs; Pagani et al, 2013). miRs function as post‐transcriptional regulators that can serve as fine‐tuning modulators, buffers, on–off, or delay switches that coordinate the expression of up to several hundreds of genes in a short time (Flynt & Lai, 2008). miRs are 22–23 nt small non‐coding RNAs, generated from larger precursor transcripts by the enzymes Drosha and Dicer, which negatively regulate gene expression by direct base‐pairing interactions with target mRNA molecules as part of the RISC miR‐protein complex (Bartel, 2004). These miR‐dependent interactions inhibit translation and may result in the degradation of the targeted mRNA. Early studies of miR function identified the Dicer pathway as a critical regulator of T‐cell differentiation (Cobb et al, 2005; Muljo et al, 2005). Subsequently, several miRs have been reported to be critical for immune system function (reviewed by Kroesen et al, 2015). Among the immunologically relevant miRs, miR‐155‐5p is a particularly important example, being induced early following receptor‐mediated activation in both B and T cells (Rodriguez et al, 2007; Thai et al, 2007), and linked to effector/suppressor T‐cell differentiation (Banerjee et al, 2010; Lu et al, 2015). Hence, in line with studies in many other biological systems, miRs have emerged as critical regulators of T‐cell activation and function.
Previous studies addressing the role of miRs in T‐cell activation have mainly utilized T‐cell lines (Rossi et al, 2011). Moreover, the few studies using human primary cells focused on bulk CD4 T cells, which include multiple T helper cell subsets with distinct properties (Farber et al, 2013). There are very limited data on naive CD4 T cells (Pagani et al, 2013), a relatively homogeneous population considered fundamental in ensuring lifelong immune competence. Naive CD4 T cells have a diverse TCR repertoire, allowing responsiveness to novel pathogens, and broad potential for differentiation into distinct effector CD4 T helper subsets (Surh & Sprent, 2008).
CD4 T cells are the main targets of human immunodeficiency virus (HIV) infection, which depends on cell activation for efficient viral replication and sustained production of new infectious virus particles (Stevenson et al, 1990; Rice & Kimata, 2015). Quiescent naive CD4 T cells can be infected by HIV‐1 (Chavez et al, 2015). Nevertheless, they feature a limited ability to support viral production (Chavez et al, 2015). This was proposed to be mainly due to the activity of SAMHD1, a host restriction factor that is down‐regulated upon TCR stimulation (Baldauf et al, 2012). Interestingly, SAMHD1 is counteracted by Vpx, a viral protein that is encoded by HIV‐2 and some SIV strains, but not by HIV‐1 (Baldauf et al, 2012; Chauveau et al, 2015). The regulatory interplay between HIV and host miRs and its possible influence on replication efficiency is a matter of active debate (reviewed by Barichievy et al, 2015).
To further investigate the connection between miRs, T‐cell activation and HIV replication in a biologically relevant context, we decided to focus on human naive CD4 T cells and generate an in‐depth view of their miR expression profile and of the changes it undergoes in response to TCR stimulation and/or HIV infection. For this purpose, we purified naive CD4 T cells from the blood of seronegative individuals, stimulated them via TCR, infected both non‐stimulated and TCR‐stimulated cells with either HIV‐1 or HIV‐2, and produced small RNA libraries for expression profiling by next‐generation sequencing (NGS). Our results identify miR‐34c‐5p as a common link between both processes, impacting on several pathways critical for cell activation and HIV replication.
Results
MicroRNA profile of human naive CD4 T cells and the impact of HIV infection
The miRNA profile of human naive CD4 T cells has yet to be fully characterized (Pagani et al, 2013). We used NGS at high sequencing depth to generate an unbiased microRNA expression profile from small RNAs isolated from purified human naive CD4 T cells of healthy blood donors. Due to the low amount of RNA obtained from each individual, total RNA from three donors was pooled prior to library generation. Two independent sequencing libraries of naive CD4 T cells were produced with > 6 × 10⁶ reads.
A total of 519 distinct mature miRs were detected across both libraries (Fig 1A), the majority of which (~69%) were expressed at very low levels (< 100 reads), although more than 105 reads were detected for each of the eight most highly expressed miRs. The most abundant miRs in human naive CD4 T cells were miR‐146b‐5p, miR‐21‐5p, miR‐let‐7a‐5p, and miR‐101‐3p (Fig 1A).
Figure 1. miR expression profile of naive CD4 T cells and impact of HIV infection.

-
ARelative abundance of miR species in human naive CD4 T cells. Cell purity was > 97%.
-
B, CAverage miR expression levels in unstimulated naive CD4 T cells non‐infected versus HIV‐1NL4‐3‐(B) or HIV‐2ROD‐(C) infected after 24 h (n = 2, three pooled samples per library). Mean normalized read counts across libraries are shown. Library normalization was performed using the mean normalization method available in the Deseq package of Bioconductor (Anders & Huber, 2010). Lines indicate changes of ± 1log2 fold between samples.
The remaining 20% of reads that did not map to known miRs were annotated as “other non‐coding small RNAs”, “protein‐coding features”, or “unknown transcripts”. Reads classified as unknown transcripts and displaying 22–23 nt in size were investigated as possible novel miRNAs. Results revealed the presence of several novel miRNA gene candidates, all of which were expressed at very low levels (< 0.01% of the total miR reads), precluding their experimental validation (Table EV1).
It has been increasingly reported that HIV infection impacts on quiescent cells despite their inability to support productive viral replication (Doitsh et al, 2010; Chavez et al, 2015; Zerbato et al, 2016). Moreover, the HIV‐2 accessory protein Vpx has been shown to counteract the role of the host restriction factor SAMHD1 (Chauveau et al, 2015), which limits HIV‐1 replication in naive CD4 T cells (Baldauf et al, 2012). However, so far the impact of HIV‐1 on miR expression has only been assessed in the context of infected cell lines or activated T cells. We therefore asked whether HIV‐1 or HIV‐2 infection alters the miR profile of human naive CD4 T cells. For this purpose, we performed a parallel infection of naive CD4 T cells from the same set of donors for 24 h with either HIV‐1NL4‐3 or HIV‐2ROD molecular clones, using a comparable number of viral copies of both viruses. RNA samples isolated from these cells were pooled as before to generate two small RNA‐seq libraries for each condition (control, HIV‐1‐infected, and HIV‐2‐infected).
Comparison of the NGS profile between control and infected libraries revealed a similar miR expression levels irrespective of HIV infection. As shown in Fig 1B and C, we did not detect a significant effect of either HIV‐1 or HIV‐2 infection on the miR profile of unstimulated naive CD4 T cells. This occurred in spite of evidence of viral entry and subsequent retrotranscription (Fig EV1A). Additionally, we observed that the major determinant for sample clustering was the donor pool rather than the infection status (Fig EV1B). This implies that HIV had no major effect and genetic distances were solely imposed by the individual's genetic backgrounds.
Figure EV1. HIV infection parameters in sequencing library samples.
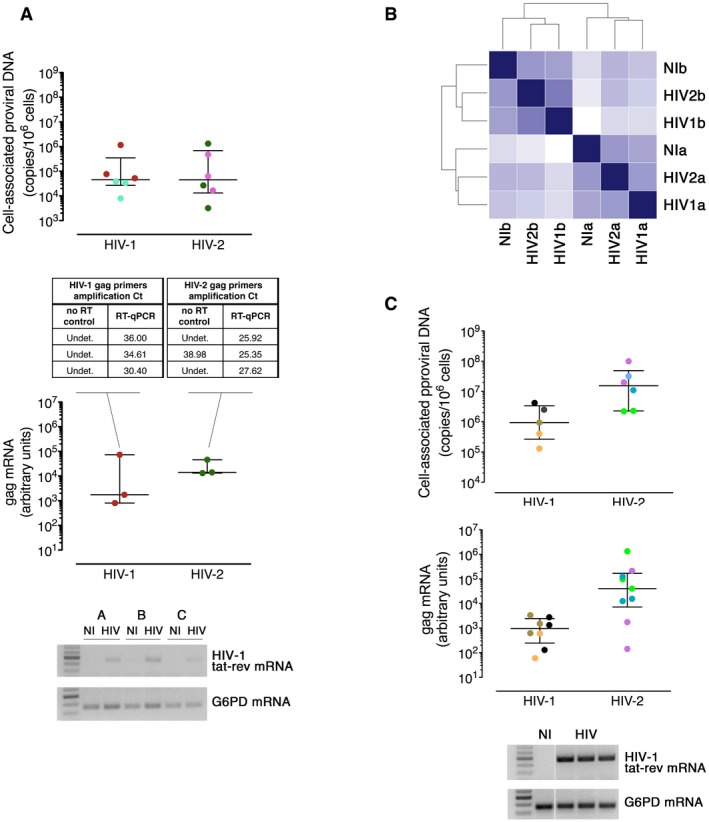
- Cell‐associated proviral DNA (top) and gag mRNA (center) levels upon HIV‐1 and HIV‐2 infections of the naive CD4 T cells used to generate the sequencing libraries analyzed in Fig 1. Each dot represents one individual, with color identifying the individual samples pooled together for subsequent NGS analysis. Whiskers represent the median and interquartile range. Bottom: Illustrative semi‐quantitative PCR for HIV‐1 tat‐rev spliced mRNA from naive CD4 T cells non‐infected (NI) or HIV‐1‐infected (HIV) along with G6PC housekeeping gene.
- Hierarchical clustering of the normalized expression counts of all miRNA species in sequencing libraries from unstimulated CD4 T cells, either non‐infected (NI) or infected with HIV (HIV1 or HIV2). Index a and index b identify paired libraries generated by pooling samples from the same set of three donors.
- Levels of cell‐associated proviral DNA (top) and gag mRNA (center) upon HIV‐1 and HIV‐2 infections of the TCR‐stimulated naive CD4 T‐cell samples used to generate the sequencing libraries analyzed in Fig 3. Each dot represents one individual, with individual samples pooled together for subsequent NGS analysis identified by the same color. Whiskers represent median and interquartile range. Bottom: Illustrative semi‐quantitative PCR for HIV‐1 tat‐rev spliced mRNA from stimulated naive CD4 T cells non‐infected (NI) or HIV‐1‐infected (HIV), and G6PD housekeeping gene.
Source data are available online for this figure.
Overall, our data support a lack of impact of both HIV‐1 and HIV‐2 infections on the miR expression profile of quiescent naive CD4 T cells.
Modulation of human naive CD4 T‐cell miR profile upon TCR stimulation
To address how the naive CD4 T‐cell microRNome is altered in response to TCR stimulation, we stimulated purified naive CD4 T cells from healthy individuals in vitro for 72 h with immobilized anti‐CD3 and soluble anti‐CD28 monoclonal antibodies (mAb). Total RNA from these samples was pooled to generate two sets of paired small RNA‐seq libraries of unstimulated and stimulated naive cells.
Analysis of these datasets revealed that the average expression level of approximately half of the miRs displayed slight changes in response to TCR stimulation (log2 fold change > 1 or < −1), of which ~60% were down‐regulated (Figs 2A and EV2A). However, significant changes in expression were only observed for miR‐155‐5p and miR‐34c‐5p, with a 5.4 and 8.2log2 fold increase in miR abundance, respectively (Fig 2A).
Figure 2. miR‐34c‐5p is up‐regulated in naive CD4 T cells in response to TCR‐mediated stimulation.

- Average miR expression levels in naive CD4 T cells (purity > 97%) before and after 72 h TCR stimulation. Lines indicate changes of ± 1 log2 fold between samples (n = 2, paired pools of three and nine individual samples per library). Library normalization performed using the mean normalization method available in Deseq package of Bioconductor (Anders & Huber, 2010). miRs with significant changes are highlighted (black) and with insets presenting mean read counts in unstimulated samples (mean), log2 fold change values in stimulated samples (log FC), and corresponding adjusted P‐value (P; Fisher's test implemented in Deseq). The two most highly expressed miRs (mir‐21‐5p and miR‐146b‐5p) are also indicated.
- Relative miR‐34c‐5p and miR‐155‐5p expression levels (2−ΔCt normalized to RNU48) in unstimulated and stimulated naive CD4 T cells of individual samples pooled to generate the sequencing libraries. Mean ± SEM and P‐value for differences in miR‐155‐5p expression (paired two‐tailed t‐test) are shown. Comparison could not be performed for miR‐34c‐5p as it is undetermined in unstimulated samples.
- Time‐course quantification of miR‐34c‐5p expression (top panel, 2−ΔCt values), cell proliferation (middle panel), and cell activation (bottom panel) markers by flow cytometry, in three different donors.
Figure EV2. Changes in naive CD4 T‐cell miR expression profile in response to TCR stimulation.

- Relative abundance of miR species after 72 h TCR stimulation.
- miR‐34c‐5p detection sensitivity assay. Plot shows Ct values for serial 1:5 dilutions of a miR mimic standard. Number of molecules in each data point is indicated, as well as information regarding the exponential fit and estimate of the number of molecules that correspond to the maximum Ct cycles of standard qPCR assays.
- Compiled data for relative miR‐34s‐5p expression (normalized to RNU48) in the 10 individual samples analyzed in Figs 2B and C, and EV2E. To allow for fold change calculation and statistical comparison, undetermined Ct values for non‐stimulated samples were set to 43 (red asterisk). Differences between conditions are significant with P < 0.05 (paired two‐tailed t‐test). Error bars are ± SEM.
- Comparative analysis of miR‐34c‐5p and miR‐155 levels. Illustrative fold change in miR abundance for one of the individual samples in the time‐course experiment in Fig 2C. For representation purposes of the RT–qPCR data, miR‐34c‐5p CtT0=40.
- Time‐course of pri‐miR‐34c expression. Representative pri‐miR‐34c and G6PD housekeeping gene expression levels assessed by semi‐quantitative RT–PCR in 72 h TCR‐stimulated naive CD4 T cells (top, one out of 3), and levels of mature miR‐34c‐5p quantified in parallel by RT–qPCR (2−ΔCt; bottom) with the statistics for variation along time in the three samples tested shown in the table below (ANOVA test).
Source data are available online for this figure.
Although miR‐155‐5p has been consistently reported to be up‐regulated in response to activation in both B and T cells (Haasch et al, 2002; Kluiver et al, 2005), miR‐34c‐5p has not been previously described as being involved in this process. The differential expression of these miRs by RT–qPCR was validated in individual RNA samples to exclude the possibility of an analysis bias in our NGS study due to the pooling of RNA samples from different individuals. As shown in Fig 2B, results were found to be in good agreement with the NGS quantification for both miR‐155‐5p and miR‐34c‐5p. miR‐34c‐5p expression was below the RT–qPCR detection limit (Fig EV2B) in unstimulated naive CD4 T cells and became clearly detectable in stimulated cells in all individuals tested (Figs 2B and EV2C), supporting the conclusion that it is strongly induced in response to TCR stimulation.
We next performed a time‐course study to investigate the dynamics of the observed miR‐34c‐5p induction. Naive CD4 T cells from healthy donors were kept in culture for an additional 72 h after removal of the TCR stimulus, and we monitored proliferation and cell activation by flow cytometry using the markers Ki67 and CD71, respectively, and quantified miR‐34c‐5p expression levels at 24 h intervals. As before, the miR‐34c‐5p expression level was below the quantification limit in naive cells and displayed a significant increase that extended well beyond the 72 h time‐point, starting to decline around the same time cell proliferation stabilized (Fig 2C). This response occurred at a later time‐point than the one observed for miR‐155‐5p (see Fig EV2D) and was barely seen in the case of one donor, whose naive CD4 T cells displayed minimal proliferation and activation after TCR stimulation (Fig 2C). This result confirmed the dependence of miR‐34c‐5p induction on the ability of naive cells to efficiently respond to TCR signaling.
To investigate whether the accumulation of mature miR‐34c‐5p resulted from increased transcription, we evaluated the expression of both the miR and its primary transcript by semi‐quantitative RT–PCR in an independent time‐course study with different individuals. The primary transcript was undetectable in unstimulated naive CD4 T cells, but increased upon TCR‐mediated stimulation with similar kinetics to the mature miR‐34c‐5p (Fig EV2E).
We conclude that miR‐34c‐5p transcription is induced by TCR‐mediated signaling, resulting in an increase in mature miR expression levels, which then decline as cell proliferation plateaus. These results identify miR‐34c‐5p as a novel player in the naive CD4 T‐cell activation pathway.
Activation induced miR‐34c‐5p expression is down‐regulated upon HIV infection
In order to identify miRs that connect the process of T‐cell activation and HIV infection, we generated additional small RNA‐seq libraries to investigate the miR expression profile after HIV‐1 or HIV‐2 infections of in vitro stimulated naive CD4 T cells. For this purpose, cells isolated from healthy donors were subjected to a 72 h TCR stimulation as described above, followed by infection with HIV‐1NL4‐3 or HIV‐2ROD molecular clones for 24 h. Samples from three individuals were pooled as before for small RNA‐seq profiling. The infection status of the different cell samples was validated before pooling by quantification of cell‐associated proviral DNA and gag mRNA levels (Fig EV1C).
Comparison of uninfected and HIV‐infected small RNA‐seq libraries revealed that most of the changes in miR expression were less than twofold (Fig 3A and B). Of note, six miRs (miR‐34c‐5p, miR‐126‐3p, miR‐126‐5p, miR‐143‐3p, miR‐379‐5p, and miR‐1268a) were found to be differentially expressed in response to HIV‐1 infection (Table 1). miR‐34c‐5p was the only miR that displayed a consistent behavior in response to both HIV‐1 and HIV‐2 infections (−1.8log2 fold and −2.44log2 fold change, respectively; Fig 3A and B). RT–qPCR quantification of its expression in samples from individual donors confirmed that this effect was significant in response to both viruses (Fig 3C). Interestingly, the effect of either HIV‐1 or HIV‐2 infection on miR‐34c‐5p expression was the opposite of that seen for TCR stimulation.
Figure 3. Changes in miR expression in response to HIV infection of TCR‐stimulated naive CD4 T cells.

-
A, BComparison of the mean miR expression level in TCR‐stimulated naive CD4 T‐cell small RNA‐seq libraries from uninfected and HIV‐1NL4‐3‐(A) or HIV‐2ROD‐(B) infected samples (24 h). Only miRNAs with a minimum of 10 normalized read counts. Library normalization was performed using the mean normalization method available in Deseq package of Bioconductor (Anders & Huber, 2010). Lines indicate changes of ± 1log2 fold between samples (n = 3, paired pools of three individual samples per library). miR‐34c‐5p is highlighted in black.
-
CQuantification of miR‐34c‐5p expression levels of the individual samples pooled to generate the sequencing libraries by qPCR (mean ± SEM 2−ΔCt values and P‐value from a paired two‐tailed t‐test; n = 5).
Table 1.
Differentially expressed miRs in response to HIV‐1 or HIV‐2 infection of TCR‐stimulated naive CD4 T cells
| microRNA | Mean expression in stimulated naive CD4 T cells | HIV‐1 infection | HIV‐2 infection | ||
|---|---|---|---|---|---|
| Log2 FC | adj P | Log2 FC | adj P | ||
| hsa‐miR‐34c‐5p | 1,679.07 | −1.83 | 7.00E‐01 | −2.44 | 2.49E‐05 |
| hsa‐miR‐143‐3p | 3,622.56 | −2.79 | 2.35E‐07 | No change | na |
| hsa‐miR‐126‐3p | 3,811.84 | −2.14 | 6.89E‐04 | No change | na |
| hsa‐miR‐126‐5p | 12,086.65 | −1.68 | 2.68E‐02 | No change | na |
| hsa‐miR‐379‐5p | 977.22 | −2.04 | 2.26E‐02 | No change | na |
| hsa‐miR‐1268a | 8,906.17 | 2.35 | 2.25E‐02 | No change | na |
Only miRs with mean expression above 500 reads are reported; log2 FC, log2 fold change; no change, absolute log2 fold change smaller than 1; adj P, adjusted P‐value for detected fold change; na, not applicable. Only miRs with adj P < 0.05 are reported.
Overall, our data suggest that miR‐34c‐5p may represent an important link between the cellular pathways involved in T‐cell activation and HIV infection therefore warranting further investigation.
miR‐34c‐5p expression promotes HIV‐1 replication
Next, we asked whether miR‐34c‐5p impacts on HIV replication. For this purpose, we generated a model for miR overexpression using Jurkat T cells, in view of the low transfection efficiency in primary T cells. We chose this T‐cell line because it lacks miR‐34c‐5p expression (Fig EV3A). Cells were transfected with a pcDNA3 vector containing the pre‐miR‐34c‐5p precursor sequence and selected for antibiotic resistance, allowing us to isolate both pools and clones of stably transfected cells (J34c cells), in parallel with control cells transfected with the empty parental vector (JØ cells). Both pools of stably transfected cells and the derived clonal lines expressed high levels of the miR‐34c‐5p (Fig EV3A). Although by qPCR quantification we were unable to detect miR‐34c‐5p expression in JØ cells, considering the established detection limit (see Fig EV2B), we estimate that the levels of this miR in J34c correspond to a minimum increase of 700 fold. Of note, miR‐34c‐5p is expressed at higher levels than miR‐21, one of the most abundant miRs in T cells (see Figs EV3A and 1A; Figs 2A and EV2A for miR‐21 abundance in T cells).
Figure EV3. miR‐34c‐5p expression levels in Jurkat cell lines and clones and set‐up of antagomiR assays.

- Ct values for miR‐34c‐5p and miR‐21 in Jurkat cell lines stably transfected with the pcDNA3 empty vector (JØ) or pcDNA3 containing the pri‐miR‐34c‐5p sequence (J34c). JØ and J34c pools used for infection experiments presented in Fig 4 and in clonal populations isolated from each of these pools (JØ‐1 to 3 and J34c‐2, 4, and 5) used in the microarray profiling study presented in Fig 5 are shown. miR‐34c‐5p was undetectable in all JØ samples, in agreement with parental Jurkat cells. Table presents estimate of number of miR‐34c molecules in each sample based on the standard sensitivity curve presented in Fig EV2B and corresponding estimated fold increase.
- miR‐34c‐5p and miR‐21 levels in J34c cells treated with antagomiRs after 24 and 72 h (top) or 96 h (bottom) by RT–PCR. miR levels in untreated J34c and JØ are also shown (bottom). qPCR quantification of miR levels in cells treated with antagomiRs compared to untreated J34c cells is shown for one assay (right). Error bars are ± SD of technical replicates.
Source data are available online for this figure.
JØ and J34c cells were infected with HIV‐1NL4‐3, and the efficiency of viral infection and replication was assessed by measuring the levels of cell‐associated viral DNA, mRNA, and protein, as well as virus production, at 24 and 48 h. Although no significant increase in total proviral DNA was seen at either time‐point in J34c cells compared to JØ cells (Fig 4A, left), tat mRNA levels increased in J34c cells at both time‐points, reaching significance at 48 h post‐infection (Fig 4A, center). Moreover, the levels of virus particle production were also increased in the J34c infections at 48 h, as determined by RT activity in culture supernatant (Fig 4A, right). In agreement, intracellular levels of HIV‐1 Gag protein expression at 48 h measured by flow cytometry were found to be increased in infected J34c cells (Fig 4B).
Figure 4. Impact of miR‐34c‐5p expression on HIV infection and replication.

- Cell‐associated viral DNA levels (left), tat mRNA levels (center), and RT activity levels (right) in cell culture supernatants in infected J34c cells versus infected JØ cells at 24 and 48 h post‐infection. *P ≤ 0.05 (paired two‐tailed t‐test).
- Representative flow cytometry plot of intracellular HIV‐1 Gag protein staining (KC57) versus side scatter (SSC) in JØ and J34c cells, mock infected or infected with HIV‐1NL4‐3, after 48 h of culture and corresponding fold change (J34c/JØ) plot in four biological replicate assays. Differences to control were found to be significant with a paired two‐tailed t‐test (P ≤ 0.05).
- Fold change levels for miR‐34c‐5p, cell‐associated viral DNA level, tat mRNA, and RT activity levels in J34c cells treated with miR‐34c‐5p antagomiR versus control antagomiR, 48 h post‐infection. Differences to control were found to be significant with a paired two‐tailed t‐test (P ≤ 0.05).
In order to validate that this effect was a direct consequence of miR‐34c‐5p overexpression, we performed additional infections of J34c cells treated with cholesterol‐conjugated antagomiR against either the miR or control. Using a previously described protocol for miR knockdown in lymphocytes (Haftmann et al, 2015), we were able to obtain an efficient down‐regulation of miR‐34c‐5p after 24 h treatment that remained stable up to 96 h, as evaluated by qRT–PCR (Figs EV3B and 4C). Therefore, J34c cells were infected with HIV‐1NL4‐3 after 24 h antagomiR treatment in three independent experiments and viral parameters quantified after 48 h. The miR knockdown was associated with a decrease in the viral abundance in culture supernatants quantified by RT activity, confirming that miR‐34c‐5p has a facilitator role in viral production (Fig 4C). In agreement, a decrease in tat mRNA was also observed (Fig 4C). On the other hand, proviral DNA levels increased after miR knockdown, which supports a negative modulation of pre‐integration processes by miR‐34c‐5p, possibly contributing to reduce the establishment of viral reservoirs (Fig 4C).
Altogether, these results suggest that miR‐34c‐5p influences multiple pathways in the HIV cell cycle with a positive net result on HIV‐1 replication through a predominant effect on post‐integration events.
miR‐34c‐5p regulates genes involved in CD4 T‐cell signaling and function
To further investigate the pathways modulated by miR‐34c‐5p, the transcriptome of three J34c clones was profiled and compared with three control JØ clones using the Affymetrix Human Gene ST array v2.0 (Fig EV4). Differential expression (DE) analysis identified 82 protein‐coding genes with significant variation, with 78% of the 40 down‐regulated genes predicted to be potential miR‐34c‐5p targets (Fig 5A and Table EV2). We selected 10% of the DE genes, encompassing the range of fold changes and including both predicted miR‐34c‐5p targets and non‐target genes, for independent RT–qPCR quantification. mRNA levels of all of these genes varied in J34c cells relative to control in agreement with the microarray data, thus confirming the robustness of the DE analysis (Fig 5B).
Figure EV4. Quality control of the transcriptome profiling dataset of J34c and JØ cell lines with Affymetrix Human Gene 2.0 arrays.

- NUSE plot. Boxes represents interquartile range with median, whiskers represent range.
- RLE plot. Boxes represents interquartile range with median, whiskers represent range.
- Unsupervised clustering analysis of the transcriptome.
- Principal components analysis.
Figure 5. Impact of miR‐34c‐5p overexpression on Jurkat T cells.

- Hierarchical clustering of the 82 differentially expressed (DE) genes identified in Jurkat cell lines overexpressing miR‐34c‐5p (J34c‐2 and J34c‐5) versus control (JØ‐1, 2 and 3 clones). Color scale represents mean centered log2 fold expression level across samples. Pie charts represent the relative proportion of predicted miR‐34c‐5p binding sites by the Miranda or PITA algorithms (or both) in down‐regulated (top) and up‐regulated (bottom) gene sets.
- qRT–PCR validation of selected genes. Plot represents the average percentage of target gene mRNA (normalized to GAPDH) in J34c versus JØ cells (all differences were found to be significant with a paired two‐tailed t‐test, P < 0.05; n = 5). Error bars are ± SEM.
Gene set enrichment analysis including all the DE genes identified 104 GO terms as being significantly enriched (Table EV3), with a large number of these being related to signaling or immune system functions (14 and 10%, respectively), including the TCR signaling pathway (Fig 6A). Additionally, the GeneMania database was used to identify known gene and protein–protein interactions involving the DE genes and perform a gene set enrichment analysis on the resulting gene interaction network (Fig 6B). A total of 79 out of the 82 DE genes were found to be connected in a single interaction network, whose significant biological functions were strongly related to T‐cell signaling and activation (Table EV4). Interestingly, the results of these functional enrichment analyses were similar when using either all DE genes or just those that were up‐regulated. In contrast, the down‐regulated gene subset, which is expected to encompass miR‐34c‐5p mRNA targets, did not have any clear functional associations. Therefore, the observed changes in the T‐cell transcriptome linked to T‐cell activation are likely to be downstream of direct miR‐34c‐5p mRNA targets. Of note, the comparison of our dataset with a previously published microarray time‐course study of the Jurkat transcriptome in response to TCR stimulation (Riley et al, 2002) identified an additional group of 11 genes altered by miR‐34c‐5p that were not linked to T‐cell activation by the GO term annotation (Table EV5). This corresponds to a significant degree of overlap between the two datasets, reinforcing the putative role of mir‐34c‐5p in this process.
Figure 6. Functional enrichment and network analysis of the miR‐34c‐5p‐dependent transcriptome in Jurkat T cells.

- Distribution of enriched GO terms (Biological Processes) in J34c DE genes grouped into nine functional categories. Bar chart represents the number of expected and observed hits for GO terms associated with “Immune response”.
- Gene interaction network for J34c DE genes (filled nodes) and additional highly connected genes (transparent nodes). Node size reflects the number of network connections.
These results suggest that miR‐34c‐5p overexpression in Jurkat cells leads to an up‐regulation of genes critically involved in TCR signaling, thereby providing a possible explanation for the observed increased efficiency of HIV‐1 production.
miR‐34c‐5p regulates genes involved in HIV replication
To further investigate the interactions between miR‐34c‐5p and HIV‐1, we compared the DE genes with the HIV‐1 Human Interaction Database (Ako‐Adjei et al, 2015). We found that 30 of the 82 DE genes have been reported to either interact with HIV‐1 proteins, regulate replication efficiency, or be modulated by HIV‐1 infection (Fig 7A and Table EV6). This overlap between J34c DE genes and known HIV interacting genes was found to be significant using a hypergeometric distribution test (Table EV6). Thus, in addition to its interaction with T‐cell activation, miR‐34c‐5p appears to regulate several critical pathways for viral replication. Manual annotation of these genes reveals that most of them are membrane proteins (primarily of the cellular membrane but also ER‐ and Golgi‐associated), interacting with envelope and other structural proteins, or proteins involved in viral encapsidation (Fig 7A). Six of these genes are cytoplasmic proteins involved in signal transduction and three are transcriptional regulators (Fig 7A). Of these 30 genes, six are directly annotated in the database as enhancers of viral replication while two are inhibitors (Table EV6). Strikingly, in spite of the observed positive impact of miR‐34c‐5p on HIV‐1 replication, most of the reported enhancers were found to be negatively regulated by miR overexpression in Jurkat cells (Fig 7A and Table EV6). Additionally, the transcriptional co‐activator KAT2B (also known as PCAF), which is required for efficient Tat‐dependent transcription from the viral LTR (D'Orso & Frankel, 2009), was also among the miR‐34c‐5p down‐regulated genes (Fig 5A and B). This result was confirmed by protein quantification, while 3′UTR reporter assays revealed KAT2B/PCAF as a direct target of the miR (Fig 7B). Moreover, KAT2B/PCAF mRNA levels increased in J34c cells treated with the antagomir against miR‐34c‐5p (Fig 7B). To confirm that KAT2B/PCAF is a direct target of miR‐34c, we performed luciferase assays in HEK 293 cells using a reported vector with a 200 bp region of the 3′UTR that is predicted to contain two miR binding sites, co‐transfected with the pre‐mR‐34c‐5p pcDNA3 vector (Fig 7C). Results suggest that miR‐34c‐5p is able to down‐regulate KAT2B/PCAF expression levels by binding to the mRNA 3′UTR. Of note, quantification of KAT2B mRNA in naive CD4 T cells during activation and HIV‐1 infection revealed a strong negative correlation with miR‐34c‐5p levels, supporting that this interaction also occurs in primary cells (Fig EV5).
Figure 7. miR‐34c‐5p targets in the HIV interactome.

- Interaction network between genes regulated by miR‐34c‐5p and HIV‐1 proteins. Figure depicts the subset of DE genes identified in J34c cells that have reported interactions with HIV‐1 proteins in the HIV interactome database (Ako‐Adjei et al, 2015), as well as their subcellular localization and function (see also Table EV6).
- Western blot of PCAF/KAT2B and histone H3 in JØ or J34c (top), confirming decrease in protein levels. Bottom: AntagomiR to miR‐34c‐5p results in increased KAT2B mRNA levels compared to control‐treated cells. Plot presents relative expression values for mRNA in three biological replicates; bars represent mean and SEM. Differences were found to be significant with P < 0.05 (paired two‐tailed t‐test).
- Predicted target sites for miR‐34c‐5p in the PCAF/KAT2B mRNA (black bars) and miR‐target hybridization for the two strongest sites (top); Luciferase assay with the pEZX Renilla/firefly‐PCAF/KAT2B 3′UTR reporter in HEK293 cells co‐transfected with either the miR‐34c‐5p overexpression vector or pcDNA3 empty control (bottom). Differences were found to be significant with P < 0.05 (paired two‐tailed t‐test, n = 5). Error bars are ± SEM.
Source data are available online for this figure.
Figure EV5. miR‐34c‐5p and PCAF/KAT2B expression in naive CD4 T cells.

- Quantification of PCAF/KAT2B and miR‐34c‐5p expression levels in naive CD4 T cells isolated from two healthy donors by qRT–PCR in response to TCR stimulation.
- Same as in (A), except in HIV‐1‐infected versus non‐infected stimulated cells after 72 h TCR stimulation.
The targeting of KAT2B by miR‐34c‐5p would be predicted to result in reduced viral replication. However, our experiments clearly show that the functional outcome of the changes induced by the overexpression of this miR in Jurkat T cells is enhanced viral replication (Fig 4). Thus, we conclude that the combined impact of miR‐34c‐5p expression on multiple genes and pathways generates a cellular environment favoring HIV production, and we hypothesize that the down‐regulation of miR‐34c‐5p levels in HIV‐infected primary cells may be part of a host response to restrict viral replication.
Overall, our results clearly show that miR‐34c‐5p is a novel regulator of naive T‐cell activation that can impact on HIV infection by targeting multiple genes linked to TCR signaling and host–virus interaction pathways.
Discussion
miRs allow for the fine‐tuning of cell responses to the environment and are key mediators of cell differentiation pathways (Ivey & Srivastava, 2010). These processes lie at the core of immune function and are particularly important in CD4 T cells, the “orchestrators” of immune responses (Pagani et al, 2013). CD4 T cells represent the main target of HIV, which co‐opts the process of cell activation and differentiation for several steps of its life cycle, and critically depends on them for productive infection (Stevenson et al, 1990). To help identify miRs that potentially link T‐cell activation and HIV replication, we profiled miR expression in purified naive CD4 T cells and then asked how it is modulated by both events using high‐depth small RNA‐seq. Using this approach, we provide here the first comprehensive overview of the miR landscape of highly purified human naive CD4 T cells. We show that although HIV is able to efficiently infect this quiescent population, it does not significantly impact upon miR expression. TCR‐mediated stimulation resulted, as expected, in significant alterations of the miR profile, enabling us to identify miR‐34c‐5p as a novel player in T‐cell activation. Furthermore, we found a consistent down‐regulation of miR34c‐5p upon HIV infection of TCR‐stimulated naive CD4 T cells, revealing miR‐34c‐5p as a link between these two processes.
miR‐34c‐5p is a member of the miR‐34 family, which in humans is composed of three miRs sharing the same seed sequence: miR‐34a, miR‐34b, and miR‐34c (Rokavec et al, 2014). The miR‐34 family was originally described as a critical regulator of the DNA damage response, being both transcriptionally regulated by p53 and in turn regulating several p53‐target genes (He et al, 2007). In fact, epigenetic silencing and chromosomal deletions of the miR‐34 loci have been reported in several tumors (Toyota et al, 2008; Chim et al, 2011), leading to the proposal that they act as tumor suppressor genes. Additionally, miR‐34c‐5p has been shown to be important in brain development and function, as well as stem‐cell pluripotency regulation, ciliogenesis, and cell movement and migration, processes that are of particular relevance in the immune system (reviewed by Rokavec et al, 2014).
A role for the miR‐34 family in TCR‐mediated cell activation has not been previously reported. This likely reflects the paucity of studies focusing on purified human naive CD4 T cells, many of which relied on low‐depth qPCR or microarray‐based approaches (Pagani et al, 2013). Additionally, most NGS studies use so‐called resting CD4 T cells to investigate T‐cell activation. This may yield reduced sensitivity in revealing miR variations as this population includes differentiated T helper subsets, known to feature specific miR profiles (Kroesen et al, 2015). Supporting this hypothesis, a qPCR‐based miR profiling study of IFNγ‐stimulated human cells identified miR‐34c‐5p up‐regulation in human cord blood T cells, which are known to be mainly composed of naive cells, but not in adult circulating CD4 T cells (Takahashi et al, 2012).
Maintenance of the naive status and the regulation of the threshold for TCR activation have been partially ascribed to miRs, suggesting they act as important regulators of human naive CD4 T‐cell homeostasis (reviewed by Baumjohann & Ansel, 2013). We found that TCR stimulation of purified naive CD4 T cells altered the abundance of approximately half of the detected miRs, though only the changes in miR‐155‐5p and miR‐34c‐5p levels were robust enough to reach statistical significance. Of note, miR‐34c‐5p was not detected in non‐stimulated naive CD4 T cells and was the only member of the miR‐34 family expressed upon TCR stimulation. These indicate a very specific transcriptional and processing control leading to the synthesis of this miR in naive CD4 T cells.
Our longitudinal study revealed differences in the kinetics of induction of miR‐34c‐5p and miR‐155. The latter is known to be up‐regulated soon after stimulation (Haasch et al, 2002). Conversely, the increase in both mature and precursor miR‐34c‐5p was only clearly detected 72 h post‐TCR stimulation, declining as cell proliferation reached plateau. These results suggest that miR‐34c‐5p is likely involved in late stages of the TCR stimulation program, potentially linked with a particular gain of function and/or the differentiation of a cell subset. Interestingly, both the FOXO3 transcription factor and the p38 MAPK signaling pathway have been shown to specifically regulate transcription of the miR‐34b/c cluster (Cannell et al, 2010; Kress et al, 2011) and are known to play important roles in T‐cell differentiation (Ashwell, 2006; Hedrick et al, 2012).
The standard approach to address miR function in a human cell type is to perform overexpression and down‐regulation studies involving the transfection of miR mimics or antagonists. However, we found that transfection efficiency of ex vivo purified naive CD4 T cells is very low and that they were subject to a high degree of cell death when this process is performed after TCR stimulation. Therefore, we evaluated the impact of miR‐34c‐5p on T‐cell function by stably transfecting the Jurkat cell line. miR‐34c‐5p‐overexpressing cells displayed only minor proliferative impairment, contrasting with previous reports that used transient transfection (He et al, 2007; Toyota et al, 2008), which is likely related to the clone selection procedure. Transcriptome analysis identified a small number of genes whose levels of expression were significantly altered in J34c cells. These genes were found to be strongly associated with functions previously reported for miR‐34c‐5p (Rokavec et al, 2014) and additionally to immune processes. Furthermore, known interactions of miR‐34c‐5p targets displayed a very strong connection to the TCR signaling pathway. Strikingly, this connection was primarily established through up‐regulated, rather than down‐regulated genes, which are more likely to represent direct miR targets. Additionally, a significant overlap was found between miR‐34c‐5p regulated genes and early TCR response genes in Jurkat cells (Riley et al, 2002). Hence, the available evidence strongly suggests that miR‐34c‐5p acts as a regulator of T‐cell activation, interacting with several pathways that contribute to the fine‐tuning of T‐cell responses.
Of note, miR‐34c‐5p levels were consistently reduced upon both HIV‐1 and HIV‐2 infections of TCR‐stimulated cells. This down‐regulation was particularly notable considering that the miR expression profile of TCR‐activated naive CD4 T cells was relatively stable 24 h post‐HIV infection, a time‐point selected in order to avoid confounding effects resulting from significant levels of cell death. Our findings are in agreement with a recent report that identified only modest changes in cellular miRs early after infection (Whisnant et al, 2013).
Additionally, we found that HIV also does not significantly impact miR expression in quiescent naive CD4 T cells, despite the evidence of infection and generation of significant levels of proviral DNA. Recent data point to the ability of HIV to infect and establish latency in resting CD4 T cells (Chavez et al, 2015; Zerbato et al, 2016). This has important implications for the development of complementary therapeutic strategies to control the viral reservoirs that persist under antiretroviral therapy. The lack of significant virus production in infected quiescent CD4 T cells has been in part ascribed to the presence of host restriction factors, which are down‐regulated upon cell activation. We show that, similar to HIV‐1, HIV‐2 does not induce alterations in the miR profile of naive CD4 T cells. Unlike HIV‐1, HIV‐2 encodes Vpx that promotes the degradation of SAMHD1, an important HIV restriction factor in quiescent cells (Baldauf et al, 2012). Previous studies have shown that quiescent naive CD4 T cells transfected with a plasmid encoding Vpx support productive HIV‐1 infection through the Vpx‐mediated reduction of SAMHD1 (Baldauf et al, 2012). These first data regarding HIV‐2 infection of naive CD4 T cells provide evidence that Vpx‐mediated processes in quiescent cells do not lead to a distinct profile of viral parameters as compared to HIV‐1, nor in a perturbation of their miR profile. Furthermore, results suggest that presence of Vpx is not sufficient to overcome the restriction for productive HIV‐2 infection of naïve cells, in agreement with a previous report using quiescent CD4 T cells, irrespective of the naïve/memory phenotype (Chauveau et al, 2015). These findings are in agreement with the relatively more benign clinical course of HIV‐2 as compared to HIV‐1, despite both viruses being able to induce immune hyperactivation (Grossman et al, 2002; Sousa et al, 2002).
There are many studies addressing the impact of cellular miRs on HIV replication and on the establishment of latency (reviewed by Barichievy et al, 2015). Specifically, miR‐155‐5p, miR‐146a‐5p, miR‐21‐5p, and the miR‐17~92 cluster, which are highly expressed and play a role in CD4 T‐cell activation and differentiation (reviewed by (Kroesen et al, 2015)), have been shown to target several pathways of the HIV life cycle (Barichievy et al, 2015). Although our main question was whether HIV infection impacts on the miR profile of CD4 T cells and its connection to T‐cell activation, we further explored the direct impact of the miR‐34c‐5p on viral replication. For this purpose, we infected our stably transfected Jurkat T‐cell lines and found that miR‐34c‐5p expression resulted in increased viral production. This observation was confirmed using an antagomiR to specifically knockdown miR‐34c‐5p, which further revealed opposing effects in pre‐integration processes and net viral production.
The complexity of the regulatory interactions between miR‐34c‐5p and the cellular pathways known to be relevant for HIV infection was also highlighted by the transcriptome analysis of miR‐overexpressing cells. Of note, in parallel with gene expression changes that concur with the observed increase in viral production, negative modulation of several well‐recognized cellular genes critical for efficient HIV replication was observed in these cells. In the case of PCAF/KAT2B, we show that this is a direct effect of miR binding to the 3′UTR, resulting in reduced protein levels in J34c cells, and observe a strong inverse correlation between miR and mRNA levels in primary CD4 T cells, both uninfected and HIV‐infected. Notwithstanding, it appears that the combined effect of the miR on multiple pathways relevant for T‐cell activation and HIV life cycle results in a positive balance in favor of viral replication. Interestingly, several studies have suggested that miR‐34a‐5p enhances HIV‐1 replication in several cell line models via the targeting of different pathways (Zhang et al, 2012; Farberov et al, 2015; Kapoor et al, 2015). Although our data show that miR‐34a‐5p is not expressed in primary CD4 T cells, these previous results support the ability of the miR‐34 seed sequence to modulate the cell environment in a way that promotes viral production. It is therefore tempting to speculate that the observed down‐regulation of miR‐34c‐5p upon HIV‐1 or HIV‐2 infection is part of a host response against the virus.
Overall, we identified miR‐34c‐5p as a novel miR strongly induced by TCR stimulation of naive CD4 T cells and found that it was consistently down‐regulated in response to viral infection. Finally, we demonstrate that miR‐34c‐5p alters the expression of several genes involved in TCR signaling and cell activation and that its overexpression has a positive effect on HIV‐1 replication, confirming its role as a novel regulator of naive CD4 T‐cell activation potentially targeted by HIV.
Materials and Methods
Human samples, cell isolation and TCR stimulation
This study was approved by the Ethical Board of the Faculty of Medicine of the University of Lisbon, and all subjects provided written consent. Peripheral blood mononuclear cells (PBMC) were isolated from buffy coats of healthy individuals by Ficoll‐Paque PLUS (GE Healthcare) density gradient centrifugation, followed by isolation of naive CD4 T cells by negative selection using the EasySep™ Human Naive CD4 T Cell Enrichment kit (Stem Cell Technologies). Purity was always > 97% (%CD45RA+CD45ROnegCD4+CD3+ cells by flow cytometry). Naive cells were cultured in RPMI 1640 supplemented with 10% FBS, 2 mM l‐glutamine, 100 U/ml penicillin/100 μg/ml streptomycin, and 0.05 mg/ml Gentamicin (all from Invitrogen). For TCR stimulation, 2.5 × 10⁶ cells/ml were cultured for 72 h with plate‐bound anti‐CD3 mAb (1 μg/ml, clone OKT3, eBioscience), soluble anti‐CD28 mAb (1 μg/ml, clone 28.2, BDPharmingen), and IL‐2 (10 IU/ml, Dr. Maurice Gately, Hoffmann–La Roche Inc, NIH AIDS Reagent Program). Cells were subsequently switched to medium with IL‐2 for prolonged time‐course assays.
Virus production and HIV infections
293T cells were transfected with pRod (NIBSC—Centre for AIDS Reagents, Medical Research Council UK) or pNL4‐3 (NIH AIDS Reagent Program) for 24 h using fuGENE HD Transfection Reagent (Roche). The amount of virus in cell‐free culture supernatants was quantified in terms mass of active reverse transcriptase (ng RT) using the Cavidi Lenti RT Activity kit (Cavidi Tech AB), a non‐radioactive ELISA method that measures RT‐dependent DNA synthesis in the extract normalized to a standard curve of recombinant HIV‐1 RT protein. This test was shown to have similar efficacy for both viruses (Soares et al, 2011a; Nunes‐Cabaço et al, 2015). Viral stocks were concentrated by ultracentrifugation (30 min/50,000 g/4°C; Beckmann L8‐60M) before resuspension in culture medium supplemented with polybrene (3 μg/ml; Sigma) and used to infect unstimulated and TCR‐stimulated primary cells or stably transfected cell lines, at a dose of 0.853 ng RT/106 cells, during 3 h culture under standard conditions (37°C/5% CO2). Primary cells were then extensively washed to remove residual virus, resuspended in medium with IL‐2 (10 IU/ml) and polybrene (3 μg/ml), and cultured for additional 24 h, after which cells and supernatants were collected and immediately stored at −80°C. HIV‐1NL43‐infected cell lines were maintained in culture medium with polybrene (3 μg/ml) and Geneticin® (G418 sulfate 1 mg/ml; Invitrogen), and culture supernatants and cell pellets were harvested at 24 and 48 h. Infection was assessed by quantifying cell‐associated viral DNA and gag mRNA levels using previously validated methodologies for use with clinical samples from HIV‐infected individuals (Soares et al, 2011a,b; Nunes‐Cabaço et al, 2015), and HIV‐1 tat mRNA was quantified by RT–qPCR as described below, and RT activity in supernatants using SYBR green product‐enhanced RT (SG‐PERT), as previously described (Nunes‐Cabaço et al, 2015), with the adequate controls (see Fig EV1).
Flow cytometry
Naive CD4 T‐cell response to TCR stimulation was assessed by flow cytometry through surface and intracellular staining performed, as previously described (Tendeiro et al, 2012), using the following mAbs: PE‐conjugated CD71 (OKT9, eBioscience), PerCP‐conjugated Ki67 (B56, BD Biosciences), APC‐conjugated CD25 (2A5, BD Biosciences). Viral production at the single‐cell level was assessed by flow cytometry by quantifying intracellular HIV using an anti‐Gag Ab (KC57, Beckman Coulter), as previously described (Nunes‐Cabaço et al, 2015).
Cloning and generation of stably transfected cell lines
The pre‐miR‐34c sequence was PCR‐amplified from HEK293 genomic DNA using primers with BamHI and XhoI restriction sites and cloned into the pcDNA3.1 vector (Invitrogen). The PCAF 3′UTR sequence was amplified from human cDNA and cloned into the PvuI and SpeI sites of the pEZX dual reporter vector, downstream of the firefly luciferase sequence. Plasmids were sequenced to confirm the absence of mutations. The Jurkat E6‐1 cell line (ATCC TIB‐152) was used to produce stably transfected T cells overexpressing miR‐34c‐5p (J34c) by electroporation using the Neon Transfection System 100 μl Kit in a Microporator MP‐100 instrument (Invitrogen). Control Jurkat cells (J∅) were generated by parallel transfection of Jurkat cells with the empty pcDNA3.1 vector. Prior to transfection, both the pre‐miR‐34c plasmid and pcDNA3.1 vector were linearized with the restriction enzyme PvuI (Fermentas). Transfected cells were cultured for 7 days in RPMI 1600 with 10% FBS and Geneticin® (G418 sulfate 1 mg/ml; Invitrogen). Antibiotic‐resistant cells were frozen to generate the J34c and J∅ parental pools. Single clones were isolated from the parental pools using clonaCell‐TCS (Stemcell Technologies). Primer sequences are provided in the Appendix.
RNA, DNA and protein extraction
Total RNA was isolated using mirVana miRNA Isolation kit for naive CD4 T cells or TRIzol reagent for Jurkat cells (both from Ambion—Thermo Fisher Scientific). RNA quantification was performed on ND‐1000 spectrophotometer (NanoDrop Technologies) and RNA integrity validated using RNA 6000 Nano LabChip kits on a 2100 Bioanalyzer instrument (Agilent Technologies). Total RNA samples from multiple individuals were pooled for the generation of sequencing libraries (see below) and requantified using Qubit (Life Technologies). DNA was isolated using the QIAamp DNA Mini Kit (Qiagen). For Western blotting, proteins were extracted from the organic fractions from the TRIzol procedure.
AntagomiR assays
miRNA knockdown assays were performed according to Haftmann et al (2015), using the reported control antagomiR‐Scr, and design strategy for a miR‐34c‐5p‐specific antagomiR, custom synthesized by Dharmacon with the following sequence and modifications: 5′mG(*)mC(*)mAmAmUmCmAmGmCmUmAmAmCmUmAmCmAmCmUmG(*)mC(*)mC(*)mU(*)(3′‐Chl)3′ (where mN, 2′‐O‐methyl nucleotide; (*), phosphorothioate modification of the backbone; (3′‐Chl), 3′ cholesterol addition).
Jurkat cells were 24 h cultured (37°C/5% CO2), in 5 ml RPMI 1640 with 10% FBS and Geneticin® (G418 sulfate 1 mg/ml; Invitrogen). miR‐34c‐5p knockdown was optimized by varying concentrations and incubation time for the antagomiR and testing for the optimal time‐point for maximum knockdown and persistence of the effect by semi‐quantitative RT–PCR quantification as described below. In the optimized protocol, 5 × 10⁵ cells were washed with cold PBS (300 g/8 min), resuspended in 250 μl serum‐free medium (ACCELL, Dharmacon) supplemented with 1 mM of antagomiR‐34c‐5p or control antagomiR‐Scr, and incubated in a 24‐well plate for 4 h (37°C/5% CO2), followed by addition of 375 μl medium to each well, and further 24 h incubation. AntagomiR‐treated cells were used in infection experiments as described above.
RT–PCR
miR RT–qPCR assays were performed using TaqMan MicroRNA Reverse Transcription Kit and TaqMan microRNA Assays (Applied Biosystems). For semi‐quantitative analysis of miR‐34c‐5p, 200 ng of total RNA was poly‐A‐tailed using the poly‐A polymerase in a 10 μl reaction (New England Biolabs). NZY M‐MuLV Reverse Transcriptase (NZYTech) was used for cDNA synthesis from poly‐adenylated total RNA for miR amplification using an oligo‐dT adaptor primer (see Appendix) or from cellular total RNA using standard oligo‐dT (for human mRNAs) or random hexamer priming (for tat‐rev mRNA). The NZYTaq DNA polymerase (NZYTech) was used for semi‐quantitative analysis of miR‐34c‐5p or pre‐miR‐34c levels. qPCR quantification of cDNA samples was performed using the SsoFast EvaGreen Supermix (Bio‐Rad) in a Bio‐Rad CFX96 Real‐Time PCR Detection system. Relative expression was calculated by the ΔCt method against housekeeping genes HPRT1 or GAPDH for mRNA and RNU48 or hsa‐miR‐21 for miRNAs. Detection sensitivity limit of miR‐34c‐5p by qPCR was calculated using a synthetic RNA oligonucleotide identical to miR‐34c‐5p (IBA GmBH), reverse‐transcribed with the TaqMan miR‐34c‐5p reverse transcription kit (Applied Biosystems), and using ten fivefold serial dilutions of the resulting cDNA, ranging from 2 × 10⁻⁵ μM to 1 × 10⁻¹¹ μM of input RNA equivalents. Resulting Ct data were plotted in GraphPad Prism, and a fit to an exponential growth curve was generated and used to interpolate unknown values. Primer sequences are presented in the Appendix.
Reporter assays and Western blotting
To analyze the interaction of miR‐34c‐5p with KAT2B 3′UTR, HEK293 cells were transfected with a 1:1 mix of miR‐34c‐5p pcDNA construct and either pZEX‐KAT2B 3′UTR or pZEX empty vector, in triplicate using Fugene 6 (Promega). After 24 h, firefly and Renilla luciferase levels were determined using Promega Dual‐glo luciferase assay on Promega Glomax plate reader. The mean values of the luciferase to Renilla firefly ratio of four independent assays were compared using two‐tailed t‐test. Western blotting was performed with the Anti‐KAT2B/PCAF ChIP Grade (ab12188) and the Anti‐Histone H3 Ab—Nuclear Loading Control and ChIP Grade (Ab1791) from Abcam.
Small RNA‐seq design and sequencing
About 15–30 nt RNA fragments were purified by gel fractionation and used to generate small RNA‐seq libraries using the Illumina small RNA‐seq protocol. The small RNA‐seq libraries used in this study were generated in three distinct experiments (Table EV7). Dataset 1 is composed by one library per condition (unstimulated and stimulated), each generated by pooling equal amounts of total RNA from nine individual samples, and sequenced on a whole flow cell of a Genome Analyser II sequencer using the Chrysalis 36 cycles v4.0 sequencing kit (Illumina). Sequencing libraries for datasets 2 and 3 were generated from the pooling of equal amounts of total RNA from naive uninfected, HIV‐1‐infected, and HIV‐2‐infected cells isolated from three individuals. Dataset 2 is composed by two sets of replicate libraries from unstimulated cells (corresponding to a total of six donors), while dataset 3 is composed by three replicate libraries from stimulated cells (corresponding to a total of nine donor samples), which were sequenced on 20% of a HiSeq2000 sequencer lane using the TruSeq SBS v5 sequencing kit (Illumina). The same 3′ sequencing adaptor (ATCTCGTATGCCGTCTTCTGCTTGT) was used in all experiments and was removed from raw data before analysis. Raw sequencing data from dataset 1 was preprocessed using the SCS.2.6 and CASAVA.1.6 pipeline (Illumina). Raw reads from datasets 2 and 3 were preprocessed using the HiSeq Control Soft. V 1.3.8, RTA 1.10.36, CASAVA 1.7.0, and OLB‐1.9.0 (Illumina). The ArrayExpress accession code for the small RNA‐seq datasets is E‐MTAB‐4214. RNA‐seq datasets used for miR expression profiling are presented in Table EV7.
Small RNA‐seq data analysis
Quality control and filtering were performed using in‐house‐developed PERL scripts (Code EV1) with removal of reads with homopolymers, uncalled bases or san average Phred QS < 20. Quality approved reads were searched against known miRNAs (miRbase v16; Griffiths‐Jones et al, 2006), using in‐house‐developed PERL scripts to obtain expression sequence counts for mature miR species (Code EV2). Remaining sequence tags were aligned to human reference genome (NCBI build 37) using Bowtie 0.12.7 (Langmead, 2010), allowing one mismatch. Sequences were classified regarding locus of origin by positional comparison with coding regions (NCBI build 37) and other non‐coding RNAs (RFam database; Griffiths‐Jones et al, 2005), using the intersectBed function of BEDtools (Quinlan & Hall, 2010). Reads without annotation were analyzed for putative novel miRNAs using MapMi (Guerra‐Assunção & Enright, 2010), self‐containment of RNA structures (Lee & Kim, 2008), and miRDeep2 (Friedländer et al, 2012). Library normalization was performed using the mean normalization method available in Deseq package of Bioconductor (Anders & Huber, 2010). Differential expression analysis was performed with DESeq, which applies a Fisher's exact test after performing a transformation using the negative binomial (NB) model to account for overdispersion. Clustering analysis was performed using the heatmap function from ggplot package (default parameters) in R (R Core Team, 2014). For prediction of target genes of differentially expressed miRNAs, PITA (Kertesz et al, 2007), MiRanda (Griffiths‐Jones et al, 2006), and TargetScan 5.2 (Lewis et al, 2003) were used. For downstream analysis, only targets predicted by at least two algorithms were selected.
Microarray profiling and network analysis
The transcriptome of J34c and JØ clones was profiled using the Affymetrix Human Gene ST array v2.0 at the EMBL Core Facility. Datasets are publicly available in ArrayExpress under the accession number E‐MTAB‐4190. Microarray data analysis was performed using RMA (Irizarry et al, 2003) and Bioconductor packages Aroma (Bengtsson & Hössjer, 2006) and Limma (Smyth, 2004). DE genes were evaluated using a linear model approach implemented in Limma. P‐values were adjusted for multiple testing, across all genes and all comparisons, Benjamini and Hochberg corrections to control the expected false discovery rate at less than 5%. Gene set enrichment analysis was performed using GOStats (Falcon & Gentleman, 2007). GeneMania plugin (Montojo et al, 2010) of Cytoscape (Shannon et al, 2003) was used to generate an interaction network for DE genes and predict underlying network functions based on the statistical analysis of GO term frequencies. The network was manually annotated to highlight genes linked to T‐cell signaling, HIV interactome, Jurkat activation, and up‐ or down‐regulation status.
Statistical analysis
The statistical tests used are mentioned in the corresponding figure legends and were implemented using GraphPad Prism software or, alternatively, in R Statistical environment (R Core Team, 2014) when specifically mentioned.
Author contributions
AJA, JA, RBF, PM, RSS, JG, MG‐C, and AES contributed to the conception and design of the study; AJA, JA, RBF, PM, AMM, RSS, CR, CGR, RT, AS‐C, JAG‐A, and MS‐M performed research; MGC and AES supervised the study; AJA, RBF, PM, MGC, and AES wrote the paper.
Conflict of interest
The authors declare that they have no conflict of interest.
Supporting information
Appendix
Expanded View Figures PDF
Table EV1
Table EV2
Table EV3
Table EV4
Table EV5
Table EV6
Table EV7
Code EV1
Code EV2
Source Data for Expanded View
Review Process File
Source Data for Figure 7
Acknowledgements
The authors thank Ana Isabel Pinheiro Ana Antão and Henrique Machado for experimental help, Margarida Telhada and Sérgio Almeida for fruitful discussions, and the Instituto Português de Sangue e Transplantação (IPST) for providing the buffy coats. This project was funded by a Merck International research grant IISP#39114 and IISP#35271. AJA was supported by an EMBO long‐term fellowship reference ALT‐33‐2010 and a Marie Curie European Integration Grant reference PERG‐GA‐2009‐256595. This project was supported by national funds through FCT—Fundação para a Ciência e a Tecnologia fellowships awarded to AJA, CGR, JA, PM, RBF, RSS, and RT. Work in MGC's laboratory is supported by an FCT/MCTES/PIDDAC research center grant to BioISI, reference UID/MULTI/04046/2013.
The EMBO Journal (2017) 36: 346–360
Contributor Information
Margarida Gama‐Carvalho, Email: mhcarvalho@ciencias.ulisboa.pt.
Ana E Sousa, Email: asousa@medicina.ulisboa.pt.
References
- Ako‐Adjei D, Fu W, Wallin C, Katz KS, Song G, Darji D, Brister JR, Ptak RG, Pruitt KD (2015) HIV‐1, human interaction database: current status and new features. Nucleic Acids Res 43: D566–D570 [DOI] [PMC free article] [PubMed] [Google Scholar]
- Anders S, Huber W (2010) Differential expression analysis for sequence count data. Genome Biol 11: R106 [DOI] [PMC free article] [PubMed] [Google Scholar]
- Ashwell JD (2006) The many paths to p38 mitogen‐activated protein kinase activation in the immune system. Nat Rev Immunol 6: 532–540 [DOI] [PubMed] [Google Scholar]
- Baldauf H‐M, Pan X, Erikson E, Schmidt S, Daddacha W, Burggraf M, Schenkova K, Ambiel I, Wabnitz G, Gramberg T, Panitz S, Flory E, Landau NR, Sertel S, Rutsch F, Lasitschka F, Kim B, König R, Fackler OT, Keppler OT (2012) SAMHD1 restricts HIV‐1 infection in resting CD4(+) T cells. Nat Med 18: 1682–1687 [DOI] [PMC free article] [PubMed] [Google Scholar]
- Banerjee A, Schambach F, DeJong CS, Hammond SM, Reiner SL (2010) Micro‐RNA‐155 inhibits IFN‐gamma signaling in CD4+ T cells. Eur J Immunol 40: 225–231 [DOI] [PMC free article] [PubMed] [Google Scholar]
- Barichievy S, Naidoo J, Mhlanga MM (2015) Non‐coding RNAs and HIV: viral manipulation of host dark matter to shape the cellular environment. Front Genet 6: 108 [DOI] [PMC free article] [PubMed] [Google Scholar]
- Bartel DP (2004) MicroRNAs: genomics, biogenesis, mechanism, and function. Cell 116: 281–297 [DOI] [PubMed] [Google Scholar]
- Baumjohann D, Ansel KM (2013) MicroRNA regulation of T helper cell differentiation and plasticity. Nat Rev Immunol 13: 666–678 [DOI] [PMC free article] [PubMed] [Google Scholar]
- Bengtsson H, Hössjer O (2006) Methodological study of affine transformations of gene expression data with proposed robust non‐parametric multi‐dimensional normalization method. BMC Bioinformatics 7: 100 [DOI] [PMC free article] [PubMed] [Google Scholar]
- Cannell IG, Kong YW, Johnston SJ, Chen ML, Collins HM, Dobbyn HC, Elia A, Kress TR, Dickens M, Clemens MJ, Heery DM, Gaestel M, Eilers M, Willis AE, Bushell M (2010) p38 MAPK/MK2‐mediated induction of miR‐34c following DNA damage prevents Myc‐dependent DNA replication. Proc Natl Acad Sci USA 107: 5375–5380 [DOI] [PMC free article] [PubMed] [Google Scholar]
- Chauveau L, Puigdomenech I, Ayinde D, Roesch F, Porrot F, Bruni D, Visseaux B, Descamps D, Schwartz O (2015) HIV‐2 infects resting CD4+ T cells but not monocyte‐derived dendritic cells. Retrovirology 12: 2 [DOI] [PMC free article] [PubMed] [Google Scholar]
- Chavez L, Calvanese V, Verdin E (2015) HIV latency is established directly and early in both resting and activated primary CD4 T cells. PLoS Pathog 11: e1004955 [DOI] [PMC free article] [PubMed] [Google Scholar]
- Chim CS, Wan TS, Wong KY, Fung TK, Drexler HG, Wong KF (2011) Methylation of miR‐34a, miR‐34b/c, miR‐124‐1 and miR‐203 in Ph‐negative myeloproliferative neoplasms. J Transl Med 9: 197 [DOI] [PMC free article] [PubMed] [Google Scholar]
- Cobb BS, Nesterova TB, Thompson E, Hertweck A, O'Connor E, Godwin J, Wilson CB, Brockdorff N, Fisher AG, Smale ST, Merkenschlager M (2005) T cell lineage choice and differentiation in the absence of the RNase III enzyme dicer. J Exp Med 201: 1367–1373 [DOI] [PMC free article] [PubMed] [Google Scholar]
- Doitsh G, Cavrois M, Lassen KG, Zepeda O, Yang Z, Santiago ML, Hebbeler AM, Greene WC (2010) Abortive HIV infection mediates CD4 T cell depletion and inflammation in human lymphoid tissue. Cell 143: 789–801 [DOI] [PMC free article] [PubMed] [Google Scholar]
- D'Orso I, Frankel AD (2009) Tat acetylation modulates assembly of a viral‐host RNA‐protein transcription complex. Proc Natl Acad Sci USA 106: 3101–3106 [DOI] [PMC free article] [PubMed] [Google Scholar]
- Falcon S, Gentleman R (2007) Using GOstats to test gene lists for GO term association. Bioinformatics 23: 257–258 [DOI] [PubMed] [Google Scholar]
- Farber DL, Yudanin NA, Restifo NP (2013) Human memory T cells: generation, compartmentalization and homeostasis. Nat Rev Immunol 14: 24–35 [DOI] [PMC free article] [PubMed] [Google Scholar]
- Farberov L, Herzig E, Modai S, Isakov O, Hizi A, Shomron N (2015) MicroRNA‐mediated regulation of p21 and TASK1 cellular restriction factors enhances HIV‐1 infection. J Cell Sci 128: 1607–1616 [DOI] [PMC free article] [PubMed] [Google Scholar]
- Flynt AS, Lai EC (2008) Biological principles of microRNA‐mediated regulation: shared themes amid diversity. Nature Rev Genet 9: 831–842 [DOI] [PMC free article] [PubMed] [Google Scholar]
- Friedländer MR, Mackowiak SD, Li N, Chen W, Rajewsky N (2012) miRDeep2 accurately identifies known and hundreds of novel microRNA genes in seven animal clades. Nucleic Acids Res 40: 37–52 [DOI] [PMC free article] [PubMed] [Google Scholar]
- Griffiths‐Jones S, Moxon S, Marshall M, Khanna A, Eddy SR, Bateman A (2005) Rfam: annotating non‐coding RNAs in complete genomes. Nucleic Acids Res 33: D121–D124 [DOI] [PMC free article] [PubMed] [Google Scholar]
- Griffiths‐Jones S, Grocock RJ, Van Dongen S, Bateman A, Enright AJ (2006) miRBase: microRNA sequences, targets and gene nomenclature. Nucleic Acids Res 34: D140–D144 [DOI] [PMC free article] [PubMed] [Google Scholar]
- Grossman Z, Meier‐Schellersheim M, Sousa AE, Victorino RMM, Paul WE (2002) CD4+ T‐cell depletion in HIV infection: are we closer to understanding the cause? Nat Med 8: 319–323 [DOI] [PubMed] [Google Scholar]
- Guerra‐Assunção JA, Enright AJ (2010) MapMi: automated mapping of microRNA loci. BMC Bioinformatics 11: 133 [DOI] [PMC free article] [PubMed] [Google Scholar]
- Haasch D, Chen Y‐W, Reilly RM, Chiou XG, Koterski S, Smith ML, Kroeger P, McWeeny K, Halbert DN, Mollison KW, Djuric SW, Trevillyan JM (2002) T cell activation induces a noncoding RNA transcript sensitive to inhibition by immunosuppressant drugs and encoded by the proto‐oncogene, BIC. Cell Immunol 217: 78–86 [DOI] [PubMed] [Google Scholar]
- Haftmann C, Riedel R, Porstner M, Wittmann J, Chang H‐D, Radbruch A, Mashreghi M‐F (2015) Direct uptake of Antagomirs and efficient knockdown of miRNA in primary B and T lymphocytes. J Immunol Methods 426: 128–133 [DOI] [PMC free article] [PubMed] [Google Scholar]
- He L, He X, Lim LP, de Stanchina E, Xuan Z, Liang Y, Xue W, Zender L, Magnus J, Ridzon D, Jackson AL, Linsley PS, Chen C, Lowe SW, Cleary MA, Hannon GJ (2007) A microRNA component of the p53 tumour suppressor network. Nature 447: 1130–1134 [DOI] [PMC free article] [PubMed] [Google Scholar]
- Hedrick SM, Hess Michelini R, Doedens AL, Goldrath AW, Stone EL (2012) FOXO transcription factors throughout T cell biology. Nat Rev Immunol 12: 649–661 [DOI] [PMC free article] [PubMed] [Google Scholar]
- Irizarry RA, Bolstad BM, Collin F, Cope LM, Hobbs B, Speed TP (2003) Summaries of Affymetrix GeneChip probe level data. Nucleic Acids Res 31: e15 [DOI] [PMC free article] [PubMed] [Google Scholar]
- Ivey KN, Srivastava D (2010) MicroRNAs as regulators of differentiation and cell fate decisions. Cell Stem Cell 7: 36–41 [DOI] [PubMed] [Google Scholar]
- Kapoor R, Arora S, Ponia SS, Kumar B, Maddika S, Banerjea AC (2015) The miRNA miR‐34a enhances HIV‐1 replication by targeting PNUTS/PPP1R10, which negatively regulates HIV‐1 transcriptional complex formation. Biochem J 470: 293–302 [DOI] [PubMed] [Google Scholar]
- Kertesz M, Iovino N, Unnerstall U, Gaul U, Segal E (2007) The role of site accessibility in microRNA target recognition. Nat Genet 39: 1278–1284 [DOI] [PubMed] [Google Scholar]
- Kluiver J, Poppema S, de Jong D, Blokzijl T, Harms G, Jacobs S, Kroesen B‐J, van den Berg A (2005) BIC and miR‐155 are highly expressed in Hodgkin, primary mediastinal and diffuse large B cell lymphomas. J Pathol 207: 243–249 [DOI] [PubMed] [Google Scholar]
- Kress TR, Cannell IG, Brenkman AB, Samans B, Gaestel M, Roepman P, Burgering BM, Bushell M, Rosenwald A, Eilers M (2011) The MK5/PRAK kinase and Myc form a negative feedback loop that is disrupted during colorectal tumorigenesis. Mol Cell 41: 445–457 [DOI] [PubMed] [Google Scholar]
- Kroesen B‐J, Teteloshvili N, Smigielska‐Czepiel K, Brouwer E, Boots AMH, van den Berg A, Kluiver J (2015) Immuno‐miRs: critical regulators of T‐cell development, function and ageing. Immunology 144: 1–10 [DOI] [PMC free article] [PubMed] [Google Scholar]
- Langmead B (2010) Aligning short sequencing reads with Bowtie. Curr Protoc Bioinformatics 32: 11.7.1–11.7.14 [DOI] [PMC free article] [PubMed] [Google Scholar]
- Lee MT, Kim J (2008) Self containment, a property of modular RNA structures, distinguishes microRNAs. PLoS Comput Biol 4: e1000150 [DOI] [PMC free article] [PubMed] [Google Scholar]
- Lewis BP, Shih I‐H, Jones‐Rhoades MW, Bartel DP, Burge CB (2003) Prediction of mammalian microRNA targets. Cell 115: 787–798 [DOI] [PubMed] [Google Scholar]
- Lu L‐F, Gasteiger G, Yu I‐S, Chaudhry A, Hsin J‐P, Lu Y, Bos PD, Lin L‐L, Zawislak CL, Cho S, Sun JC, Leslie CS, Lin S‐W, Rudensky AY (2015) A single miRNA‐mRNA interaction affects the immune response in a context‐ and cell‐type‐specific manner. Immunity 43: 52–64 [DOI] [PMC free article] [PubMed] [Google Scholar]
- Montojo J, Zuberi K, Rodriguez H, Kazi F, Wright G, Donaldson SL, Morris Q, Bader GD (2010) GeneMANIA cytoscape plugin: fast gene function predictions on the desktop. Bioinformatics 26: 2927–2928 [DOI] [PMC free article] [PubMed] [Google Scholar]
- Muljo SA, Ansel KM, Kanellopoulou C, Livingston DM, Rao A, Rajewsky K (2005) Aberrant T cell differentiation in the absence of dicer. J Exp Med 202: 261–269 [DOI] [PMC free article] [PubMed] [Google Scholar]
- Nunes‐Cabaço H, Matoso P, Foxall RB, Tendeiro R, Pires AR, Carvalho T, Pinheiro AI, Soares RS, Sousa AE (2015) Thymic HIV‐2 infection uncovers posttranscriptional control of viral replication in human thymocytes. J Virol 89: 2201–2208 [DOI] [PMC free article] [PubMed] [Google Scholar]
- Pagani M, Rossetti G, Panzeri I, de Candia P, Bonnal RJP, Rossi RL, Geginat J, Abrignani S (2013) Role of microRNAs and long‐non‐coding RNAs in CD4(+) T‐cell differentiation. Immunol Rev 253: 82–96 [DOI] [PubMed] [Google Scholar]
- Quinlan AR, Hall IM (2010) BEDTools: a flexible suite of utilities for comparing genomic features. Bioinformatics 26: 841–842 [DOI] [PMC free article] [PubMed] [Google Scholar]
- R Core Team (2014) R: a language and environment for statistical computing. Vienna, Austria: R Foundation for Statistical Computing; [Google Scholar]
- Rice AP, Kimata JT (2015) Subversion of cell cycle regulatory mechanisms by HIV. Cell Host Microbe 17: 736–740 [DOI] [PMC free article] [PubMed] [Google Scholar]
- Riley JL, Mao M, Kobayashi S, Biery M, Burchard J, Cavet G, Gregson BP, June CH, Linsley PS (2002) Modulation of TCR‐induced transcriptional profiles by ligation of CD28, ICOS, and CTLA‐4 receptors. Proc Natl Acad Sci USA 99: 11790–11795 [DOI] [PMC free article] [PubMed] [Google Scholar]
- Rodriguez A, Vigorito E, Clare S, Warren MV, Couttet P, Soond DR, Van Dongen S, Grocock RJ, Das PP, Miska EA, Vetrie D, Okkenhaug K, Enright AJ, Dougan G, Turner M, Bradley A (2007) Requirement of bic/microRNA‐155 for normal immune function. Science 316: 608–611 [DOI] [PMC free article] [PubMed] [Google Scholar]
- Rokavec M, Li H, Jiang L, Hermeking H (2014) The p53/miR‐34 axis in development and disease. J Mol Cell Biol 6: 214–230 [DOI] [PubMed] [Google Scholar]
- Rossi RL, Rossetti G, Wenandy L, Curti S, Ripamonti A, Bonnal RJP, Birolo RS, Moro M, Crosti MC, Gruarin P, Maglie S, Marabita F, Mascheroni D, Parente V, Comelli M, Trabucchi E, De Francesco R, Geginat J, Abrignani S, Pagani M (2011) Distinct microRNA signatures in human lymphocyte subsets and enforcement of the naive state in CD4+ T cells by the microRNA miR‐125b. Nat Immunol 12: 796–803 [DOI] [PubMed] [Google Scholar]
- Shannon P, Markiel A, Ozier O, Baliga NS, Wang JT, Ramage D, Amin N, Schwikowski B, Ideker T (2003) Cytoscape: a software environment for integrated models of biomolecular interaction networks. Genome Res 13: 2498–2504 [DOI] [PMC free article] [PubMed] [Google Scholar]
- Smyth GK (2004) Linear models and empirical bayes methods for assessing differential expression in microarray experiments. Stat Appl Genet Mol Biol 3: Article 3 [DOI] [PubMed] [Google Scholar]
- Soares RS, Matoso P, Calado M, Sousa AE (2011a) Strategies to quantify unspliced and multiply spliced mRNA expression in HIV‐2 infection. J Virol Methods 175: 38–45 [DOI] [PubMed] [Google Scholar]
- Soares RS, Tendeiro R, Foxall RB, Baptista AP, Cavaleiro R, Gomes P, Camacho R, Valadas E, Doroana M, Lucas M, Antunes F, Victorino RMM, Sousa AE (2011b) Cell‐associated viral burden provides evidence of ongoing viral replication in aviremic HIV‐2‐infected patients. J Virol 85: 2429–2438 [DOI] [PMC free article] [PubMed] [Google Scholar]
- Sousa AE, Carneiro J, Meier‐Schellersheim M, Grossman Z, Victorino RMM (2002) CD4 T cell depletion is linked directly to immune activation in the pathogenesis of HIV‐1 and HIV‐2 but only indirectly to the viral load. J Immunol 169: 3400–3406 [DOI] [PubMed] [Google Scholar]
- Stevenson M, Stanwick TL, Dempsey MP, Lamonica CA (1990) HIV‐1 replication is controlled at the level of T cell activation and proviral integration. EMBO J 9: 1551–1560 [DOI] [PMC free article] [PubMed] [Google Scholar]
- Surh CD, Sprent J (2008) Homeostasis of naive and memory T cells. Immunity 29: 848–862 [DOI] [PubMed] [Google Scholar]
- Takahashi N, Nakaoka T, Yamashita N (2012) Profiling of immune‐related microRNA expression in human cord blood and adult peripheral blood cells upon proinflammatory stimulation. Eur J Haematol 88: 31–38 [DOI] [PubMed] [Google Scholar]
- Tendeiro R, Foxall RB, Baptista AP, Pinto F, Soares RS, Cavaleiro R, Valadas E, Gomes P, Victorino RM, Sousa AE (2012) PD‐1 and its ligand PD‐L1 are progressively up‐regulated on CD4 and CD8 T‐cells in HIV‐2 infection irrespective of the presence of viremia. Aids 26: 1065–1071 [DOI] [PubMed] [Google Scholar]
- Thai T‐H, Calado DP, Casola S, Ansel KM, Xiao C, Xue Y, Murphy A, Frendewey D, Valenzuela D, Kutok JL, Schmidt‐Supprian M, Rajewsky N, Yancopoulos G, Rao A, Rajewsky K (2007) Regulation of the germinal center response by microRNA‐155. Science 316: 604–608 [DOI] [PubMed] [Google Scholar]
- Toyota M, Suzuki H, Sasaki Y, Maruyama R, Imai K, Shinomura Y, Tokino T (2008) Epigenetic silencing of microRNA‐34b/c and B‐cell translocation gene 4 is associated with CpG island methylation in colorectal cancer. Cancer Res 68: 4123–4132 [DOI] [PubMed] [Google Scholar]
- Whisnant AW, Bogerd HP, Flores O, Ho P, Powers JG, Sharova N, Stevenson M, Stevenson M, Chen C‐H, Cullen BR, Cullen BR (2013) In‐depth analysis of the interaction of HIV‐1 with cellular microRNA biogenesis and effector mechanisms. MBio 4: e000193 [DOI] [PMC free article] [PubMed] [Google Scholar]
- Yamane H, Paul WE (2013) Early signaling events that underlie fate decisions of naive CD4(+) T cells toward distinct T‐helper cell subsets. Immunol Rev 252: 12–23 [DOI] [PMC free article] [PubMed] [Google Scholar]
- Zerbato JM, Serrao E, Lenzi G, Kim B, Ambrose Z, Watkins SC, Engelman AN, Sluis‐Cremer N (2016) Establishment and reversal of HIV‐1 latency in naive and central memory CD4+ T cells in vitro . J Virol 90: 8059–8073 [DOI] [PMC free article] [PubMed] [Google Scholar]
- Zhang H‐S, Chen X‐Y, Wu T‐C, Sang W‐W, Ruan Z (2012) MiR‐34a is involved in Tat‐induced HIV‐1 long terminal repeat (LTR) transactivation through the SIRT1/NFκB pathway. FEBS Lett 586: 4203–4207 [DOI] [PubMed] [Google Scholar]
Associated Data
This section collects any data citations, data availability statements, or supplementary materials included in this article.
Supplementary Materials
Appendix
Expanded View Figures PDF
Table EV1
Table EV2
Table EV3
Table EV4
Table EV5
Table EV6
Table EV7
Code EV1
Code EV2
Source Data for Expanded View
Review Process File
Source Data for Figure 7