Abstract
Electron paramagnetic resonance (EPR) spectroscopy has long been a primary method for characterization of paramagnetic centers in materials and biological complexes. Transition metals in biological complexes have valence d-orbitals that largely define the chemistry of the metal centers. EPR spectra are distinctive for metal type, oxidation state, protein environment, substrates, and inhibitors. The study of many metal centers in proteins, enzymes, and biomimetic complexes has led to the development of a systematic methodology for quantitative interpretation of EPR spectra from a wide array of metal containing complexes. The methodology is now contained in the computer program SpinCount. SpinCount allows simulation of EPR spectra from any sample containing multiple species composed of one or two metals in any spin state. The simulations are quantitative, thus allowing determination of all species concentrations in a sample directly from spectra. This chapter will focus on applications to transition metals in biological systems using EPR spectra from multiple microwave frequencies and modes.
1. INTRODUCTION
Electron paramagnetic resonance (EPR) spectroscopy has long been a primary method for characterization of paramagnetic centers in materials and biological complexes (Eaton, Eaton, & Salikhov, 1998). This spectroscopy is only sensitive to paramagnetic centers, and since metal centers of biological complexes often have unpaired electrons, the spectroscopy provides a site-specific probe for the metal and its local environment. The common transition metals in biological complexes have valence d-orbitals that largely define the chemistry of the metal center. These d-orbitals have higher spin and significantly more unquenched angular momentum than p-orbitals resulting in much wider shifts of EPR spectral features in comparison to organic radicals. The spectra are distinctive for metal type, oxidation state, protein environment, substrates, and inhibitors. There are many books that cover the basic spin physics of magnetic resonance (Abragam & Bleaney, 1970; Carrington & McLachlan, 1967; Pake & Estle, 1973; Pilbrow, 1990; Weil, Bolton, & Wertz, 1994), and reviews addressing EPR spectroscopy of metalloproteins (Brudvig, 1995; Gaffney, 2009; Hagen, 2013; Palmer, 2000). This chapter will therefore take a more practical approach.
Over the years, the study of many metal centers in proteins, enzymes, and biomimetic complexes in our and other laboratories has led to the development of a systematic methodology for quantitative interpretation of EPR spectra from a wide array of metal centers. The methodology is now contained in the computer program SpinCount. SpinCount allows quantitative interpretation and simulation of EPR spectra from molecules containing transition metals. While there are many programs available that allow simulation of EPR spectra for a specific spin system, SpinCount allows simulation of EPR spectra from any complex containing multiple sites composed of one or two metals in any spin state, and the calculations are quantitative. SpinCount can determine species concentrations from integration or simulation of spectra. This latter method is powerful because: (1) it does not require a clean spectrum of a single species, (2) it is applicable to any spin system that cannot be addressed by simple integration, and (3) the spin standard can be any paramagnetic molecule with no relation to the unknown compound. SpinCount combines the ability to simulate EPR signals from general spin systems with the quantitative treatment of signal intensities. This review will focus on applications of this software for the interpretation of EPR spectra.
While the software enables interpretation of EPR spectra from a much wider array of metal complexes than previously available, it is not black box in its utilization. The general quantitative treatment of a wide array of spin systems requires options for many electronic and magnetic parameters. However, most applications will use a relatively small subset of these parameters. The examples in this chapter will attempt to illustrate a more basic understanding of principles. The parameters in SpinCount have a physical rather than phenomenological basis for inclusion, which minimizes the number of parameters required to achieve an adequate simulation of the experimental spectrum and thereby contributes more significance to the result. SpinCount has a graphical interface that allows manipulation of general spectra. All routine procedures involving manipulation of spectra are present in addition to many other tools that aid in spectral interpretation.
2. BASIC EPR THEORY
The EPR technique is based on the Zeeman effect, which is the interaction of an external magnetic field B with the magnetic moments μ of unpaired electrons. The electronic magnetic moment is due to the spin angular momentum S of the electron. The interaction of the external magnetic field and the magnetic moment of an electron is described by the Zeeman Hamiltonian (Abragam & Bleaney, 1970)
| (1) |
where g is the spectroscopic g-factor, β is the Bohr magneton (9.274 × 10 −24 J/T). The magnetic field B defines an axis of quantization (typically the z-axis) with Sz the projection of S onto B that allows the dot product to be expressed as
| (2) |
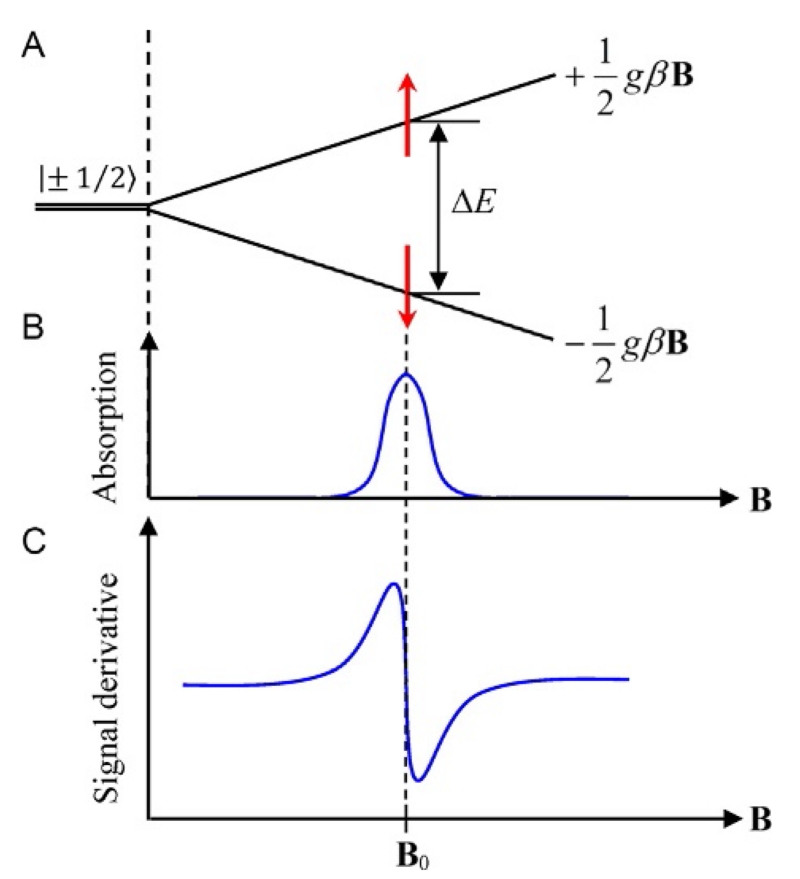
where ms is the spin magnetic quantum number which has the values ms = ±1/2. This leads to electronic energy states given by E = ±1/2gβB that produces a linear splitting of the degenerate ms spin energy levels as a function of magnetic field as shown in Fig. 1A. An electron on the lower energy level (spin down) can absorb microwave radiation and make a transition to the upper state (spin up) giving rise to an EPR signal.
Figure 1.
(A) Zeeman splitting of the degenerate electronic spin states for an S=1/2 system. (B) An electron can absorb energy to make a transition to the excited state resulting in an EPR absorption line. (C) Typical experimental EPR resonance line. The point where the line crosses the baseline determines the resonance magnetic field, B0, which allows the determination of the g-factor of the system.
The spin populations of the two states are given by the Boltzmann factor that yields a ratio of
| (3) |
with an excess of spins on the lower level. The quantitative interpretation of signal intensity requires signal measurements that do not saturate the signal to maintain this ratio in the spin populations. An electronic transition is possible only when the resonance condition is satisfied:
| (4) |
where h is Planck’s constant (6.626 × 10⁻³⁴ J s) and ν is the frequency of the electromagnetic radiation. The frequencies of the electromagnetic radiation are in the GHz region (microwave radiation) with magnetic fields between 0 and 1 T. In a typical EPR experiment, a microwave source produces radiation at a constant frequency, while the magnetic field is swept through the desired range. Microwave energy is absorbed when the magnetic field goes through a value that satisfies the resonance condition. This absorption is called an “EPR resonance line” and appears as a Gaussian or Lorentzian curve in the microwave power spectrum (Fig. 1B). EPR spectrometers employ modulation of the magnetic field with phase-sensitive detection to significantly increase the signal-to-noise ratio, which results in the first derivative of this line as shown in Fig. 1C. The area under the curve in Fig. 1B is proportional to the number of spins that contribute to the EPR signal. Integration of this line allows determination of the species concentration of EPR samples. The resonance condition can be written in a form that makes it easy to convert magnetic fields into g-values. With the frequency in GHz and the magnetic field in kG, the constants h and β can be combined into one numerical constant that allows the resonance condition to be expressed in the form:
| (5) |
3. g-FACTOR ANISOTROPY
From the EPR spectrum and the resonance condition, the g-value of the spin system can be determined. The g-value is derived from a tensor with nine components that reflects the anisotropy of the molecule or crystal. It is represented by a 3 × 3 matrix, but with a proper choice of coordinate axes (principal axes), this 3 × 3 matrix can be expressed in a form where only the diagonal components gx, gy, and gz are nonzero. The experimental EPR signal shown in Fig. 1C is an example of an isotropic spectrum. This occurs when the system experiences cubic symmetry where all directions in space are equivalent and the g-value is isotropic, i.e., gx=gy=gz=g. If the symmetry is axial, then one axis of the molecule is unique (typically the z-axis), while the other two orientations are equivalent producing two unique g-factors: gz=g∥ and gx=gy=g⊥. If the symmetry is rhombic, there are no equivalent axes and three different g-factors gx≠gy≠gz are obtained. In general, an EPR signal from an S=1/2 system (or a specific transition within an S>1/2 manifold) can show one of four different types of polycrystalline patterns (also referred to as a powder pattern) displayed in Fig. 2. Most commonly, a measurement is recorded on a solution, frozen solution, or powder sample. In such samples, all orientations of the molecule with respect to the magnetic field are possible. The polycrystalline pattern depends on the g-values and shows characteristic features at magnetic fields corresponding to the principal g-values as shown in Fig. 2. For metal complexes in low-symmetry environments, the orientation of the principal axis system of the g-tensor with respect to the spatial arrangement of atoms will not be known, but can be determined from measurement of single crystals.
Figure 2.
Typical EPR powder spectra for various molecular symmetries: (a) isotropic, (b) axial with gx=gy>gz, (c) axial with gx=gy<gz, and (d) rhombic.
4. HYPERFINE STRUCTURE
Many transition series ions have nuclei with a nonzero spin angular momentum (I) that gives rise to a nuclear magnetic moment which interacts with the magnetic moments of unpaired electrons. These electron–nuclear interactions produce a splitting in the EPR spectra and give rise to hyperfine structure. The hyperfine contribution to the spin Hamiltonian has the general form
| (6) |
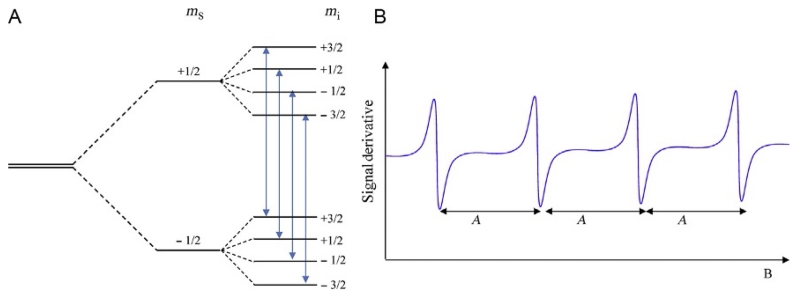
where A is the hyperfine tensor. There are three contributions to the tensor A: (i) an isotropic term due to finite unpaired electron density at the nucleus (Fermi contact interaction) and anisotropic terms due to (ii) the dipolar interaction between the electron and nuclear magnetic moments, and (iii) spin–orbit coupling (negligible for systems with quenched angular momentum, g≈2) (Palmer, 2000; Weil et al., 1994). In isotropic systems, the hyperfine tensor is replaced by the hyperfine constant A. This interaction of a spin I nucleus with a spin S electron results in the splitting of the ms electronic levels. The multiplicity of these levels is given by (2I+1) and each level is labeled by the quantum number mi (mi takes values from −I to +I in integer steps) as shown in Fig. 3A. Transitions are now allowed between the mi levels obeying the selection rules: Δms=±1 and Δmi=0. These transitions give rise to (2I+1) equally spaced EPR lines of equal intensity. The magnetic field separation of the hyperfine lines is given by the hyperfine constant A which is characteristic of the particular ion. Typical transition series ions with nuclear spin are Cu2+ (I=3/2), Mn2+ (I=5/2), and Co2+ (I=7/2).
Figure 3.
(A) Hyperfine splittings in a system with S=1/2 and I=3/2. Allowed transitions between the nuclear levels obey the selection rule Δms=±1 and Δmi=0 and are indicated by the arrows. (B) Ideal EPR hyperfine spectrum for a species with I=3/2. The g-factor is determined from the field position of the center of the spectrum.
Hyperfine interactions are also possible between a paramagnetic ion and nearby ligands possessing nuclear spin such as 14N with I=1. The interaction of the central ion with n equivalent ligand nuclei produces (2nI+1) EPR lines. The value of the hyperfine constant A is dependent on the spin density of the electron at the nucleus and therefore on the bond strength in a molecule. An electron in an orbital that is mainly metal based will have high spin density at the nucleus of the metal and a large hyperfine constant (roughly greater than 50 MHz). The d-electrons of the metal can interact with ligands, giving a ligand nucleus a small spin density and a corresponding small hyperfine constant.
5. SPIN HAMILTONIAN
A paramagnetic metal ion can have multiple unpaired electrons resulting in spin states S>1/2. The spin Hamiltonian provides a compact way of representing the energy states of the metal ion with a relatively small number of terms that can be experimentally determined. The spin Hamiltonian used in SpinCount incorporates a wide array of interactions to be able to simulate EPR spectra from most any type of metal complex. Only a fraction of the possible terms in the spin Hamiltonian are required for a particular metal complex of interest. The more common terms are described next.
The spin Hamiltonian can be expressed in a summation of a number of terms as:
| (7) |
For the case of a system of two distinct metal ions (i=1, 2), describes the interaction of the spin magnetic moment of each metal ion with the external magnetic field B and the ligand field in terms of its spin S and g-tensor as (Abragam & Bleaney, 1970; Orton, 1969; Pake & Estle, 1973)
| (8) |
The first term is the Zeeman term and represents the interaction of each individual spin with the external magnetic field B. In the presence of spin–orbit coupling the g-tensor is anisotropic and can be expressed in terms of its principal values gx, gy, and gz. These intrinsic g-values of the metal center are typically close to 2 (1.6<g<2.4) and should not be confused with g-values variously referred to as effective, fictitious, or observed. The second term in Eq. (8) represents the zero-field splitting that removes the degeneracy of the 2S+1 manifold in zero magnetic field, which becomes relevant for ions with spin S>1/2 in ligand symmetries lower than octahedral. This second term is also due to spin-orbit coupling and is sensitive to the symmetry of the environment of the metal. The values D and E/D parameterize the axial and rhombic symmetry of the metal center. With an appropriate choice of coordinate system, the rhombic parameter is in the range 0≤E/D≤1/3.
The hyperfine interaction is introduced in the spin Hamiltonian via the term . The energy of interaction between a spin Si interacting with a nuclear spin Ij is equal to Si · Aij · Ij, where Aij is the hyperfine tensor.
The term describes the interaction between two spin centers that are close
| (9) |
where the terms are the through-bond electronic exchange interaction and the through-space magnetic dipole interaction. In special cases, such as Fe–S clusters or oxo-bridged metals, the magnitude of the exchange interactions between iron ions of the cluster is generally much larger in energy than the other terms of the spin Hamiltonian. Consequently, the individual spins of the iron ions couple to give total spin states (Bencini & Gatteschi, 1990), and usually one total spin state is low in energy (ground state) and well separated from all other total spin states. The energies of a total spin state, and the corresponding EPR spectra, can then be described with a single spin system using .
6. BASIC EPR INSTRUMENTATION
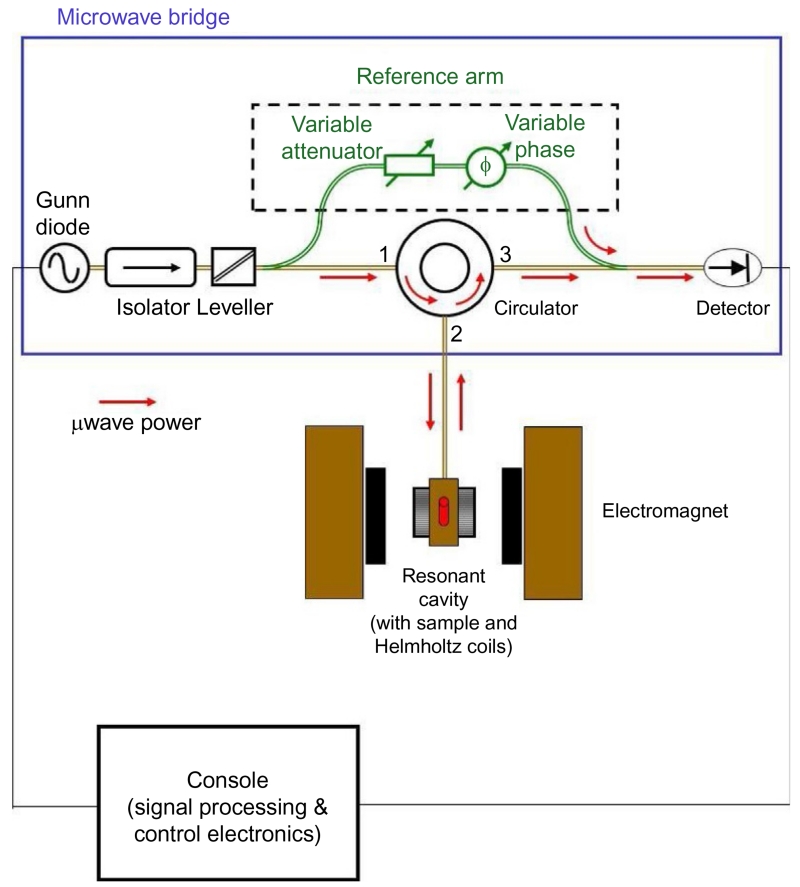
Most commercially available EPR spectrometers operate at X-band frequencies (8.5–12 GHz) and employ a continuous-flow liquid helium cryostat to reach very low temperatures (typical temperature range 2–150 K). They utilize a microwave bypass arm to bias a diode detector for increased sensitivity as shown in Fig. 4. The radiation from the micro-wave source (Gunn oscillator) travels to a resonant cavity where it is stored in the form of standing waves. When resonant absorption of radiation occurs in the sample, a small signal is reflected back from the resonant cavity to the diode detector which acts as a microwave rectifier. The rectified signal from the detector is processed by an electronics console and sent to a computer for recording and analysis. The low temperatures are important to slow electronic relaxation between spin states and to improve the signal-to-noise ratio of the spectrum.
Figure 4.
Schematic diagram of the EPR spectrometer. The microwave radiation is produced by a Gunn diode with a small amount diverted through the bypass arm to the detector. The remaining radiation travels down a series of waveguides, an isolator (protects source from reflected microwave power), and a leveler (controls the microwave power) through a circulator to the sample in the resonant cavity (red (gray in the print version) arrows). When the instrument is properly tuned, no microwave power is reflected back from the cavity. When the magnetic field is swept through resonance, microwave power is absorbed by the sample in the cavity and a small signal is reflected back from the cavity that travels through the circulator and is mixed with the signal from the bypass arm. The combined signal then travels to the detector and the electronics console for processing.
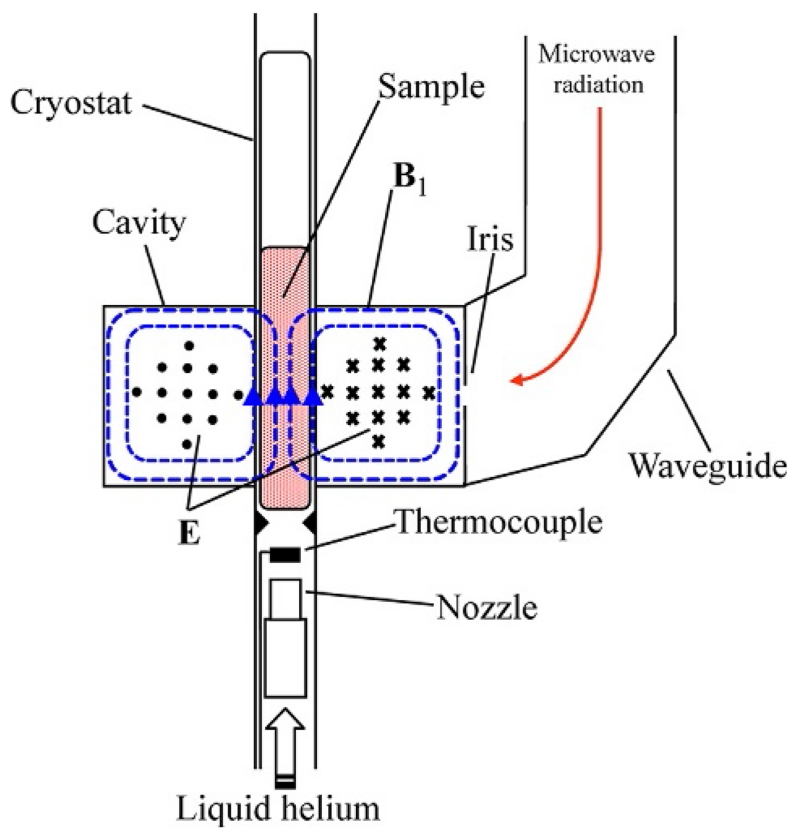
The sample is placed inside the resonant cavity at a position of maximum microwave magnetic field B1 as shown in Fig. 5. Bimodal rectangular cavities are available that allow the external magnetic field to be oriented in either a perpendicular or a parallel orientation relative to B1 for the detection of both half–integer and integer-spin systems, respectively. Alternatively, a cylindrical cavity can be employed with side-wall coupling as in the Q-band (34 GHz) spectrometer in our lab where the external magnetic field can be rotated between the perpendicular and parallel orientations (Petasis & Hendrich, 1999). In spectrometers operating at low temperatures, a continuous-flow cryostat is employed for cooling the sample to liquid helium temperatures. The cold helium gas flows through a nozzle equipped with a heater that allows control of the helium temperature. A thermocouple placed a few millimeters below the sample tube measures the temperature of the gas.
Figure 5.
Cross-section of a rectangular TE102 cavity with cryostat and sample. The microwave radiation is transmitted into the cavity through an adjustable circular iris and stored as standing waves. The magnetic field component of the microwave radiation (B1: dotted blue (gray in the print version) lines) is 90° out of phase relative to the electric field component (E: circles and x’s). The arrows show the direction of the B1 vectors inside the cavity. The E vectors are at right angles relative to B1, coming out of the page on the left half of the cavity (circles) and into the page on the right half of the page (x’s). The external magnetic field, provided by an electromagnet, is perpendicular to the plane of the page. The configuration shown allows the detection of species with half-integer spins. In a bimodal cavity, the microwave frequency can be adjusted to generate a different configuration of the standing wave pattern inside the cavity that allows B1 to orient parallel to the external magnetic field for the detection of integer-spin systems.
7. SIMULATION OF POWDER SPECTRA
The majority of EPR data from metal centers are recorded from frozen solution samples because electronic relaxation rates near room temperature are fast, resulting in excessive line broadening and loss of signal. Powder samples (no solvent) of synthetic complexes are often broadened by intermolecular dipolar interactions which cannot easily be modeled. Such broadened spectra tend to be less informative, nevertheless, it should be standard practice to record such spectra since the occurrence of resonances in positions unchanged relative to a frozen solution sample indicates that the molecule does not undergo a structural change in a solvent.
Whether measurements are from frozen solution or powder samples, the spectra of both are referred to as powder patterns. SpinCount will calculate spectra for single crystal or powder patterns. Simulations of powder spectra assume that all orientations of the molecule with respect to the magnetic field B are equally likely. A simulation is generated from the integral over a spherical surface of the magnetic field orientations. An angular grid of points is constructed for a specified range in θ and φ. This range is usually one octant (0<θ<90 and 0<φ<90), but lower symmetries with two metals will require calculation over additional octants. The number of points in the angular grid affects the smoothness of the simulation. More grid points will slow the calculation, but generate less computation noise. At each angular grid point, three quantities are calculated using Eq. (7) for the two levels of interest in the spin system: The intensity, the linewidth, and the magnetic field satisfying the resonance condition, hν=δE, where δE is the energy spacing between the two levels. The intensity is the transition probability between the two states (from the time-dependent quantum interaction with the microwave magnetic field) times the Boltzmann population difference. A Gaussian or Lorentzian line is then added to the simulated spectrum, centered at the resonance field with its calculated intensity and width. This represents the single-crystal contribution to the powder spectrum for the specific grid angles.
The ability to generate quantitative simulations requires not only the correct position and intensity of resonances but also an accurate match to the spectral line shape. The sources of line broadening for metal centers generally fall into three categories: lifetime, unresolved hyperfine coupling, and molecular disorder. In the absence of all other sources of broadening, the line shape is Lorentzian with a width determined by the lifetime of the electronic state. Electronic lifetimes for metal centers at 4 K are roughly 10−6 s, giving line widths of approximately 0.01 mT. The first and second coordination spheres of metal centers often contain multiple nuclei with spin I≠0 (e.g., 14N or 1H), giving unresolved hyperfine broadening of the spectra, which is usually well modeled with a Gaussian line shape. The width of this unresolved hyperfine splitting is of the order of 0.1–1 mT and can dominate the Lorentzian shape of lifetime broadening.
Numerous studies in our laboratory and others have shown that broadening from molecular disorder typically overwhelms the above two sources at low temperatures. Upon freezing a sample, the variation in the metal–ligand bonds of each molecule in a sample, possibly from vibrations or random solvent interactions, is fixed into a static distribution. This bond variation results in a distribution of the orbital energy levels, and via the spin–orbit interaction, a distribution in various molecular parameters such as g, D, and E/D. This source of broadening in EPR spectra is commonly referred to as g- or D-strain. To model these distributions, SpinCount has corresponding distribution parameters (e.g., σgx, σE/D) and a minimum line width usually due to unresolved hyperfine splitting.
Many metal centers have spin states with S>1/2 which show resonances from transitions between states other than ms=±1/2. In general, the number of possible transitions is S(2S+1); however, most of these will not contribute significant intensity. The most intense signals originate from transitions between doublets with Δms=±1, but the observation of other resonances is often critical for determination of zero-field or exchange energies. Although common desktop computers are now available with fast numerical processing, as S increases, it may be useful to optimize the calculation of the simulation to focus on those transitions which are observed experimentally, so that calculation time is not wasted on transitions that have negligible intensity. This is especially true for least-squares fitting of data. By default, SpinCount calculates all transitions, but options are available to restrict the calculations to those the user considers important.
8. QUANTITATIVE ASPECTS
An important aspect of magnetic resonance spectroscopies is the quantitative intensity relation to the spectrum. The interaction of the microwave radiation with the sample can be modeled with time-dependent perturbation theory to give the transition rate for electrons in resonance and therefore the intensity of the corresponding signal. This calculation depends on the spin wave functions of the metal center which can be accurately determined, and the intensity of the spectrum can thus be directly related to species concentration. EPR spectroscopy can provide a primary determination of concentrations of metal species for a sample. For simple spin S=1/2 centers, or a single resonance from centers with S>1/2 which can be effectively modeled as S′=1/2, the concentration of the species can be determined from double integration of the experimental spectrum. A double integration is necessary because the concentration depends on the area under the absorption curve, and the experimental spectrum is the first derivative of the absorption with respect to the magnetic field. However, as is often the case for protein complexes, the signal of interest can overlap with signals from other spin centers or paramagnetic impurities, which invalidate integration methods for concentration measurement. Integration methods are also invalid for spin systems with multiple states in resonance, or not reducible to an effective S′=1/2 center, or for integer-spin centers (S=1, 2, 3, …). For all cases in which integration methods are invalid, the concentration of species can be determined from simulation of the spectrum. A central feature of SpinCount is the ability to extract concentrations of species directly from spectra, either with double integration (when valid) or by reference to a simulation.
The experimental signal intensity is a function of the microwave components, receiver gain, digitization and dwell time, microwave mode, field modulation, sample volume, concentration, sample solvent and holder, temperature, microwave frequency and power, and all the theoretical considerations discussed above in the simulation of a spectrum. Many of these factors specifically depend on the properties of the particular EPR spectrometer that is recording the spectrum. SpinCount has a spectrometer-dependent component that links the required information from the spectrometer (referred to as an instrument) to a quantitative intensity scale within SpinCount. Each spectrometer requires its own instrument declaration, and the validity of the declaration must be initially checked with an intensity calibration procedure to verify that the intensity controls are correctly set. The intensity scale depends on a calibration constant specific to the spectrometer which is easily determined from the spectrum of a spin standard. We routinely log a spin standard into SpinCount each day to account for any changes in instrumentation.
An accurate determination of the spin concentration is dependent on proper choice of experimental parameters and the correct sample temperature. A spin standard can be any compound for which the concentration of spin centers in the sample can be independently determined, but for simplicity, the standard should have S=1/2. A common choice for low-temperature studies is the ethylenediaminetetraacetic acid (EDTA) complex of Cu2+, at a concentration of 1 mM Cu2+ with 10-fold excess EDTA in an aqueous solution, pH 4, having 10% glycerol. Accurate standards of copper solutions are available from chemical suppliers. The accuracy of the intensity calibration will depend on several factors: careful analytical preparation of the standard sample, the effect on the microwaves by the sample in the cavity, sample geometry, measurement of the EPR spectrum under proper conditions, proper calculation of the second integral, and an accurate value of the sample temperature. It is of critical importance to record the spin standard and unknowns under nonsaturating microwave power conditions for quantitative information. The microwave power is nonsaturating if the signal intensity is proportional to the square root of the microwave power.
The introduction of a sample into the cavity distorts the microwaves and thus affects the magnitude of the microwave magnetic field incident on the sample (Fig. 5; Poole, 1983). The microwaves are affected both by the amount of quartz holding the sample and the solvent properties. The sample tubes should be of an approximately consistent quartz thickness, and the polarity of the solvent should be similar to the unknown. The effect of solvent can be checked by comparing integrated signal intensities of spin standard samples in various solvents. Also important is the difference in expansion or contraction of water versus organic solvents when freezing the samples. A water solution will expand by roughly 10% upon freezing, which reduces the spin concentration in the microwave cavity. Using a spin standard in water to quantify an unknown in an organic solvent would give an inaccurate spin concentration.
The sample geometry of the spin standard in the cavity should mimic that of the unknown. The sample tubes should be the same diameter and the length of the samples in the cavity should be the same. The length of the sample should ideally span the entire length of the cavity (Fig. 5), typically 25 mm. Any part of the sample that is outside of the microwave cavity does not contribute to the signal intensity. The quartz stock used to make the sample tubes will often give small variations in the cross-sectional area of the tube. The cross-sectional area can be easily determined by measuring the length of a solution of known volume in the tube. SpinCount has corrections for the cross-sectional area and for short samples that do not span the length of the cavity.
A significant source of error in spin concentration determinations is incorrect sample temperature information. The widely used liquid helium flow cryostats have inherent temperature uncertainties because the metal temperature sensors cannot be positioned directly at the sample. The temperature probe is positioned approximately 5 mm from the bottom of the sample tube (Fig. 5). Consequently, the actual sample temperature is dependent on the flow and pressure of helium. The helium must be maintained at a sufficiently high flow to provide a uniform temperature along the sample. The temperature can be calibrated with a sensor mounted in an EPR tube, but then it is important to maintain the whole helium system at the same pressures and flows for sample measurements. Ideally, the standard and unknown should be recorded at the same temperature. Provided the temperature information is good, or at least linearly correct, a 1/T correction can be applied for S=1/2 complexes when determining spin concentrations. For samples with S>1/2, other corrections will be necessary if double inte gration is used to determine the spin concentration. For spin concentration determinations from simulations, the appropriate factors are known and incorporated into the simulations.
9. APPLICATIONS
9.1 S=1/2 Spin Systems
Spin S=1/2 mononuclear metal centers in biological system include low-spin d5 Fe3+, low-spin d7 Co2+, d9 Cu2+, and d1 Mo5+. Spin S=1/2 species require a minimal set of parameters to characterize. Simulations are generated by specifying the principal components of a g-tensor and a g-strain tensor σg for a rhombic EPR spectrum, where the values for σg are the width of the distribution of g-values. There are many potential sources for broadening of spectra, but the dominant source for S=1/2 species is often g-strain. As the value of δgi=|gi−2.00| (i=x, y, z) increases, the corresponding orbital contribution (and larger variation) results in broader lines. The ratios σgi/|δgi| are approximately constant provided that other sources of broadening, such as unresolved hyperfine, do not significantly contribute to the linewidth.
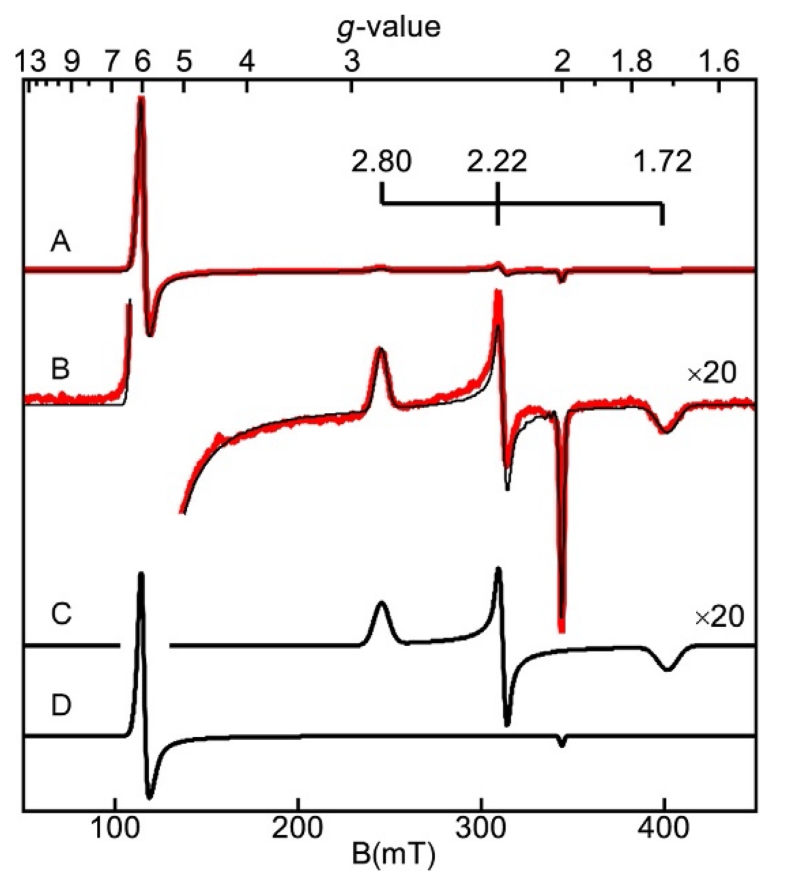
The spectrum of metmyoglobin partially bound with azide is shown in Fig. 6. A mixture of species is purposefully shown since the intent of this review is to give more advanced uses of EPR spectroscopy for common laboratory settings. Metmyoglobin contains a high–spin Fe3+ heme in a high-spin S=5/2 state (g=6, 2), which will be discussed in a later section. The binding of azide to the iron results in a spin state change to low-spin S=1/2. In biological systems with few exceptions, only iron centers when bound to macrocycles, such as porphyrin, are observed to change spin state with exogenous ligand binding. Myoglobin azide displays a rhombic spectrum with g-values (2.80, 2.22, and 1.72) typical of low-spin hemes. The large shift of the g-values from 2.00 has been modeled and found to be strongly dependent on the axial ligands. The Griffith model gives a relation between the g-values and the ratio of the energy splittings within the t2g set of iron orbitals. From studies of a large number of hemes with an axial histidine, the orbital splittings have been used to create a diagram which predicts the identity of the molecular species coordinated trans to histidine (Palmer, 2000). SpinCount will predict g-values based on the Griffith model and show the position of the molecular species on the diagram.
Figure 6.
EPR spectrum (A) (red (gray in the print version) trace) and simulations (black traces) of metmyoglobin (Fe3+) partially bound with azide, pH 7.8. (B) is (A) magnified by 20. Experimental conditions: temperature, 11 K; microwaves, 2 mW at 9.624 GHz. Simulation: (C) S=1/2, g=(1.708, 2.206, 2.802), and σg=(0.023, 0.012, 0.046). (D) S=5/2, g=(1.989, 1.989,2.000), D=7 cm−1, E/D=0.004, and σE/D=0.005.
Samples, whether biological or synthetic, are often not of high purity without significant preparatory work directed at the isolation of a particular species. Initial sample preparations may show multiple species, or the isolation of a single species is not required, or not possible. For such cases, as discussed in Section 8, the determination of species concentrations from integration methods is not possible. SpinCount is particularly useful for simulating signals with multiple overlapping species. The program combines least-squares fitting and singular value decomposition to allow deconvolution of overlapping signals. This allows identification of species and their respective concentrations. The myoglobin spectra of Fig. 6 are such an example. The software simulates the two signals and produces a sum of the simulations with an amount of each species that gives the best fit to the experimental spectrum. As mentioned above, the y-axis of SpinCount is calibrated, and so the concentration of each species is a parameter of the simulation which is determined by matching the experimental and simulated intensities.
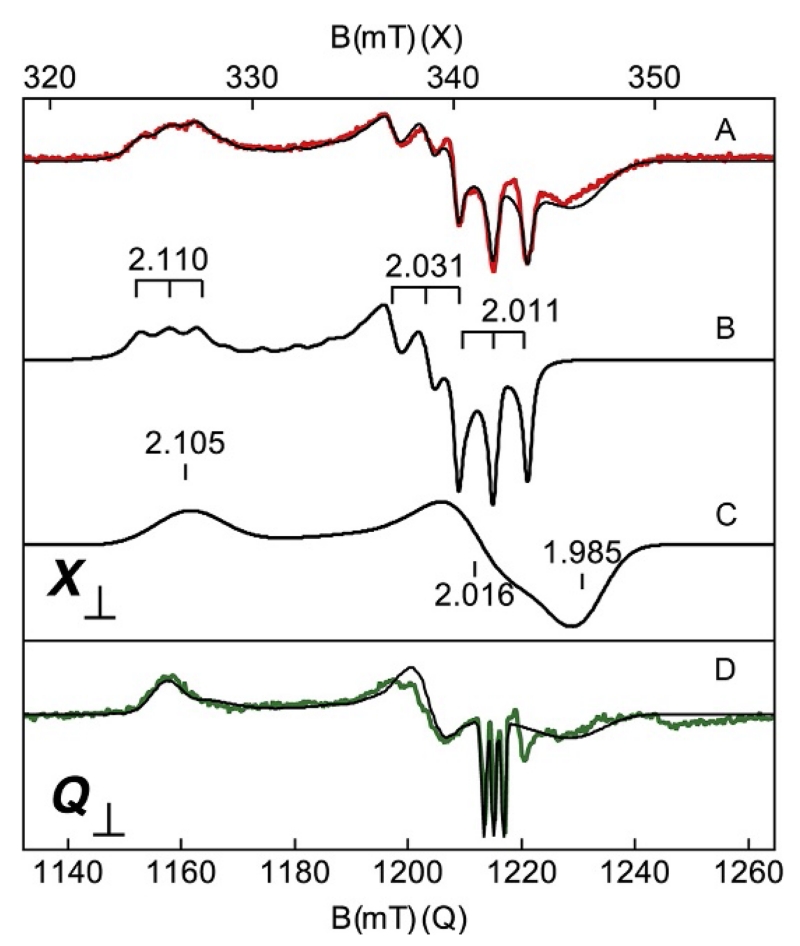
For metal ligands which possess a nuclear spin, additional terms in the spin Hamiltonian (Eq. 7) must be added. Figure 7A shows an example, which includes a hyperfine interaction from 14NO bound to the iron of heme in the reduced form of the enzyme tryptophan dioxygenase (Gupta et al., 2010). The nuclear spin of 14N (I=1) and a corresponding hyperfine tensor A were required for characterization. The spectrum shows a triplet of lines (2I+1) at each of the principal g-values (2.110, 2.031, and 2.011). Although this appears to be a straightforward application, attempts to simulate the signal failed to match the spectrum, mainly because of additional signal intensity at g=1.985. Additional seemingly spurious signals can be incorrectly attributed to impurities, as was the case for this enzyme, but careful consideration can uncover important properties. The addition of another S=1/2 species into the simulations provided an explanation of the extra signals. The simulations of the two species are shown in Fig. 7B and C and the sum is overlaid on the experimental spectrum of Fig. 7A. The species of Fig. 7B has well-resolved hyperfine lines, whereas the second species (Fig. 7C) has significant heterogeneity at the active site which causes the hyperfine lines to be unresolved. Multiple different enzyme preparations produced the same signals, with the same ratio of intensities, providing the first clue that the second species was not spurious. The concentrations of the two species determined from the simulations were found to be equal, and each accounted for one-half of the total heme in the sample.
Figure 7.
(A) X- and (D) Q-band EPR spectra (colored traces) and simulations (black traces) of the NO adduct of Tryptophan dioxygenase (Gupta, Fu, Liu, & Hendrich, 2010). (B, C) The simulations of the two heme species. (A, D) Simulation sums of the two species at equal concentrations. The magnetic field ranges are plotted for equal g-scale across microwave frequency. Experimental conditions: microwaves, 0.02 mW at 9.625 GHz (X) and 0.005 mW at 34.197 GHz (Q); temperature, 20 K (X) and 27 K (Q). The weak signal near g=1.96 is due to a minor amount of free NO in solution. The g-tensors of the simulations are listed on the figure. The 14N (I=1) A-tensor for (B) is 48, 49, and 39 MHz or 1.6, 1.6, and 1.5 mT.
Further evidence was gathered from spectra at a second microwave frequency. The spectrum shown in Fig. 7D was recorded on a spectrometer operating at 34 GHz (referred to as Q-band). The spectra in the top and bottom parts of Fig. 7 are plotted for equal g-scale, meaning that the limits of the magnetic field range of the Q-band display are chosen to be 34.20/9.63 (ratio of frequencies) times the limits of the X-band display range. For such a plot, features which depend linearly on the magnetic field align vertically, whereas features that are not dependent on magnetic field, such as the hyperfine interaction (Eq. 6), do not align. The ability to resolve hyperfine splitting in experimental spectra improves as the microwave frequency is decreased because the linewidth of resonances has a field-dependent component. Simultaneous least-square fits of the spectra produced the simulations shown in Fig. 7 for the two microwave frequencies, both with the same set of parameters. The simulation sums for equal species concentrations predicted both spectra as shown. The isotropic part of A, Aiso=(Ax+Ay+Az)/3, is dependent on the spin density on the nucleus. For the heme-NO complex of Fig. 7B, Aiso=45 MHz, which in comparison to that of free NO (approximately 70 MHz), indicated significant radical character on NO. The above indicated that the spectra contained two distinct S=1/2 rhombic species from heme-NO adducts. Tryptophan dioxygenase has four subunits per protein with each subunit containing one heme. The speciation from the EPR spectra demonstrated that the electronic configuration of the four hemes corresponded to a dimer of dimers.
The magnitude of A-values is a strong function of the electronic spin density on the corresponding nucleus. For ligands, the spin density is typically due to the covalency of bonds to the metal and is low, giving A-values on the order of 10 MHz. The A-value for the above heme-NO complex is much higher because NO has nearly one unpaired electron. The A-values are much higher for metals (>100 MHz) due to the higher nuclear charge and the polarization of s-orbitals by unpaired d-electrons. The A-tensors of metals can be highly anisotropic (Ax≠Ay≠Az) due to the magnetic dipolar interaction of the electronic spin with the nuclear spin. Cu2+ complexes are a good example. Cu2+ sites in proteins typically show an axial type spectrum (Fig. 2C) with only the gz=g∥ feature split by the hyperfine quartet of lines (I=3/2). The values for Ax≈Ay=A⊥ are small (corresponding to gx≈gy=g⊥), whereas the value for Az=A∥ (corresponding to gz=g∥) is typically an order of magnitude larger; consequently, the hyperfine lines are resolved at g∥ but not at g⊥.
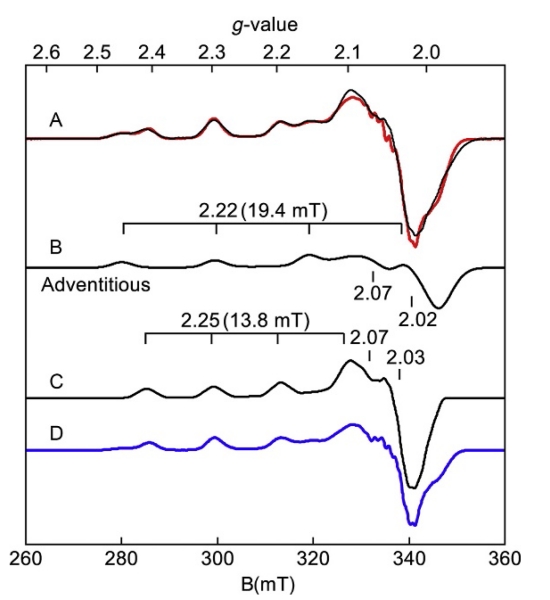
Figure 8 shows EPR spectra of the protein nitrosocyanin which contains Cu2+ coordinated to residues His, His, Cys, and Glu in a distorted square pyramidal geometry (Arciero, Pierce, Hendrich, & Hooper, 2002). As is common before further purification, the sample showed multiple species (Fig. 8A, red (gray in the print version) trace). The presence of two species was initially derived from simulations of the spectra. The simulation overlaid on the data in Fig. 8A is a sum of two Cu2+ species in amounts of 36% and 64% of the total copper in the sample. The simulations of the individual species are shown and the values of g∥ and A∥ are indicated in the figure. After further treatment of the protein with EDTA and gel filtration, the species with A∥=19.4 mT (adventitious) nearly vanished to reveal the spectrum corresponding to the Cu2+ site of nitrosocyanin (Fig. 8B, blue (dark gray in the print version) trace) which matched the simulation. As copper complexes distort away from square planar toward tetrahedral, the g∥ increases concomitantly with a decrease in the observed A∥ value, as was observed for the nitrosocyanin Cu2+ species that remains.
Figure 8.
EPR spectra (colored traces) and simulations (black traces) of nitrosocyanin, pH 7 in KPi, KCl. (A) As isolated, (D) after EDTA treatment and gel filtration. Experimental conditions: Temperature 15 K; microwaves 0.002 mW at 9.618 GHz. Simulation: S=1/2, g-values as listed, (B) Az=600 MHz (19.4 mT) or (C) 430 MHz (13.8 mT) for I=3/2.
9.2 Spin Systems with S=3/2, 5/2, 7/2, etc
For spin systems with S>1/2, terms containing the axial (D) and rhombic (E/D) zero-field splitting parameters contribute to the spin Hamiltonian (Eq. 8). These terms originate from the spin–orbit interaction and cause the spin levels to split in energy in the absence of a magnetic field. The values of D and E/D depend on the metal, the ligands to the metal, and the geometry of the ligand coordination. The spectra can be further classified by the magnitude of D being greater than or less than the microwave energy hν of the spectrometer. For complexes with D significantly greater than hν, the ms states of the spin manifold split into degenerate doublets |±ms>, and the resonances can occur at g-values far from g=2.0. This D>hν class of spectra will be discussed next.
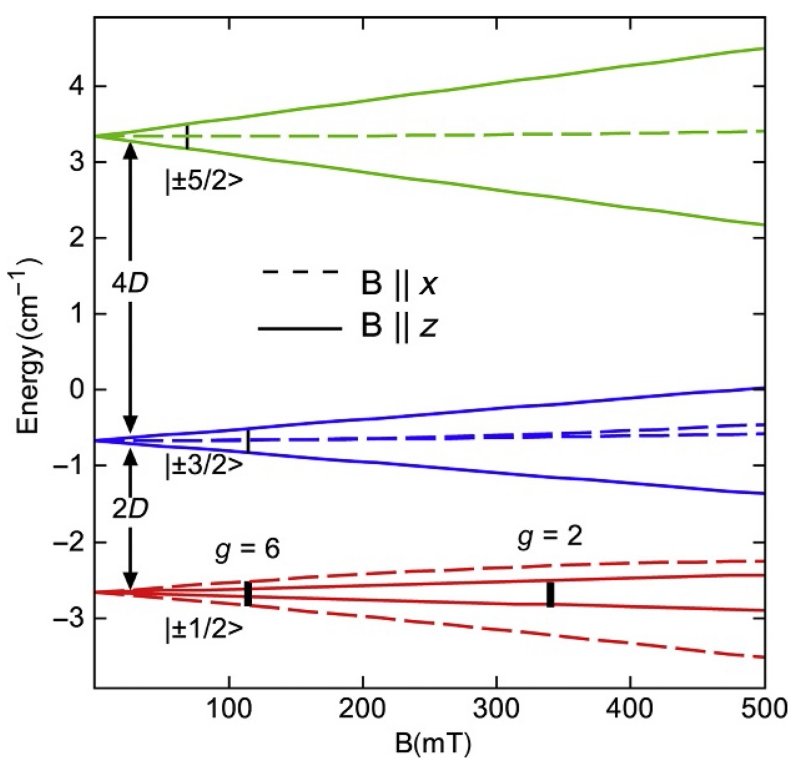
For iron complexes, the magnitude of D (typically 1–10 cm−1) is larger than the quantum of energy for common X-band EPR spectrometers (ν ≈ 9.5 GHz, hν=0.3 cm −1), but the ensuing discussion is applicable to other metals having D>hν. An energy-level diagram as a function of magnetic field is shown in Fig. 9 for S=5/2 with D=1 cm−1 and E/D=0. The z-axis is usually chosen along a symmetry axis of the molecule, e.g., perpendicular to the plane of the porphyrin for a heme center. For the magnetic field aligned with the z-axis (B∥z, solid lines), the splitting of the doublets due to the magnetic field is proportionally larger for higher ms values. For B∥x (dashed lines), only the |±1/2> doublet splits appreciably with magnetic field, and this splitting is three times greater than that for the z-axis. The black vertical lines in Fig. 9 mark magnetic field values for which the resonance condition δE=hν is obeyed, where δE is the splitting in energy between two spin levels. For the |±1/2> doublet, the resonances occur at fields of 340 mT (B∥z) or 110 mT (B∥x or B∥y), corresponding to g-values of 2 and 6, respectively. These transitions are allowed, whereas the transitions for the |±3/2> and |±5/2> doublets are not allowed for E/D=0. Consequently, EPR spectra are dominated by the |±1/2> doublet for metal centers in near axial symmetry.
Figure 9.
The energies of the spin states for S=5/2, D=1 cm−1, E/D=0 as a function of the magnetic field along the x-axis (dashed lines) and z-axis (solid lines).
The spin doublets |±ms> of Fig. 9 are separated by an energy greater than hν ≈ 0.3 cm−1. These isolated doublets can each be represented by an effective S′=1/2 system whose effective principal g-values (g′) are determined from a calculation based on
| (10) |
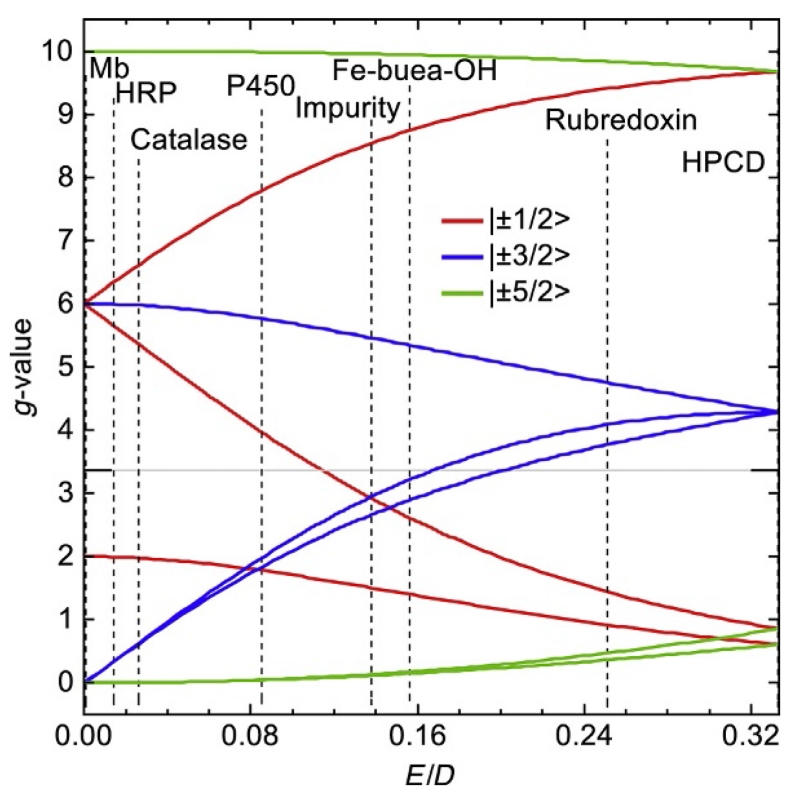
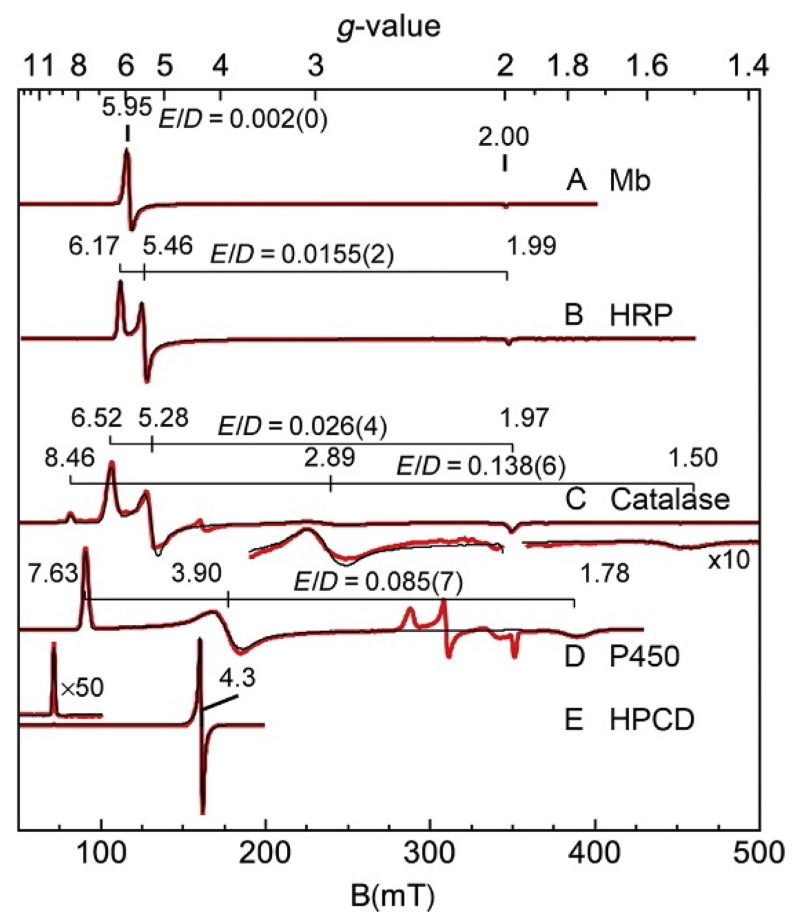
Figure 10 shows the principal effective g-values for each of the three doublets of an S=5/2 spin system as a function of E/D. The values of the effective g’ can be much different than 2.0, whereas the values of g are always near 2.0. Figure 10 is a powerful tool in identifying species since all possible g-values for an S=5/2 complex occur on this plot and the g-values of any S=5/2 complex will all cross at a single vertical line on this plot, provided that g=2.0 for Eq. (10). Similar plots can be generated for S=3/2, 7/2, 9/2, etc. Figure 11 shows EPR spectra and simulations from several FeIII complexes with E/D ranging from 0 to 0.33. The FeIII ion of metmyoglobin (Mb) is nearly axial (E/D=0) and the principal g-values (6, 6, and 2) are read off of the edge of Fig. 10 for the |±1/2> doublet (red lines). The spectrum of Mb at g=6 is more intense than that at g=2 because the polycrystalline (frozen solution) sample has more molecules with B aligned near the x- and y-axis (in the porphyrin plane) than the z-axis of the molecule. As the symmetry of the metal center becomes more rhombic, E/D increases and the principal g-values for the |±1/2> doublet shift from 2 and 6.
Figure 10.
The effective principal g-values for the three doublets of an S=5/2 spin system as a function of E/D. The vertical lines indicate the value of E/D for the complexes listed in Figs. 11 and 12.
Figure 11.
EPR spectra (red (gray in the print version) traces) and simulations (black traces on spectra) of (A) metmyoglobin, (B) horseradish peroxidase, (C) catalase, (D) cytochrome P450, and (E) homoprotocatechuate dioxygenase. Experimental conditions: temperature, ~10 K, except (E) 2 K; microwaves, 9.66 GHz. The simulation parameters are for S=5/2 with E/D values as listed. The parenthetical values are the width σE/D of the distribution in E/D.
For EPR signals that can be described by an effective spin S′=1/2, the concentration of species can be determined from double integration of spectra with a correction for the use of effective spin (Aasa & Vänngård, 1975). The correction factor is determined by the g–values and incorporated into SpinCount. Figure 10 is useful for a qualitative understanding, but simulations provide accurate and quantitative assignment of signals if multiple species are present. SpinCount calculates spectra from the spin Hamiltonian of Eq. (7) and therefore incorporates the information displayed in Fig. 10, in addition to accurate spectral intensities. The simulations quantitatively account for the polycrystalline sum, in addition to changes in the transition probability (intensities) as a function of field. The catalase spectrum provides an example of the use of simulations for more complicated spectra that may be observed in the laboratory. This catalase sample was prepared from a protein stock solution purchased from Sigma–Aldrich. The catalase spectrum (Fig. 11C) had an additional species (Fig. 11C magnified by 10) with g-values of 8.46, 2.89, and 1.50 which corresponds to E/D=0.138 as indicated for the “impurity” species in Fig. 10. The impurity displayed only a prominent peak at g=8.46 and one might be tempted to dismiss this signal or incorrectly associate it with the small peak at g=4.3. The simulation overlaid on the experimental spectrum is composed of two species with parameters given in Fig. 11C, which indicated that the g=8.46 and weaker g=2.89 and 1.50 resonances are associated with the same species. The simulations allowed a concentration determination of each species. Although the resonance features of the impurity appeared weak relative to that of catalase, the impurity accounted for 30% of the iron in this sample. The impurity species had weaker intensity because it spanned a larger magnetic field range. The larger value of E/D for the impurity suggested degradation of the porphyrin.
Metal centers that are not coordinated to a macrocycle typically show rhombic symmetry with high values of E/D. As E/D increases, the transitions within the |±3/2> and |±5/2> doublets become allowed, and for E/D>0.15, the signal from the |±3/2> doublet dominates the spectrum. Figure 10 shows that as the value of E/D approaches 0.33, the three principal g-values of the |±3/2> doublet become equal to 4.3, whereas the g-values of the other doublets are widely spread from 10 to below 1. The g=4.3 signal is intrinsically much more intense because the resonances all occur near the same g-value. The reader is cautioned regarding assignments of a g=4.3 signal to an important unknown species. Oxidized adventitious iron or iron impurities in low amounts often show surprisingly intense signals at g=4.3. Too often, such signals in the literature are incorrectly assigned as the majority species of samples. The determination of species concentrations from spectra should be standard practice. A g=4.3 signal is often sufficiently sharp that double integration methods for an effective S′=1/2 species will give an approximate concentration. For this determination, the signal should be recorded for higher sample temperature (>30 K) to assure that each of the three doublets has approximately equal population. The double integration of the region encompassing most of the g=4.3 signal (but not any other signals) is then multiplied by 3 to account for the spin population in the other doublets that are not included in the integration.
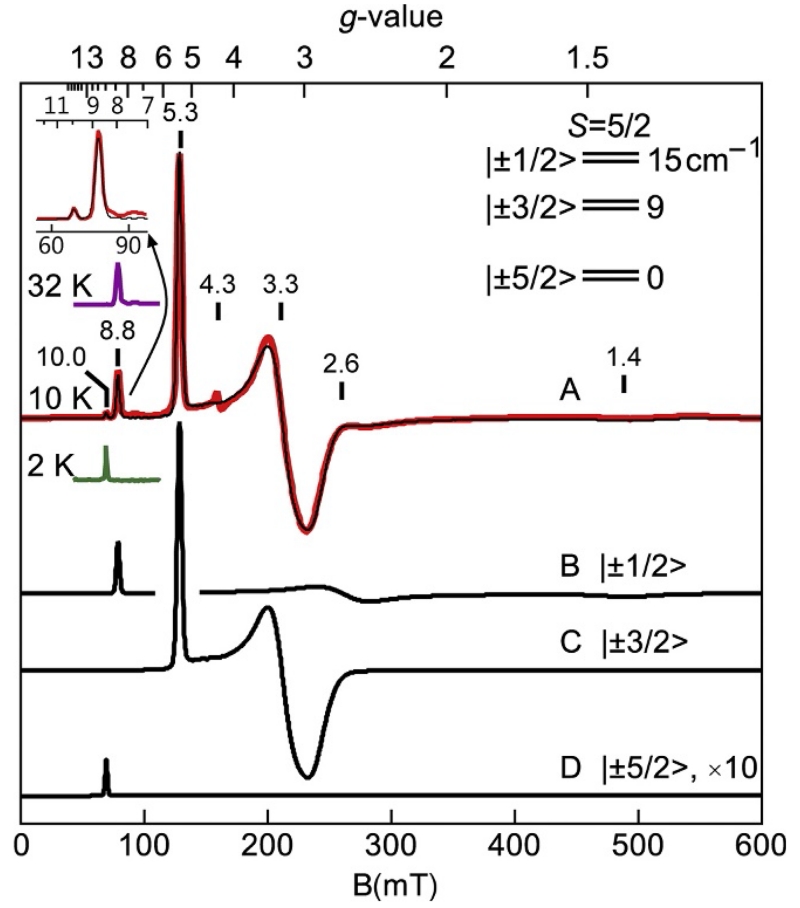
Biomimetic complexes can provide examples of spectra with better resolution and without significant impurities. The spectra of a few of these complexes are presented here and below to illustrate concepts. Figure 12 shows the spectrum (red (gray in the print version) line) of [FeIIIH3buea(OH)]− (tripodal ligand H3buea=tris[(N′-tert-butylureaylato)-N-ethylene]aminato) (Gupta, Lacy, Bominaar, Borovik, & Hendrich, 2012). The spectrum showed a high variation in the intensities of resonances at the g-values noted. The presence of many resonances might suggest that the sample has multiple species, but application of Fig. 10 indicated otherwise. By aligning the g-values with a particular value of E/D, all but one resonance intersects with the curves at E/D=0.16. The resonance at g=4.3 does not align and therefore originated from a second species, which was a negligible impurity (based on spin quantitation). The wide variation in the intensity of signals was because of the wide range of g-values and resonances from different doublets of the S=5/2 spin manifold. The purple (dark gray in the print version) and green (light gray in the print version) traces of Fig. 12 in the g=9 region were for sample temperatures of 32 and 2 K as indicated. The temperature dependence was used to determine the energy-level diagram shown in Fig. 12. The g=10.0 resonance from the |±5/2> doublet (lowest in energy) was intense at 2 K and vanished at 32 K, whereas the g=8.8 resonance from the |±1/2> doublet was intense at 32 K and vanished at 2 K. The temperature dependence of an EPR signal is proportional to NmsT, where Nms is the Boltzmann spin population of the |±ms> doublet and T is temperature. For this complex, the |±1/2> doublet is 15 cm−1 above the ground |±5/2> doublet. As the temperature is raised, the population N1/2 increases at the expense of the other doublets.
Figure 12.
EPR spectra (red, gray in the print version) and simulations (black) of (A) [FeIIIH3buea(OH)]− in DMF/THF. (B–D) Simulations from transitions within the |±ms> doublets as listed. Experimental conditions: Microwaves 0.2 mW at 9.64 GHz; temperature 10 K. Simulation: S=5/2, g=(2.011, 2.009, 2.012), D=−2.4 cm−1, E/D=0.157, and σE/D=0.011.
The simulation of Fig. 12A (black line) for the parameters given in the caption verified the above interpretation. The simulation quantitatively agreed with the experimental spectra at all temperatures and the overall intensity was predicted by the iron concentration of the sample. The inset shows a magnified display for the g~9 region of the spectrum and simulation. Figure 12B-D shows simulations for each ±ms doublet contributing to the spectrum. The relative intensities of signals and their resonance position allowed an accurate determination of D, E/D, and the distribution in E/D (σE/D) of the complex. For this complex, the |±5/2> doublet is lowest in energy and thus D<0.
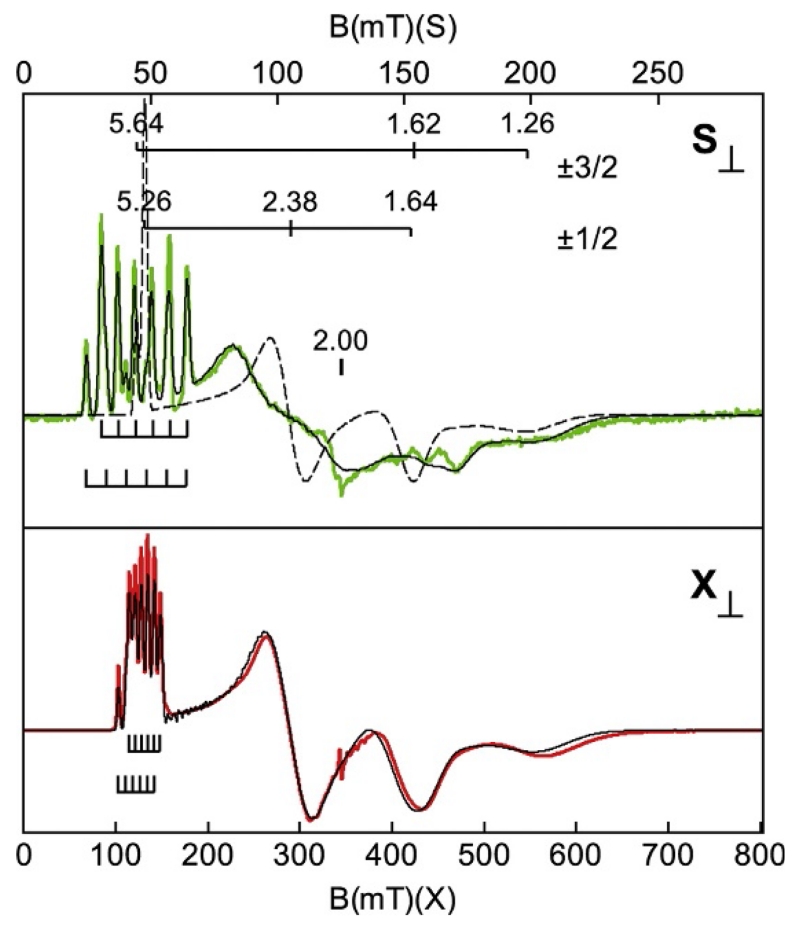
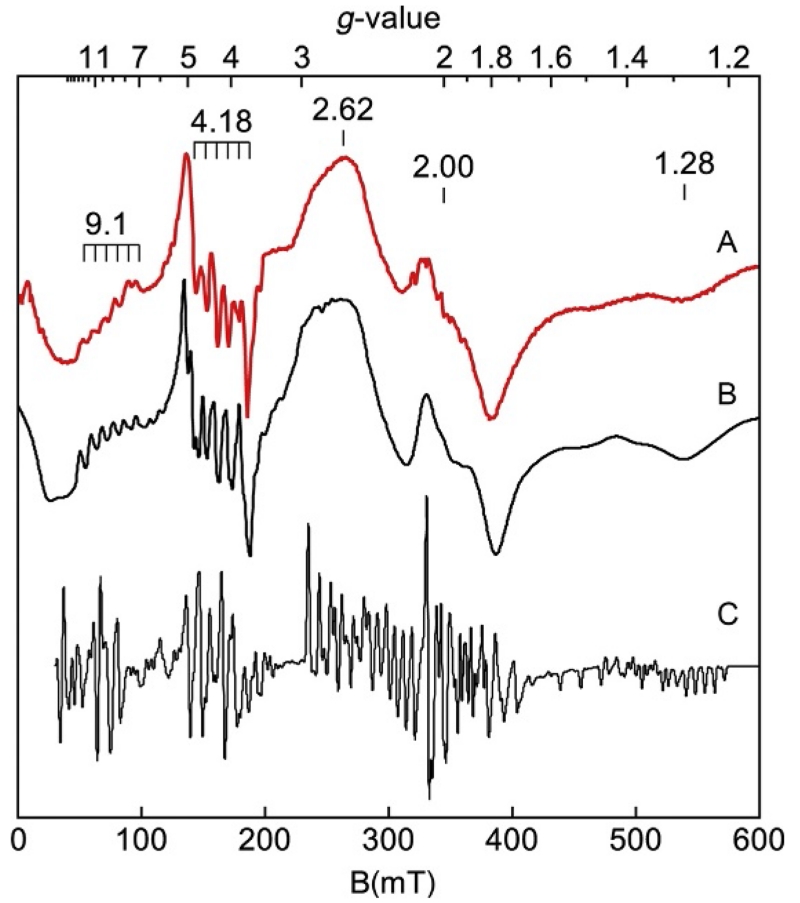
The same type of analysis can be applied to other spin systems. Figure 13 shows EPR spectra for the S=3/2 complex [MnIVH3buea(O)]− (Gupta et al., 2015). The X-band spectrum showed a resolved six-line (2I+1) hyperfine pattern at g=5.26 (center of pattern) from the nuclear spin I=5/2 of 55Mn and other resonances without resolved hyperfine at g-values of 2.38, 1.64, and 1.26. All these effective g-values were predicted from an S=3/2 g-value diagram (similar to Fig. 10; Palmer, 2000) for E/D=0.26. The spectrum near g=5.26 actually showed seven lines (not six) in a near equal spacing, but this was due to the overlapping signals of the |±1/2> and |±3/2> doublets. The simulation of Fig. 13 confirmed this assignment and accurately predicted the intensity of the entire spectrum with the overlapping resonances from both doublets. Again, such an overall match of experimental and simulated spectra is important for measurement of the species concentration, and verification that the signals do not originate from other species. The common double integration method for species concentrations would fail in this case owing to the overlapping signals.
Figure 13.
S- and X-band EPR spectra (colored traces) and simulations (black traces) of [MnIVH3buea(O)]− in DMF/THF. The magnetic field ranges are plotted for equal g-scale across microwave frequency. A minor impurity occurs near g=2.00 in both spectra. Experimental conditions: Temperature 12 K; frequency 3.500 GHz (S) and 9.642 GHz (X); and power 0.03 mW (S), 0.20 mW (X). Simulations: S=3/2, D=+2.5 cm−1, E/D=0.256, σE/D=0.024, g=(2.01, 1.99, 1.99), A=(165, 188, 244) MHz, A-tensor rotated relative to D-tensor by 36° about the y-axis.
Figure 13 shows data from X- and S-band microwave frequencies. Multifrequency EPR spectra paired with simulation are a method for extracting hyperfine constants from data for which the hyperfine lines are unresolved. The hyperfine A-tensor for metals may be anisotropic (Ax≠Ay≠Az); consequently, the directions with larger A-values may display a resolved hyperfine pattern, but not for the smaller A-values. The hyperfine splitting is a function of the interaction of the electronic spin with the nuclear spin, S · A · I, which lacks an explicit magnetic field dependence. As the microwave frequency is lowered, the hyperfine term has a larger contribution to the energy of the spin state. The effect is best observed by plotting spectra with equal g-value ranges, where g=hν/βB. For Fig. 13 (similar to Fig. 7), the magnetic field ranges of the upper and lower panels were chosen so that a g-value in the upper panel is at the same horizontal position in the lower panel. In the absence of a nuclear spin, the two spectra would be essentially superimposable. Figure 13 shows that the hyperfine splitting near g=5.6 appears narrower in X-band relative to that shown in S-band. The same effect occurs for the other resonances; the observed broadening of the signals at S-band is due to the unresolved hyperfine contribution. Although the hyperfine lines were not resolved for the other g-values, simulations that match the two spectra required a unique set of A-values. The dashed simulation in the upper panel of Fig. 13 shows the effect of removing the nuclear spin.
The above discussion applies to complexes with D>hν where the energy levels of the spin system separate into Kramers’ doublets, and the spectra consist only of transitions from within these doublets. For complexes which fall into the other classification (D<hν), many more transitions are possible and the spectra can become considerably more complicated and only simulations can provide a quantitative interpretation.
Figure 14A shows an EPR spectrum of the enzyme Mn homoprotocatechuate dioxygenase MnHPCD, which contains Mn2+ (d5, S=5/2) at the active site (Gunderson et al., 2008). Mn2+ with mostly water coordination has small values of D ≈ 0.01 cm−1. When coordinated to N- and O-donors from histidine and glutamate the D-value increases. In the presence of the substrate homoprotocatechuic acid, the O-donors of the catechol further increase the D-value (D=0.09 cm −1). A simulation of the spectrum is shown in Fig. 14B. The nuclear spin of 55Mn (I=5/2) causes each transition to split into six hyperfine lines. The powder average and large number of transitions resulted in highly complex spectra for which the hyperfine splitting was resolved in only a few positions, as was predicted by the simulation. The distributions in D and E/D were found to be the dominant contribution to the line shape and rendered the hyperfine patterns too broad to be observed for most transitions. For comparison, Fig. 14C is a simulation with no distribution in D and E/D. The concentration of Mn in the protein was determined from the simulation and was found to be in agreement with metal analysis by inductively coupled plasma emission spectroscopy.
Figure 14.
EPR spectrum (A) and simulation (B) of the homoprotocatechuic acid complex of MnIIHPCD. Spectral parameters: microwaves 0.2 mW at 9.65 GHz; temperature 11 K. Simulation parameters: S=5/2, I=5/2, g=2, D=0.090 cm−1, σD=0.005, E/D=0.310, σE/D=0.031, A=250 MHz (8.9 mT). (C) Same as (B) except σD=σE/D=0.
9.3 Spin Systems with S=51, 2, 3, 4
The above examples involve metal centers containing an odd number of unpaired electrons and therefore half-integer-spin states. For these odd electron systems, in the absence of a magnetic field (zero-field), the |±ms> spin states will always form degenerate doublets. The applied magnetic field will split a degenerate doublet, and the energy splitting will be linearly proportional to the magnitude of the magnetic field. The observation of an EPR signal is guaranteed, with the position given by the resonance condition δE=hν=gβB. Metal centers containing an even number of unpaired electrons have integer-spin states. In contrast to half-integer systems, all spin levels of an integer-spin system may have different energies in zero field. The detection of an EPR signal is not guaranteed because the difference in energy between any two spin levels may be greater than the microwave energy, hν. The lack of spin state degeneracy in zero field causes the appearance of EPR spectra to fundamentally change, such that the powder patterns of Fig. 2 no longer apply (Hendrich & Debrunner, 1989).
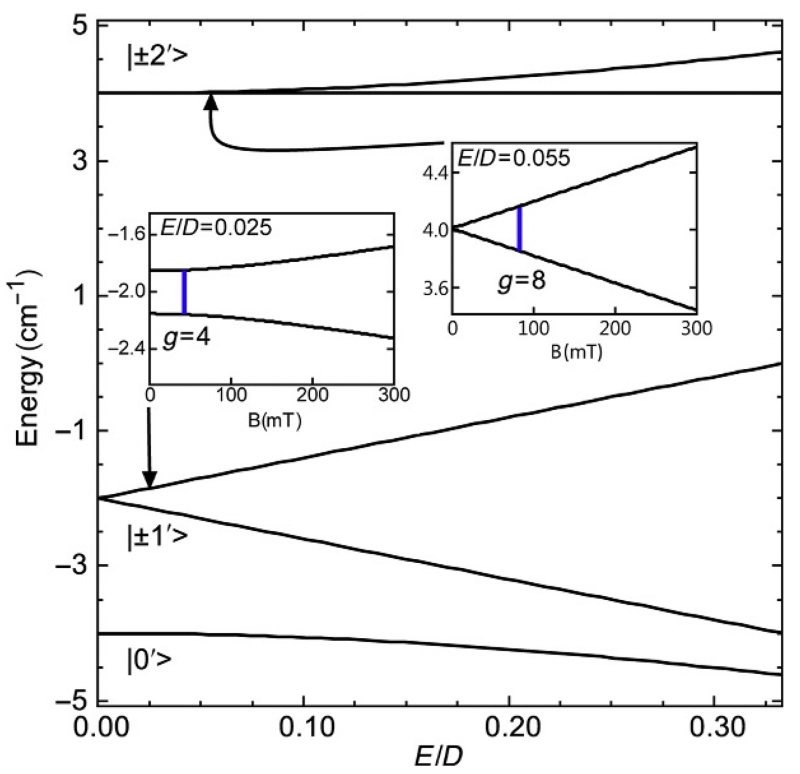
Figure 15 shows the zero-field energies of an S=2 spin system as a function of E/D for D=2 cm−1. The states |±m′> form doublets that are approximately linear combinations of states ms=|±1> or |±2> (Hendrich & Debrunner, 1989, 1998; Muenck, Surerus, & Hendrich, 1993).
| (11) |
Figure 15.
Energy as a function of E/D for an S=2 center with D=2 cm−1. The insets show the splitting of the |±1′> and |±20> doublet for E/D=0.025 and 0.055, respectively, as a function of the magnetic field along the z-axis of the molecule. The blue (dark gray in the print version) lines indicate the resonance positions for ν=9.3 GHz. The parameters are for the complex of Fig. 18.
In the presence of a magnetic field, the resonance condition for integer-spin doublets |±m′> is
| (12) |
where θ is the angle between B and the z-axis of the molecular frame defined by the D-tensor. For For E/D≠0, the |+m′> and |−m′> levels are split in zero field by an energy Δ1=6E or Δ2=3E2/D for the |±1′> and |±2′> levels, respectively. The magnetic field will split the levels of the doublet further apart and an EPR signal may be observed if Δm<hν. The inset of Fig. 15 shows the splitting of the |±1′> and |±2′> doublets (for values of E/D listed) as a function of the magnetic field.
As is evident from Eq. (11), the zero-field states |+m′> and |−m′> do not differ by ms=±1 and cannot obey the standard selection rule of Δms=±1. The appropriate selection rule for the |±m′> doublets is Δm=0. The change in the selection rule affects the polarization direction of the incident microwave magnetic field (B1) which gives the most intense EPR signals. For half-integer-spin centers, the optimal direction has the microwave field oscillating perpendicular to the static magnetic field (B1⊥B, perpendicular mode, Fig. 5), whereas for integer-spin doublets the optimal orientation has the microwave field oscillating parallel to the static magnetic field (B1∥B, parallel mode).
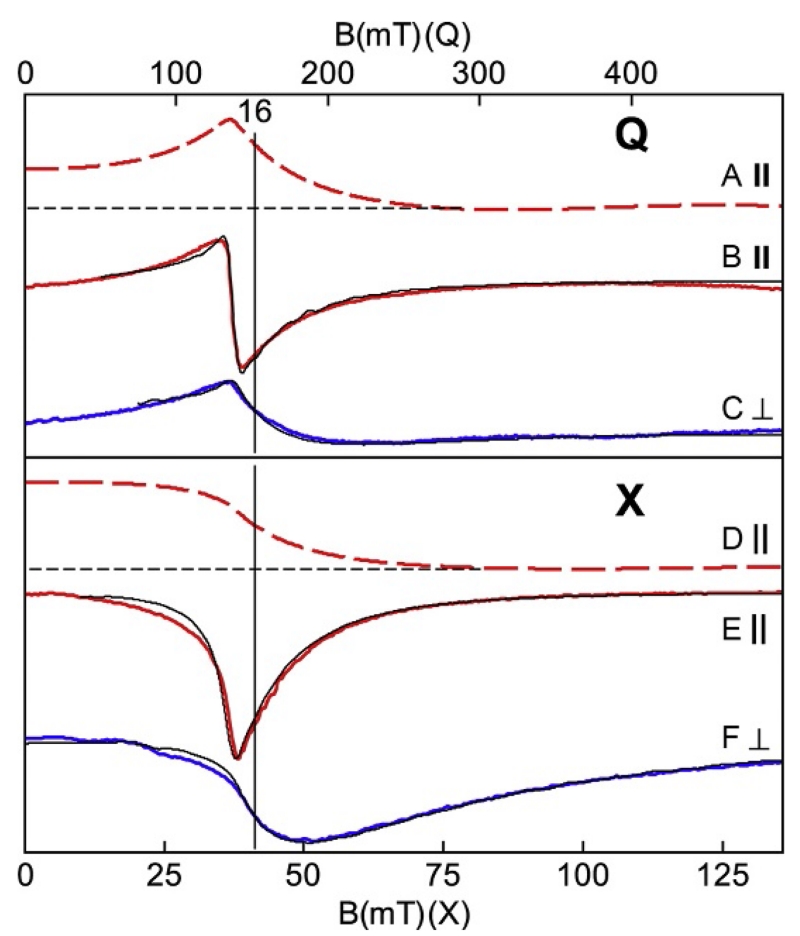
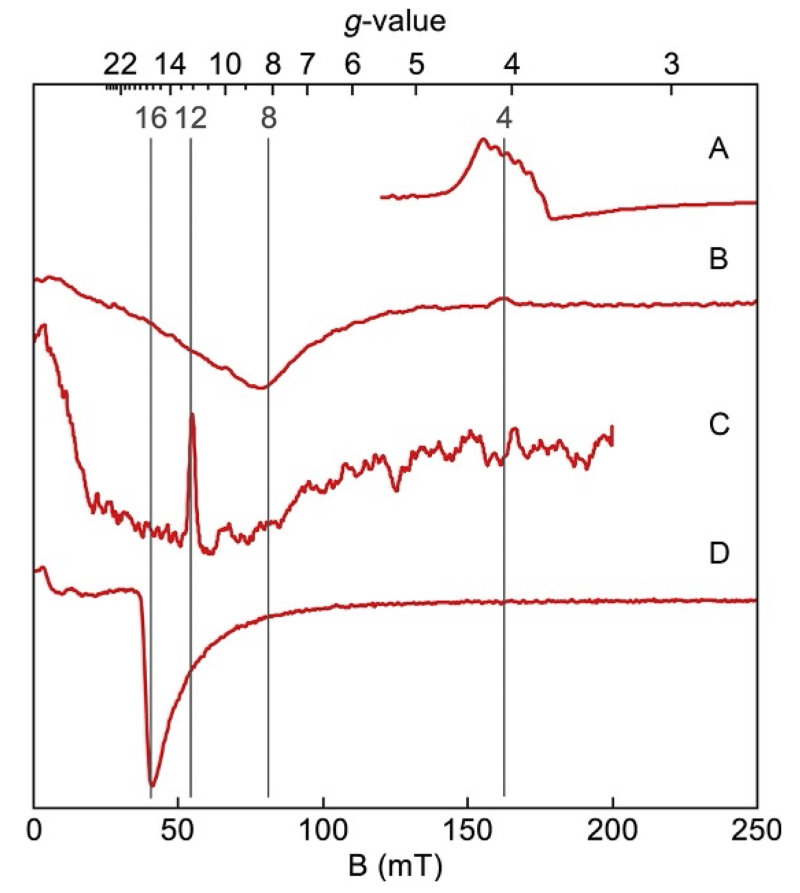
Figure 16 shows EPR spectra and simulations of the azide complex of hemerythrin (Hendrich, Pearce, Que, Chasteen, & Day, 1991; Petasis & Hendrich, 1999). The active site of the protein contains two Fe2+ ions bridged by carboxylato groups and water. The energy splitting Δ and change in selection rule result in EPR spectra that are much different in appearance than those of half-integer-spin states. Spectra of integer-spin complexes do not fall into one of the four standard types shown in Fig. 2. As shown in Fig. 16, integer-spin doublets show signals for both B1⊥B and B1∥B orientations, but the B1∥B orientation is preferred because: (1) the signals are sharper and more intense, (2) overlapping signals from half-integer-spin centers with isolated doublets are strictly forbidden, and (3) simulations are less computationally intensive. There are distinguishing features of integer-spin signals evident in the spectra of Fig. 16. Integer-spin spectra from the spectrometer (first derivative of absorption) may be dominated by a downward valley in shape and can have nonzero intensity near B=0, which is evident from the integrals displayed in Fig. 16A and D. As discussed in Section 7, the zero-field parameters of molecules in a sample have a distribution of values due to molecular disorder. The parameter Δ is dependent on the zero-field parameters and has a corresponding distribution in its values. The resonance condition (Eq. 12) is a function of Δ. For many metal centers, the distribution of Δ straddles the value of the microwave energy hν, implying that a fraction of molecules with Δ=hν will resonate at B=0. At higher microwave frequency (e.g., Q-band spectra), the distribution in Δ is now mostly less than hν; consequently, the spectrum approaches baseline for B near zero as shown in Fig. 16A. The EPR spectra are often broad owing to the combined broadening effects of the polycrystalline average and the distribution in Δ values. The transition requires a quantum of energy given by the resonance condition (Eq. 12), and thus resonances always occur at magnetic fields lower than that expected from g=2mgz by an amount related to Δ. For m=4, g=16 (gz=2), the main features of the parallel-mode signal are to be expected at magnetic fields lower than that corresponding to g=16. Figure 17 shows parallel-mode signals from a collection of proteins and complexes with increasing spin S. Typically, the doublet with highest possible value of m gives the most intense feature of the spectrum. The signals appear near to the corresponding g-value for the doublet, g=4m (assuming gz=2). It is common practice to mark EPR resonances with g-values in accordance to Eq. (5). However, marking g-values in this manner is simply a demarcation which does not carry the same physical significance because the correct resonance condition (Eq. 12) is not linear with magnetic field.
Figure 16.
X- (lower) and Q-band (upper) EPR spectra (colored traces) and simulations (black traces) of the azide complex of hemerythrin, pH 6.0. The red (gray in the print version) traces are for B1∥B and the blue (dark gray in the print version) traces are for B1⊥B. The absorption spectra (A, D) are integrations of (B, E) demonstrating presence of signal intensity at zero field. The magnetic field ranges are plotted for equal g-scale across microwave frequency. Simulations: S=4, D=2.9 cm−1, E/D=0.165, σE/D=0.11, gy=2.25. Experimental conditions: temperature, 10 K; microwaves, 2 mW at 34.073 GHz (B, C), 0.2 mW at 9.253 GHz (E), and 0.02 mW at 9.620 GHz (F).
Figure 17.
X-band parallel-mode EPR spectra from a series of complexes with increasing spin. (A) [MnVH3buea(O)], S=1 (Taguchi et al., 2012); (B) Fe2+ heme of myoglobin, S=2 (Hendrich & Debrunner, 1989); (C) P-cluster of nitrogenase, S=3 (Surerus et al., 1992); (D) (Fe2+)2 center of methane monooxygenase, S=4 (Hendrich, Munck, Fox, & Lipscomb, 1990). Temperatures, 2–11 K; microwave frequencies, 9.1–9.3 GHz.
The concentration of species for some half-integer-spin centers can be obtained from double integration of the EPR signal. This is not true for EPR spectra of integer-spin centers. The intensity of an integer-spin signal is a strong function of Δ, and the common occurrence of resonance into B=0 rules out double integration methods for determination of spin concentrations. A quantitative interpretation of integer-spin signals requires simulation. The simulations of Fig. 16 use the parameters given in the caption, and because SpinCount treats the intensity calculation quantitatively, the spin concentration of species can be determined.
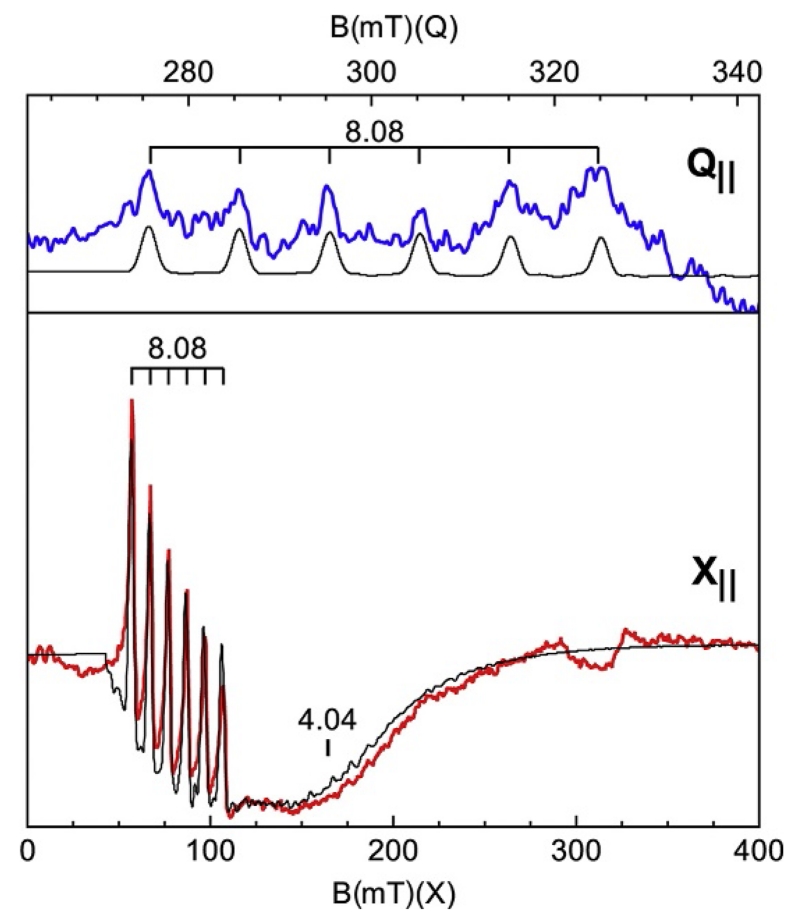
Figure 18 shows spectra and simulations of the S=2 (d4) complex [MnIIIH3buea(O)]2− for parallel field orientation (B1∥) (Gupta et al., 2015). The spectrum shows a six-line hyperfine pattern indicative of Mn at g=8.08 with a splitting of 280 MHz (10 mT). The diagram of Fig. 15 is constructed for the electronic parameters of this complex. The g=8.08 signal is from the |±2′> doublet. This signal is on top of a broad dip centered at g=4.04, which might be interpreted as a second species, possibly not from Mn since it does not show hyperfine structure. However, the simulation clearly demonstrates that the g=4.04 signal is from the |±1′> doublet of Fig. 15. The broad resonance and absence of hyperfine structure are due to the broad distribution in Δ1. The central value Δ1=6 E=0.66 cm−1 of the distribution is greater than the microwave quantum hν=0.31 cm−1. Only the fraction of molecules having Δ1<hν will generate the g=4.04 signal, which corresponds to E/D≤0.025 cm−1 (noted on Fig. 15). The parallel-mode Q-band spectrum in the g=8 region is shown in the upper panel. The simulation uses the same parameters as listed in Fig. 18 and quantitatively predicts the g=8.08 signal. The signal is weak because the intensity is proportional to , and because of the lower signal to noise typical of higher frequency spectrometers (Hendrich & Debrunner, 1989).
Figure 18.
X and Q-band parallel-mode spectra (colored traces) and simulations (black traces) of [MnIIIH3buea(O)]2− in DMF/THF. Experimental conditions: temperature, 10 K; microwaves, 20 mW at 9.298 GHz (X) and 5 mW at 33.906 (Q). Simulations: S=2, D=+2 cm−1, E/D=0.055, σE/D=0.03, gz=2.02, I=5/2, Az=280 MHz (10 mT).
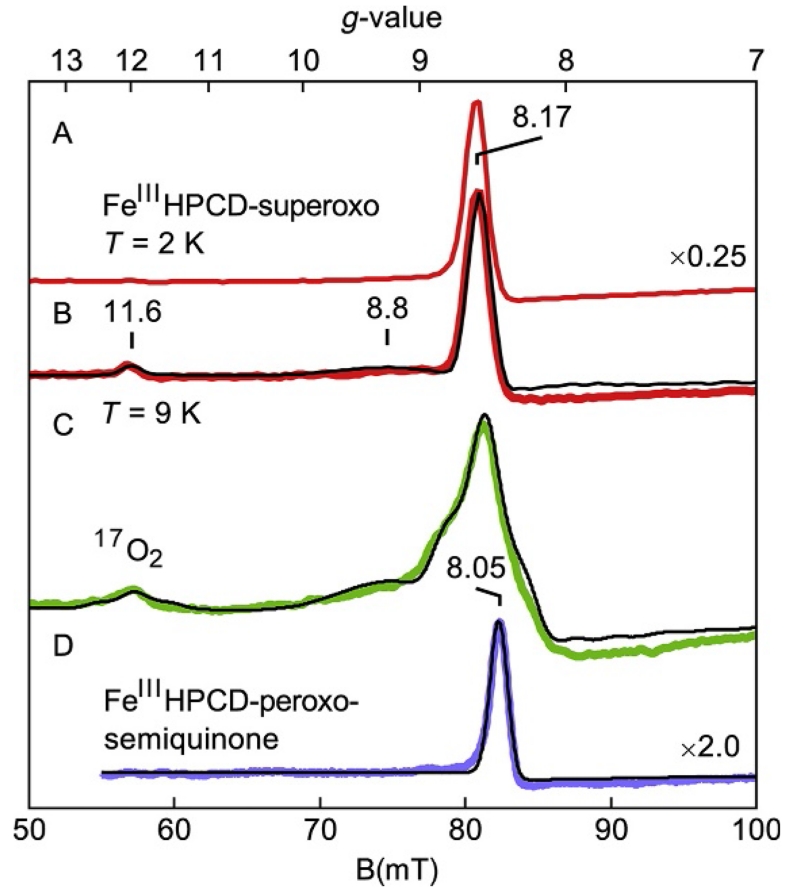
Figure 19 shows parallel-mode EPR spectra and simulations of two transient species in the reaction of FeII homoprotocatechuate dioxygenase (FeHPCD) with oxygen (Mbughuni et al., 2010). The first detectable intermediate was an FeIII-superoxo species in which the FeIII (S=5/2, d5) is antiferromagnetically coupled to an S=1/2 superoxo radical to give coupled spin states of S=2 and 3. The EPR resonance of Fig. 19A at g=8.17 is from the |±2′> doublet of the S=2 manifold. At higher sample temperatures (Fig. 19B), signals at g=11.6 and 8.8 (broad shoulder) appeared and were assigned to the |±3′> and |±2′< doublets of the excited S=3 manifold, respectively. The simulation overlaid in Fig. 19B quantitatively predicted the signal intensities for the protein concentration. Figure 19C shows the same intermediate in a sample prepared with 70% enriched 17O2 (I=5/2). It is evident that 17O broadens the spectrum considerably. The simulation of the spectrum of the 17O-enriched sample with inclusion of the hyperfine interaction with 17O determined A(17O)≈180 MHz. The large hyperfine constant was indicative of >80% radical electron density on the oxygen adduct. The spectra and simulations unambiguously established the identity of the FeIII and superoxo radical spin centers and determined the exchange interaction (J=+6 cm−1).
Figure 19.
Parallel-mode EPR spectra (colored traces) and simulations (black traces) of the FeIIHPCD-nitrocatechol complex after reaction with O2 for (A–C) 10 s and (D) 10 min. (C) Sample prepared as in (A), but with 70% enriched 17O2. Experimental conditions: temperature, 2 K (A) and 9 K (B–D); microwaves, 20 mW at 9.24 GHz. See Mbughuni et al. (2010) for simulation parameters.
The spectrum of the next detectable intermediate in the reaction is shown in Fig. 19D and was distinctly different from that of FeIII-superoxo species. The g=11.6 and 8.8 features were not present, the main signal was shifted to g=8.05, and its temperature dependence indicated that it was from an excited |±2′> doublet (the signal vanishes at 2 K). The simulation displayed in Fig. 19D is for an S=5/2 FeIII antiferromagnetically coupled to an S=1/2 radical to give a coupled spin state of S=2. An exchange constant of J=+40 cm−1 was determined from the temperature dependence of the signal. The signal was assigned to an FeIII-peroxo-semiquinone radical species. The simulation quantitatively predicted the signal intensity for the protein concentration.
10. CONCLUSION
EPR continues to be instrumental in the analysis and characterization of the active sites of metal containing proteins, enzymes, and biomimetic complexes. This chapter attempted to give a brief introduction to the theory and techniques of EPR as well as introduce the analytical capabilities of SpinCount. The complicated spectroscopy of such metal complexes frequently makes it necessary to use more than one spectroscopic technique to fully understand the particular species. Mössbauer spectroscopy is particularly important for Fe-containing complexes and gives information complementary to EPR spectroscopy. This is so important that SpinCount includes the same sophisticated ability to interpret Mössbauer spectra. With this, it is now possible to simultaneously calculate and fit both EPR and Mössbauer spectra for the same species and compare with their respective experimental spectra.
ACKNOWLEDGMENTS
Acknowledgments are made to the National Institutes of Health GM77387 and National Science Foundation CHE1126268 for the purchase of the EPR spectrometer.
REFERENCES
- Aasa R, Vänngård T. EPR signal intensity and powder shapes: A reexamination. Journal of Magnetic Resonance. 1975;19(3):308–315. http://dx.doi.org/10.1016/0022-2364(75)90045-1. [Google Scholar]
- Abragam A, Bleaney B. Electron paramagnetic resonance of transition ions. Clarendon Press; Oxford: 1970. [Google Scholar]
- Arciero DM, Pierce BS, Hendrich MP, Hooper AB. Nitrosocyanin, a red cupredoxin-like protein from Nitrosomonas europaea. Biochemistry. 2002;41(6):1703–1709. doi: 10.1021/bi015908w. [DOI] [PubMed] [Google Scholar]
- Bencini A, Gatteschi D. Electron paramagnetic resonance of exchange coupled systems. Springer-Verlag; Berlin; New York: 1990. [Google Scholar]
- Brudvig GW. Electron paramagnetic resonance spectroscopy. In: Sauer K, editor. Methods in enzymology. Vol. 246. Academic Press; New York: 1995. pp. 536–554. [DOI] [PubMed] [Google Scholar]
- Carrington A, McLachlan AD. Introduction to magnetic resonance with applications to chemistry and chemical physics. Harper & Row; New York: 1967. [Google Scholar]
- Eaton GR, Eaton SS, Salikhov KM. Foundations of modern EPR. World Scientific; Singapore: 1998. [Google Scholar]
- Gaffney BJ. EPR of mononuclear non-heme iron proteins. In: Hanson G, Berliner L, editors. Biological magnetic resononance. Vol. 28. Springer; New York: 2009. pp. 233–268. [DOI] [PMC free article] [PubMed] [Google Scholar]
- Gunderson WA, Zatsman AI, Emerson JP, Farquhar ER, Que L, Jr., Lipscomb JD, et al. Electron paramagnetic resonance detection of intermediates in the enzymatic cycle of an extradiol dioxygenase. Journal of the American Chemical Society. 2008;130(44):14465–14467. doi: 10.1021/ja8052255. http://dx.doi.org/10.1021/ja8052255. [DOI] [PMC free article] [PubMed] [Google Scholar]
- Gupta R, Fu R, Liu A, Hendrich MP. EPR and Mossbauer spectroscopy show inequivalent hemes in tryptophan dioxygenase. Journal of the American Chemical Society. 2010;132(3):1098–1109. doi: 10.1021/ja908851e. doi: PMID: 20047315. [DOI] [PMC free article] [PubMed] [Google Scholar]
- Gupta R, Lacy DC, Bominaar EL, Borovik AS, Hendrich MP. Electron paramagnetic resonance and Mossbauer spectroscopy and density functional theory analysis of a high-spin Fe(IV)-oxo complex. Journal of the American Chemical Society. 2012;134(23):9775–9784. doi: 10.1021/ja303224p. http://dx.doi.org/10.1021/ja303224p. [DOI] [PMC free article] [PubMed] [Google Scholar]
- Gupta R, Taguchi T, Lassalle-Kaiser B, Bominaar EL, Yano J, Hendrich MP, et al. High-spin Mn-oxo complexes and their relevance to the oxygen-evolving complex within photosystem II. Proceedings of the National Academy of Sciences of the United States of America. 2015;112(17):5319–5324. doi: 10.1073/pnas.1422800112. http://dx.doi.org/10.1073/pnas.1422800112. [DOI] [PMC free article] [PubMed] [Google Scholar]
- Hagen WR. Practical approaches to biological inorganic chemistry. In: Crichton RR, Louro RO, editors. EPR spectroscopy. Elsevier; Oxford: 2013. pp. 53–75. [Google Scholar]
- Hendrich MP, Debrunner PG. Integer-spin electron paramagnetic resonance of iron proteins. Biophysical Journal. 1989;56(3):489–506. doi: 10.1016/S0006-3495(89)82696-7. [DOI] [PMC free article] [PubMed] [Google Scholar]
- Hendrich MP, Debrunner PG. EPR of non-Kramers systems in biology. In: Eaton GR, Eaton SS, Salikhov KM, editors. Foundations of modern EPR. World Scientific; London: 1998. pp. 530–547. [Google Scholar]
- Hendrich MP, Munck E, Fox BG, Lipscomb JD. Integer-spin EPR studies of the fully reduced methane monooxygenase hydroxylase component. Journal of the American Chemical Society. 1990;112(15):5861–5865. [Google Scholar]
- Hendrich MP, Pearce LL, Que L, Jr., Chasteen ND, Day EP. Multifield saturation magnetization and multifrequency EPR measurements of deoxyhemerythrin azide. A unified picture. Journal of the American Chemical Society. 1991;113(8):3039–3044. [Google Scholar]
- Mbughuni MM, Chakrabarti M, Hayden JA, Bominaar EL, Hendrich MP, Münck E, et al. Trapping and spectroscopic characterization of an FeIII-superoxo intermediate from a nonheme mononuclear iron-containing enzyme. Proceedings of the National Academy of Sciences of the United States of America. 2010;107(39):16788–16793. doi: 10.1073/pnas.1010015107. doi: PMID: 20837547. [DOI] [PMC free article] [PubMed] [Google Scholar]
- Muenck E, Surerus KK, Hendrich MP. Combining Moessbauer spectroscopy with integer spin electron paramagnetic resonance. Methods in Enzymology. 1993;227:463–479. doi: 10.1016/0076-6879(93)27019-d. Metallobiochemistry, Pt. D. [DOI] [PubMed] [Google Scholar]
- Orton JW. Electron paramagnetic resonance: An introduction to transition group ions in crystals. Gordon and Breach; New York: 1969. [Google Scholar]
- Pake GE, Estle TL. The physical principles of electron paramagnetic resonance. 2nd ed. W. A. Benjamin; Reading, MA: 1973. [Google Scholar]
- Palmer G. Electron paramagnetic resonance of metalloproteins. In: Que L Jr., editor. Physical methods in bioinorganic chemistry. University Science Books; Sausalito, CA: 2000. pp. 121–185. [Google Scholar]
- Petasis DT, Hendrich MP. A new Q-band EPR probe for quantitative studies of even electron metalloproteins. Journal of Magnetic Resonance. 1999;136(2):200–206. doi: 10.1006/jmre.1998.1657. [DOI] [PubMed] [Google Scholar]
- Pilbrow JR. Transition ion electromagnetic resonance. Oxford University Press; New York: 1990. [Google Scholar]
- Poole CP. Electron spin resonance: A comprehensive treatise on experimental techniques. 2nd ed. Wiley; New York: 1983. [Google Scholar]
- Surerus KK, Hendrich MP, Christie PD, Rottgardt D, Orme-Johnson WH, Munck E. Moessbauer and integer-spin EPR of the oxidized P-clusters of nitro-genase: POX is a non-Kramers system with a nearly degenerate ground doublet. Journal of the American Chemical Society. 1992;114(22):8579–8590. [Google Scholar]
- Taguchi T, Gupta R, Lassalle-Kaiser B, Boyce DW, Yachandra VK, Tolman WB, et al. Preparation and properties of a monomeric high-spin Mn(V)-oxo complex. Journal of the American Chemical Society. 2012;134(4):1996–1999. doi: 10.1021/ja210957u. http://dx.doi.org/10.1021/ja210957u. [DOI] [PMC free article] [PubMed] [Google Scholar]
- Weil JA, Bolton JR, Wertz JE. Electron paramagnetic resonance: Elementary theory and practical applications. Wiley; New York: 1994. [Google Scholar]


