Abstract
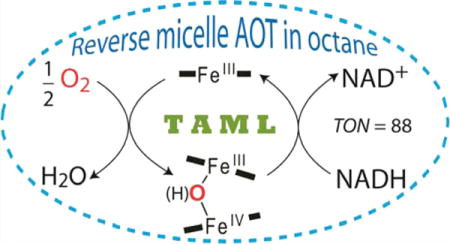
Iron TAML activators of peroxides are functional catalase-peroxidase mimics. Switching from hydrogen peroxide (H2O2) to dioxygen (O2) as the primary oxidant was achieved by using a system of reverse micelles of Aerosol OT (AOT) in n-octane. Hydrophilic TAML activators are localized in the aqueous microreactors of reverse micelles where water is present in much lower abundance than in bulk water. n-Octane serves as a proximate reservoir supplying O2 to result in partial oxidation of FeIII to FeIV-containing species, mostly the FeIIIFeIV (major) and FeIVFeIV (minor) dimers which coexist with the FeIII TAML monomeric species. The speciation depends on the pH and the degree of hydration w0, viz., the amount of water in the reverse micelles. The previously unknown FeIIIFeIV dimer has been characterized by UV–vis, EPR, and Mössbauer spectroscopies. Reactive electron donors such as NADH, pinacyanol chloride, and hydroquinone undergo the TAML-catalyzed oxidation by O2. The oxidation of NADH, studied in most detail, is much faster at the lowest degree of hydration w0 (in “drier micelles”) and is accelerated by light through NADH photochemistry. Dyes that are more resistant to oxidation than pinacyanol chloride (Orange II, Safranine O) are not oxidized in the reverse micellar media. Despite the limitation of low reactivity, the new systems highlight an encouraging step in replacing TAML peroxidase-like chemistry with more attractive dioxygen-activation chemistry.
Graphical abstract
INTRODUCTION
TAML activators of peroxides (1, Chart 1) are a family of green oxidation catalysts that function similarly to catalase-peroxidase enzymes.1–3 In the resting state, FeIII occupies the cavity of the deprotonated tetraamido macrocyclic ligand and directs the oxidative power of hydrogen peroxide (H2O2) at different targets in aqueous solution. TAML activators are similar to peroxidases mechanistically in that FeIV4 and FeV5 relatives of enzymatic compounds II and I, respectively,6 have been detected and characterized. Superior activity of TAML activators has been demonstrated for H2O2 or organic peroxides catalysis in water.7–11 While H2O2 is a desirable green oxidant, its concentrated solutions are potentially hazardous12 and it comes at a real production and delivery cost. In contrast, dioxygen (O2) is freely available and is the principal biochemical oxidizing agent. Therefore, our foremost strategic goal for TAML activator-based catalysis has been to master the use of O2 as the primary oxidant.13–15 TAML activators in the ferric state are readily oxidized by O2 in weakly coordinating organic solvents such as CH2Cl2 to produce FeIV species.16 While iron(IV) TAML activators have been shown to oxidize some substrates in organic solvents, comparably efficient catalysis to the aqueous systems has yet to be observed.2,16,17 TAML catalysis in water is characteristically conducted aerobically. Yet unless an oxidant such as hydrogen peroxide is added, no catalysis is observed, with the current suite of catalysts, bulk water appears thus far to be inimical to facile oxygen activation. Two conditions appear to be favorable for dioxygen activation. First, the TAML medium should be rich in O2: under ambient conditions, this situation is best accommodated in organic solvents. Second, water should surround TAML activators for maintaining high catalytic activity. Recent studies have shown that some, but not too much, water is important for oxidations of ferric TAMLs by organic peroxides in organic solvents.18–22 The amount of water should not be large because H2O molecules compete with O2 for coordination sites on FeIII. Hydrogen bonding and/ or polarity effects may also play some role. In bulk water, iron(III) TAML activators are six-coordinate species with two axial water ligands,23 which is consistent with the observed inactivity of oxygen activation where 55 M H2O effectively blocks O2 binding to FeIII.
Chart 1.
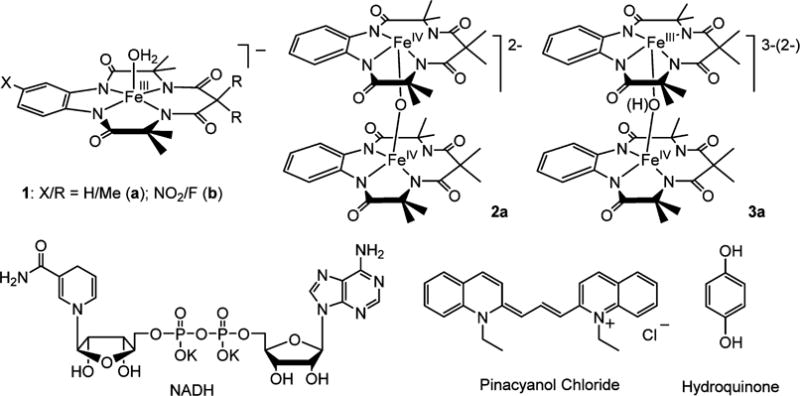
Compounds Used in This Study Including the Catalysts 1a and 1b, the Known Homovalent μ-Oxo-Bridged Iron(IV) Dimer 2a and Heterovalent μ-Oxo(hydroxo)-Bridged Iron(IV/III) Dimer 3a Characterized in This Work, and the Substrates β-Nicotinamide Adenine Dinucleotide, Reduced Dipotassium Salt (NADH), Pinacyanol Chloride (PNC), and Hydroquinone (HQ)
The two above conditions are in principle attainable using reverse micelles.24–26 Micellar media are nowadays common for catalytic applications.27 A system of reverse micelles is composed of aqueous microparticles in organic media such as n-octane (Figure 1). At the level of the individual microreactors, the micellar wall is composed of surfactant molecules; the sodium salt of bis(2-ethylhexyl) sulfosuccinate (Aerosol OT or AOT) is commonly used.28 The hydrophobic tails are directed at the bulk organic medium, whereas the hydrophilic heads comprise the encapsulating surface of the microreactor inner water cavity.26 Chemical and enzymatic catalysis in reverse micellar systems is well documented.24,25 TAML activators have excellent solubility properties for guaranteeing sequestration in reverse micellar microreactors; the n-octanol/water partition coefficient for 1a (Chart 1) is 0.036.29,30 The size of the microreactor and the water content within is determined by the degree of hydration, i.e., the water-to-surfactant molar ratio in the bulk system: w0 = [H2O]/[AOT].26 The solubility of O2 in n-octane is 1 order of magnitude higher than in water,31 and therefore TAML-containing reverse micelles will be surrounded by an O2-rich medium favorable for the oxidation of FeIII. At the same time, FeIII will be in contact with water, the amount of which is regulated by the degree of hydration w0.
Figure 1.
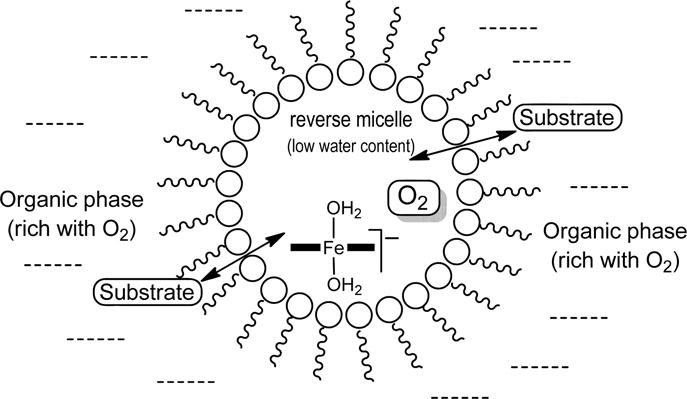
Schematic drawing of the reverse micelle incorporating TAML activators.
In this work we show that oxidative catalysis is possible for reactive electron donors using 1 in reverse micelles of AOT in n-octane in the absence of an added oxidant such as H2O2 but in the presence of ambient O2. Reverse micelles of AOT have been thoroughly investigated28 and, importantly, have often been used as media for catalysis by peroxidase enzymes,26,32 the biocatalysts closest to TAMLs.8 Here we demonstrate the following. (i) Dioxygen oxidizes 1a in the reverse micellar medium to multiple iron(IV)-containing species. (ii) These species coexist with the starting iron(III) TAML. (iii) The iron(IV) species are the earlier reported homovalent dimer FeIVFeIV 2a and the less-oxidized, previously unknown heterovalent dimer FeIIIFeIV 3a. (iv) Compound 3a in reverse micellar medium has been detected by EPR and characterized by UV–vis, EPR, and Mössbauer spectroscopies in glycerol-containing aqueous solutions at −20 °C. (v) TAML activators in this reverse micellar medium catalyze the oxidation by O2 of reactive electron donors such as the dye pinacyanol chloride, NADH, and hydroquinone (Chart 1). (vi) The oxidation of NADH is a photocatalytic process, the rate of which is directly proportional to the flash frequency. (vii) The catalytic activity of TAML activators is a function of both the degree of hydration w0 and the pH. (viii) The dyes Orange II and Safranin O, which are more resistant to oxidation than PNC, are not oxidized by O2 in this system.
EXPERIMENTAL SECTION
Materials
All reagents, components of buffer solutions, and solvents were at least ACS reagent grade (Aldrich, Fisher, Acros, Fluka) and were used as received. TAML activators 1a,b were obtained from GreenOx Catalysts, Inc.57Fe enriched 1a was synthesized as previously reported.33,34 n-Octane (99%+, Acros) was used as received. Stock solutions of 1a (0.0010 and 0.027 M) and 1b (0.0010 M) were prepared in the 0.01 M buffered aqueous solutions using phosphate for pH 8 and 12 but carbonate for pH 10; all were stored in a fridge at 4 °C. Hydroquinone (1.0 mg, Acros, 99.5%) recrystallized from acetone was dissolved in a mixture of 0.1 M AOT in n-octane (15.3 mL) and 48 μL of 0.01 M phosphate (pH 8 or 12) or carbonate (pH 10) buffer. This allowed the preparation of the 6.0 × 10⁻⁴ M solution of HQ in reverse micelles with lower w0. The solutions with larger w0 were made by adding aqueous buffer to the stock solution. Stock solutions of H2O2 were prepared from 30% H2O2, and the concentration was determined by measuring the absorption at 230 nm (ε = 72.4 M−1 cm−1).35 AOT (Aerosol OT, BioXtra 99%+, Aldrich) was either used as received or additionally purified by activated charcoal and dried in a vacuum oven for 40 h as recommended elsewhere.36 Solutions of AOT in n-octane (0.1 M) were shown to be peroxide-free using the peroxide test strips (0.5–25 ppm, EM Quant).37 The AOT solutions were also treated with aqueous KI37 and no color change due to the formation of I3− was observed. Negative peroxide tests were obtained for AOT before and after the purification. Reverse micelles of various w0 were prepared by adding a corresponding amount of the aqueous buffer of known pH to 0.1 M AOT in n-octane. For example, the sample with w0 7 and pH 8 was prepared by adding the buffer (25 μL, pH 8) to 1975 μL of 0.1 M AOT followed by vigorous shaking. Concentrations of all components reported throughout refer to the entire volume of the solution including n-octane, AOT, and buffer components.
NADH and NAD+ were purchased from Sigma-Aldrich and used as received. Their stock solutions were prepared daily using HPLC grade water. The extinction coefficients (ε) of NADH in reverse micelles were measured after adding 0.1 M AOT in n-octane to 2.0 mg NADH dissolved in 60 μL of pure water in a 5 mL volumetric flask. The ε340 values of 4760, 4980, 5070, 5130, and 5200 (all ±20) M−1 cm−1 at w0 3, 7, 10, 15, and 25, respectively, were used in kinetic measurements. Pinacyanol chloride (Aldrich) was used without further purification. Orange II (Sigma-Aldrich) was recrystallized from 1:3 H2O:EtOH. Safranin O (Acros) was used as received. Alcohol dehydrogenase from Saccharomyces cerevisiae was a Sigma-Aldrich preparation.
Methods
UV–vis measurements were performed at 25 °C in capped quartz cuvettes (1.0 cm) using either a photodiode array Agilent 8453 UV–vis spectrometer equipped with an automatic thermostated eight-cell positioner or a double beam Shimadzu UV 1800 instrument having the thermostated six-cell positioner. HPLC measurements were carried out38 using a Shimadzu Prominence 2D HPLC instrument equipped with LC-20AB binary pump (method 1) or LC-20AD quaternary pump (method 2), SIL-20A autosampler, and SPD-M20A photodiode array detector (see Supporting Information (SI) for details).
EPR and Mössbauer Measurements
Solutions of 1a (0.15 mM) in the reverse micelles as prepared above were transferred into EPR tubes and frozen by liquid nitrogen. A solution of H2O2 was added to a solution of 1a (0.5–2.0 mM) in 0.1 M phosphate buffer (pH 11.8), transferred to EPR tubes, and frozen in liquid nitrogen 30 s after the addition of H2O2. Samples at low temperature (−20 °C) were prepared in the phosphate buffer containing 50% glycerol (v/v). The temperature was lowered by keeping the solution ∼1 cm above a dry ice/acetone bath. Samples for the Mössbauer spectroscopy were prepared by adding 1 equiv of H2O2 to a 5 mM solution of 57Fe enriched 1a at −20 °C as above. When needed, the solutions were split for the Mössbauer cup and EPR studies and frozen simultaneously in liquid nitrogen 30 s after the addition of H2O2. X-band (9.66 GHz) EPR spectra were recorded on either a Bruker ESP 300 or a Bruker ELEXSYS-II E500 spectrometer equipped with an Oxford ESR-910 liquid helium cryostat. All experimental data were collected under nonsaturating microwave conditions. The quantification of signals was relative to a CuEDTA spin standard. The microwave frequency and the magnetic field were calibrated with a frequency counter and an NMR gaussmeter, respectively. The temperature was calibrated with resistors (CGR-1-1000) from LakeShore. A modulation frequency of 100 kHz and modulation amplitude of 1 mT was used for all spectra. The analysis of data utilized the standard spin Hamiltonians eqs 1 and 2, where the subscripts 3 and 4 refer to the FeIII and FeIV iron sites:
| (1) |
| (2) |
Simulations of EPR spectra of 1a use the relevant parts of eq 1 for a single spin S = 3/2, or the electronic parts of eq 1 for 3a. Mössbauer spectra were recorded using two spectrometers with an available temperature range of 1.5 to 200 K and magnetic fields up to 8.0 T. Isomer shifts are reported relative to Fe metal at 298 K. Data analysis, spin quantification, and simulations of the EPR and Mössbauer spectra were performed with the software SpinCount written by one of the authors (M.P.H.).39
RESULTS AND DISCUSSION
A Preliminary Comment on Speciation of Iron in Reverse Micelles
Chart 2 shows species that one might anticipate could coexist in the micellar media. Most of them are known. FeIIIOH2 is the starting 1a. EPR silent diamagnetic d4 species FeIVFeIV and FeIVO are made from 1a and t-BuOOH in water;4 they dominate at pH below and above 10, respectively. FeVO is produced from 1a and m-chloroperoxybenzoic acid at −40 °C in MeCN.5 The FeIII superoxo complex FeIIIO2 was made from 1a and KO2 at 5 °C in MeCN.40 By analyzing data from UV–vis, EPR, and Mössbauer spectra, we have been able to build a convincing case for the iron speciation of the reverse micellar media.
Chart 2. Iron Species That Could Coexist in the Reverse Micellesa.

aFeIIIFeIV was unknown prior to this work. Species in parentheses were obtained in MeCN.
Studies of 1a in the Reverse Micelles by UV–vis Spectroscopy
In nonprotic organic solvents, the TAML activator 1a is known to be oxidized by O2 to the FeIVFeIV dimer 2a.16 The oxidation does not occur in pure water. As introduced above, the overall water content in the system of AOT reverse micelles is much lower than in bulk water, which should increase the ratio of the O2/H2O exposure of 1a and favor its oxidation. The first evidence for such oxidation was obtained by recording the UV–vis spectra of 1a at variable pH (8–12) and degree of hydration w0 (3–25). Complex 1a does not absorb light above 600 nm. Thus, the observed buildup of broad bands in the range of 600–1100 nm in the AOT reverse micelles (Figure 2) was a reliable signal that iron(III) oxidation occurs in the presence of O2.4,16 The spectra obtained at w0 3, 7, and 25 (pH 8) vary in the 600–1100 nm range, indicating that more than one species was formed and that the selectivity depends on w0. The inset to Figure 2 shows that the species generated at w0 3 were more stable than those at w0 25.
Figure 2.
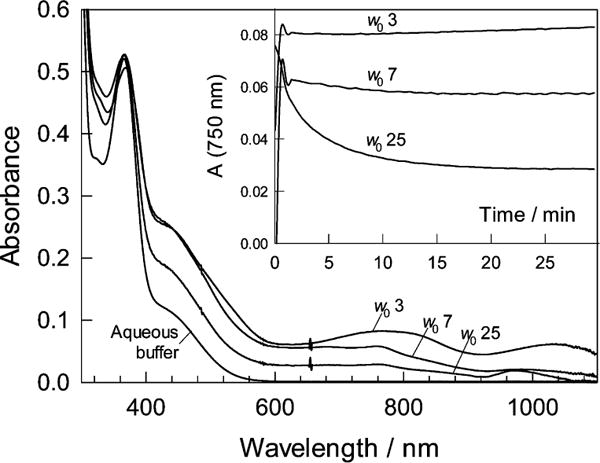
Spectra of 1a in the AOT reverse micelles in n-octane recorded 20 min after mixing all components. The spectrum of 1a in the aqueous buffer (bottom) is shown for comparison. Conditions: [1a] 1.36 × 10⁻⁴ M, pH 8, w0 = 3, 7, and 25; 25 °C. Inset shows changes of absorbance at 750 nm with time for the three different values of w0.
Spectra similar to those in Figure 2 were generated at pH 10 and 12 (see Figure S1 of SI). Oxidized iron species were produced in the AOT reverse micelles under all conditions studied but form slower at higher pH and higher w0. Figures 2 and S1 (SI) allow for most of the known complexes to date to be labeled as likely or unlikely components of the reverse micellar media as explained next. The characteristic 360 nm band of 1a was present under all studied conditions in the reverse micellar media. The species FeIVFeIV and FeIVO have been characterized previously4 as products of the reaction between 1a and t-BuOOH in water,4 dominating at pH below and above 10, respectively. Both are diamagnetic EPR silent d4 species, and their involvement in the speciation of the reverse micellar media is discussed in detail below. The UV–vis data provided evidence for the presence of FeIVFeIV in the broad bands that can be observed at 800 and 1050 nm. The FeVO complex was originally produced from 1a and m-chloroperoxybenzoic acid at −40 °C in MeCN.5 Prior experience suggests that FeVO is unlikely to be stable under the conditions used herein.18 The FeVO complex in MeCN exhibits the characteristic UV–vis peak at 630 nm; there is no identifiable equivalent in Figure 2. Similarly, FeIIIO2 made by Nam et al. from 1a and KO2 at 5 °C in MeCN was not present.40 The UV–vis spectra were ambiguous regarding the presence of mononuclear FeIVO. However, Figures 2 and S1 (SI) make it clear that one or more additional species were present, as signified by the broad bands at 440 and 760 nm; these bands are suggestive of at least one novel dimer.
EPR Spectroscopy of 1a in the Reverse Micelles
The EPR spectra of 1a (FeIIIOH2) in water23 and FeVO in MeCN5 have been characterized in earlier studies. The FeIIIFeIV species of Chart 2 was previously unknown. The remaining species of Chart 2 are EPR silent. As stated above, the generation of FeIIIO2 and FeVO from 1a and O2 is improbable. The EPR spectrum of 1a in the reverse micelles (pH 12) displayed a signal from the FeIIIOH2 S = 3/2 species (g = 4.0, 2.0)23 and a new previously unreported S = 1/2 species with g = 1.99, 2.11, 2.14 (Figure 3E). Similar EPR spectra were also recorded at pH 8 and 10 (Figure S2, SI). Spin quantification of the S = 1/2 species indicated that 15% of the initial concentration of 1a converted to the S = 1/2 species. As shown below, the new species was assigned to heterovalent FeIIIFeIV (Chart 2) or 3a (Chart 1) and was also generated from 1a and H2O2 in a buffered solution in the presence of glycerol.
Figure 3.
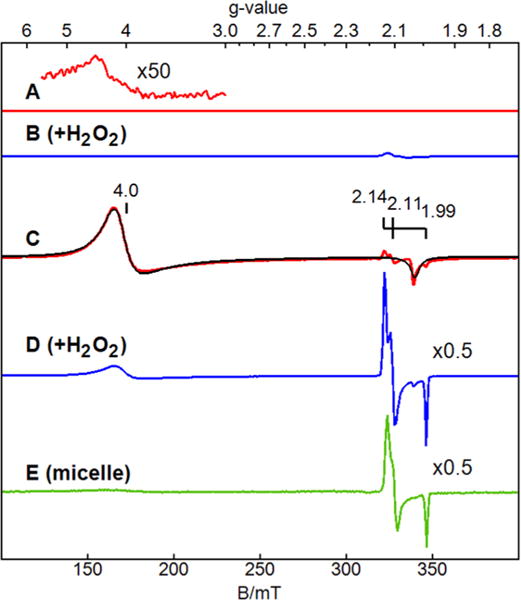
EPR spectra (ν = 9.651 GHz, T = 15 K) of 1a at pH 12 under different conditions. A: 1a; B: 1a + 1 equiv of H2O2; C: 1a in 50% glycerol; D: 1a + 1 equiv of H2O2 in 50% glycerol; E: 1a in reverse micelles (w0 10, pH 12). The spectral intensities are displayed for equal concentrations of 1a, with additional scale factors as displayed. The black line on C is a simulation for S = 3/2, D = +2.5 cm−1, E/D = 0, g = 2.045, 2.05, 2.03, σg = 0.15, 0.15, 0.02). The species percentages are stated in the text. A small variable amount (∼2%) of 3a is generated in air without H2O2, which is presumed to be reaction of 1a with low levels of dioxygen.
EPR and Mössbauer Spectroscopy of 1a with H2O2
The EPR signal of 1a (FeIIIOH2) in phosphate buffer (pH 11.8) was extremely broad (g = 4, Figure 3A) due to intermolecular interaction. The addition of 50% glycerol to the solution significantly sharpened the EPR signal (Figure 3C). The simulation in Figure 3C (black line) for a spin S = 3/2 system includes a broad distribution of g values which was indicative of some aggregation in the presence of glycerol but significantly less than without glycerol. As in the glycerol-free system,23 the temperature dependence of the signal indicates that the spectrum originates from a ground spin doublet with a positive zero-field splitting with D = +2.5(5) cm−1. The signal intensity was in quantitative agreement with the amount of iron added to the solution.
The addition of 1 equiv of H2O2 to 1a at room temperature and pH 11.8 generated a new EPR signal near g = 2 (Figure 3B) which was sharper in 50% glycerol (Figure 3D). The g values (1.992, 2.111 and 2.144) are indicative of a spin S = 1/2 system which matched the g values of the species observed in the reverse micelles without H2O2 (Figure 3E). In glycerol, the addition of H2O2 caused conversion of 60% of the initial amount of 1a into other complexes. The amount of iron that converted into the S = 1/2 species accounted for 30% of the initial iron concentration of 1a. The remainder (30% of the iron) converted to an EPR silent species, which is consistent with a previous report that peroxides convert FeIII into an EPR-silent FeIV species.4 Similar EPR samples were generated with 57Fe-enriched 1a and H2O2. Figure 4 shows an expanded scale of this species and S = 1/2 simulations. The broadening of the g = 1.992 peak (inset to Figure 4) was significant and was simulated with the addition of a hyperfine term for 57Fe (I = 1/2) with A = 18 MHz. This value was in agreement with Mössbauer results shown below indicating that the S = 1/2 species was associated with iron.
Figure 4.
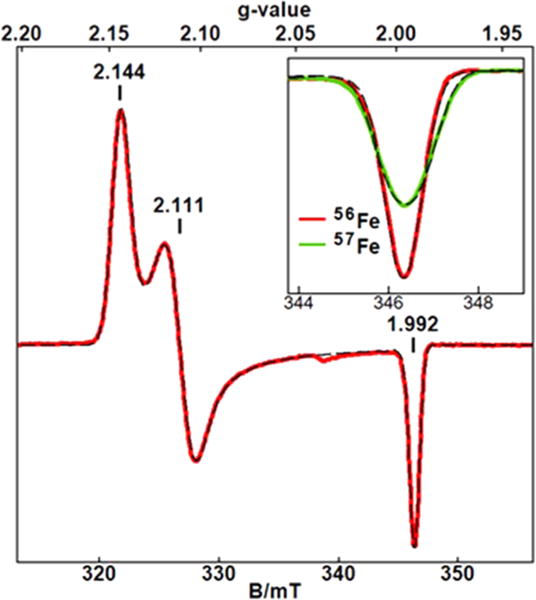
EPR spectra (red and green) of 3a under the same conditions as in Figure 3D. The inset shows an expanded view at g = 1.992 for 56Fe and enriched 57Fe samples. The dashed lines are S = 1/2 simulations with and without inclusion of a hyperfine term for I = 1/2 with A = 18 MHz.
TAML activators possess catalase-like activity8 which causes evolution of O2 due to the disproportionation of H2O2 at millimolar concentrations of 1a. Therefore, the temperature was lowered to −20 °C (dry ice/acetone bath) prior to addition of H2O2 to slow the reaction. This increased the yield of the species, giving the S = 1/2 signal which was highest in the presence of 1 equiv of H2O2 but decreased at higher amounts of H2O2. The total iron concentration determined from quantification of the S = 1/2 and S = 3/2 EPR signals was significantly lower than total amount of iron introduced. However, as the initial concentration of 1a was lowered, the percent yield of 3a increased significantly (see Figure S3 of SI). At low 1a concentration, and assuming the S = 1/2 signal is associated with a dinuclear iron complex, nearly quantitative yield of the S = 1/2 species was observed based on spin quantification. Furthermore, the Mössbauer spectra (see Figure 5 below) did not show a significant amount of mono- or dinuclear iron(IV) species under such conditions.
Figure 5.
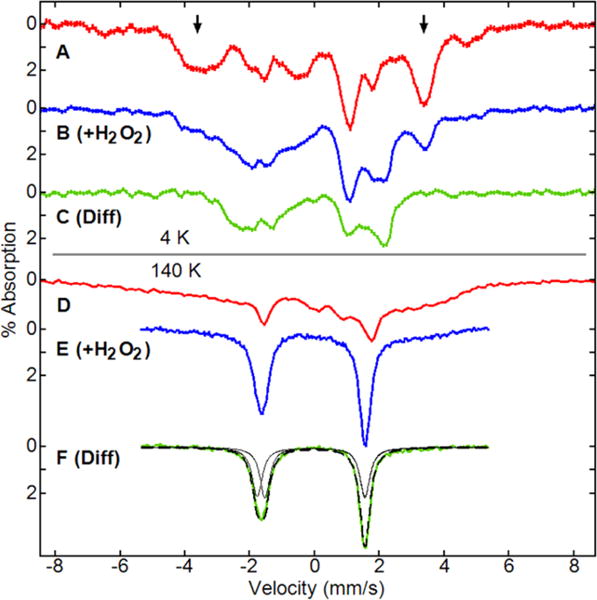
Mössbauer spectra with a parallel field of 45 mT at 4.2 K (A–C) and 140 K (D–F) of (A, D) 1a at pH 11.8 (0.1 M phosphate), 50% glycerol; (B, E) 1a + 1 equiv of H2O2, added at −20 °C; and (C, F) 3a, FeIIIFeIV. The spectra of FeIIIFeIV are subtractions of 45% of the spectra of 1a from the spectra with 1a + H2O2. At 140 K (F), the simulation (dashed line) is for two quadrupole doublets with equal area (solid black lines) with parameters given in the text.
These results indicated that the S = 1/2 species was a heterovalent FeIIIFeIV dimer. The Mössbauer data (Figure 5) confirmed the oxidation states as FeIII and FeIV. The microwave saturation of the S = 1/2 signal was measured over the temperature range of 2 to 46 K. The half-power saturation data as a function of temperature was fit to an Orbach relaxation process (see Figure S5, SI), which determined the value of the exchange interaction between the FeIII and FeIV centers, J = −30 ± 10 cm−1. There are a few characterized FeIIIFeIV centers in model compounds41–44 or proteins.45,46 The exchange interactions for all of these previously characterized complexes were significantly larger in magnitude (J < −100 cm−1). The exchange interaction for FeIVFeIV species of TAML was also large (J < −60 cm−1).4 The lower exchange value for 3a does not allow identification of a specific bridging species: the bridge could be oxo or hydroxo.
The spin quantification of 3a allowed a determination of the extinction coefficients of the UV–vis spectral characteristics at ambient conditions. The UV–vis sample was prepared by adding 1 equiv of H2O2 to 1a at pH 11.8 in 50% glycerol. The spectrum shown in Figure S4 (SI) did not change after 2 min needed for freezing EPR samples. The concentration of 3a determined from the quantification of the EPR signal was used to calculate the extinction coefficients at 760 and 930 nm of 2500 and 425 M−1 cm−1, respectively.
The 4.2 K Mössbauer spectrum of 1a enriched with 57Fe at pH 11.8 in an applied magnetic field of 45 mT displayed a quadrupole doublet with δ = 0.14(4) mm s−1 and ΔEQ = 3.97(4) mm s−1. The absence of a magnetic splitting pattern indicated that 1a was in the fast relaxation regime at 4.2 K. The Mössbauer spectrum in 50% glycerol (Figure 5A) was broad and remained broad at 140 K (Figure 5D), indicating an intermediate relaxation mode. The absence of a well resolved magnetic splitting pattern at 4.2 K was due to aggregation of 1a in the aqueous environment, which was consistent with the EPR data.
The Mössbauer spectra at 4.2 and 140 K after the addition of 1 equiv of H2O2 to 1a at pH 11.8 and −20 °C (50% glycerol) showed the partial loss of 1a and the appearance of a new species (Figure 5B,E). The spectra of the new species (Figure 5C,F) were obtained by subtracting the corresponding spectra of 1a (Figure 5A,C). The subtraction percentage (45% based on area) was determined by minimizing the features (indicated by arrows) attributed to 1a in the 4.2 K spectrum. In agreement, the EPR spectra of samples prepared from the same stock solution as the Mössbauer samples showed the S = 1/2 and S = 3/2 signals at the same percentages in iron (assuming two irons per S = 1/2 species). As shown in Figure 5F, the spectrum was fit with two doublets of equal area with parameters δ = 0.01 ± 4, ΔEQ = 3.09 ± 5 mm s−1 and δ = −0.11 ± 4, ΔEQ = 3.33 ± 5 mm s−1. These parameters could not be accurately determined from the spectra recorded at 4.2 K. The second-order Doppler correction would increase the isomer shift values by approximately +0.06 mm s−1. Previously characterized mononuclear FeIII macrocyclic complexes have δ and ΔEQ in the range of 0.12 to 0.25 mm s−1 and 3.6 to 4.19 mm s−1, respectively.47–49 The δ and ΔEQ values for similar FeIV complexes are −0.19 to −0.03 mm s−1 and 0.89 to 4.35 mm s−1, respectively.4,16,50,51 Including the correction, the isomer shifts of +0.07 mm s−1 and −0.05 mm s−1 from 3a are close to or in range of the isomer shifts from the previously characterized FeIII and FeIV complexes, respectively.
The Mössbauer spectra of 3a recorded in the magnetic fields of 0.05, 3, and 8 T are shown in Figure 6. The sample was prepared as in Figure 5, and the spectra are displayed after subtraction of 45% of the corresponding spectra of 1a (based on area). Raw spectra are shown in Figure S6, SI. The spectra were simulated using eq 1 for an antiferromagnetic exchange of J = −30 cm−1 between the FeIII and FeIV sites as determined above from EPR spectroscopy. The agreement of Mössbauer spectra with simulations indicate that the spin states of the FeIII and FeIV sites are S = 3/2 and 1, respectively. These spin states are the same as those observed for monomeric FeIII or FeIV TAML complexes characterized previously.4,23 The simulations use a set of parameters for D, E/D, and A-tensors given in the figure caption that are derived from least-squares fits of the data. The parameters set was not unique but was consistent with the spin state assignments.
Figure 6.
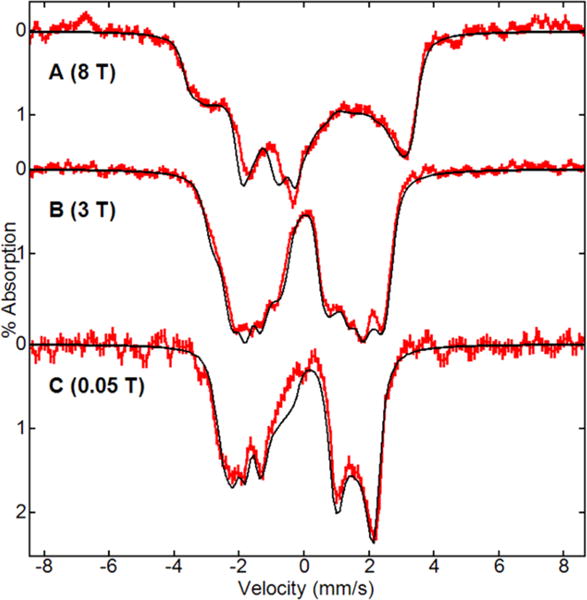
Mössbauer spectra (red lines) of 3a at pH 11.8, 50% glycerol, 1 equiv of H2O2 recorded at 4.2 K with an applied field of 8 T (A), 3 T (B), and 0.05 T (C). The spectra are after subtraction of 45% of the area the corresponding spectra of 1a. Simulations (black lines) are for FeIII and FeIV sites: J = −30 cm−1, S3 = 1.5, D3 = 3.2 cm−1, E/D3 = 0.18, A3 = (−45, −120, 55) MHz, S4 = 1, D4 = 21 cm−1, E/D4 = 0.13, A4 = (−112, −151, 110) MHz for the values of δ and ΔEQ given in the text.
Speciation of Iron in Reverse Micelles
EPR and Mössbauer studies of 1a/H2O2 in 50% glycerol allowed identification of the FeIIIFeIV (3a) species formed from 1a and O2 in the reverse micelles. The plausible coexisting species are FeIIIOH2, FeIIIFeIV, FeIVFeIV, and FeIVO (Chart 2). In water, FeIVFeIV and FeIVO exist in a pH-controlled equilibrium.4 The former dominates at pH < 10, the latter at pH > 12. It is important to note that the effective pH in the AOT reverse micelles may differ from the pH of the aqueous buffer introduced (and indicated throughout). The acidity can be higher near the interface for negatively charged surfactants.52 The effective pH is usually lower by 1–3 units in the AOT reverse micelles than in the bulk water depending on w0,53,54 though the difference may be smaller than 1 unit when w0 is high.28 Therefore, FeIVO cannot be a dominating species and probably does not form at all. The absence of the peak around 435 nm in Figures 2 and S1, which is typical of FeIVO (ε = 2500 M−1 cm−1),4 gives additional evidence. Thus, the remaining species to be considered are FeIIIOH2, FeIIIFeIV, and FeIVFeIV. The latter has a sharper band at 481 nm and a broader band at 856 nm, whereas the band at 365 nm is weaker as compared to that of FeIIIOH2. The less oxidized FeIIIFeIV has two bands at 440 and 760 nm. These bands allowed semiquantitative interpretation from the spectral data in the range of 760–930 nm where FeIIIOH2 does not absorb. The estimations were obtained using eqs 3 and 4 that connect absorbances at 760 and 930 nm to concentrations of the iron dimers using the known values of ε760 and ε930 (2500 and 425 M−1 cm−1 for FeIIIFeIV vs 4820 and 3056 M−1 cm −1 for FeIVFeIV, respectively). We assumed that the extinction coefficients were approximately independent of w0 and pH.
| (3) |
| (4) |
The amount of FeIIIOH2 shown in Figure 7 was obtained by subtracting 2 × [FeIIIFeIV] and 2 × [FeIVFeIV] from the total iron in the system. FeIIIOH2 dominates under almost all conditions tested, i.e., there is incomplete oxidation of FeIII by O2 in the reverse micellar media under the conditions studied. The more heterovalent dimer FeIIIFeIV, the major FeIV-containing material, is formed at higher pH and moderate w0, consistent with the fact that basic conditions stabilize FeIIIFeIV in aqueous glycerol. The homovalent dimer is present at low w0 and pH 8 because aprotic organic medium and this pH are both favorable for FeIVFeIV.4,16 The FeIV percentage drops at higher w0 because “wet” micelles are closer to bulk water where 1a is not oxidized by O2.16
Figure 7.
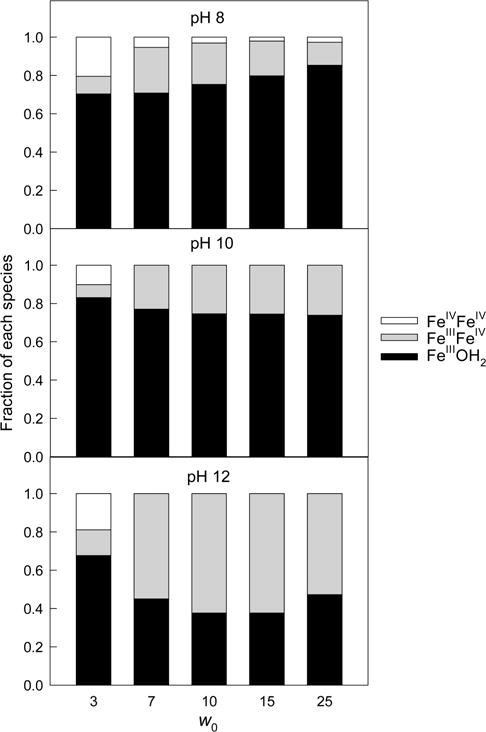
Estimated fractions of FeIIIOH2, FeIIIFeIV, and FeIVFeIV (all derived from 1a) in the AOT reverse micelles at different pH and w0. For other conditions, see caption to Figures 2 and S1 (SI).
The data in Figure 7 should be considered as qualitative because water inside reverse micelles is dissimilar to bulk water in terms of polarity, acidity, and microscopic viscosity.24,54 As a result, the environment of 1a varies with the degree of hydration w0 of the reverse micelles, and the ε values in reverse micelles and pure water may differ. Nevertheless, estimates in Figure 7 for the UV–vis data agree with the EPR results in Figures 3 and S2 (SI) because the spin quantitation gives the yields of FeIIIFeIV of 13, 33, and 37% at pH 8, 10, and 12, respectively, at w0 10 and total iron of 1.5 × 10⁻⁴ M. Thus, 1a is oxidized in the O2-rich system into FeIV species in the absence of peroxides. We will now describe the catalytic activation of O2 by 1a in these reverse micelles.
Catalytic Oxidation of NADH in Reverse Micelles
The NADH/NAD+ couple is the essence of numerous biological processes55–57 including those catalyzed by NAD+-dependent dehydrogenases, viz. enzymes that are widely used in organic synthesis.56,58 The limitations of enzymatic processes are due to the cost of NAD+,59 and therefore reliable systems for NAD+ regeneration are needed, as the current methods are still not adequately effective.60 TAMLs catalyze the oxidation of NADH by enzymatically produced H2O2 under mild conditions,61 and therefore NADH was the first choice substrate.
Smooth conversion of NADH into NAD+ catalyzed by 1a/O2 was monitored by UV–vis spectroscopy at 340 nm (maximum for NADH; NAD+ does not absorb) at w0 in the range of 3 to 25 and pH 8, 10, and 12. At pH 10 the isosbestic point holds at 286 nm (Figure 8A). Control experiments in the reverse micelles in the absence of 1a showed negligible oxidation of NADH within the same time period (Figure S7, SI). The catalytic conversion of NADH into NAD+ rather than into smaller fragments was proven by HPLC38 by comparing the elution times of the product and authentic NAD+. At pH 10 and w0 10, no NADH was observed after 9 h by UV–vis spectroscopy when the spectra were recorded every 30 s (see below for explanations). The 83% yield of NAD+ was calculated from the HPLC data. This corresponds to the turnover number (TON) of 88 and turnover frequency (TOF) of 0.003 s−1 at [1a] = 2.46 × 10⁻⁶ M and [NADH] = 2.6 × 10⁻⁴ M. The control experiment in the absence of 1a showed 67% NADH and 27% NAD+ by HPLC after 9 h. Catalyst 1a converts NADH into the “enzymatically active” NAD+. Alcohol dehydrogenase (ADH) and ethanol rapidly reduce NAD+ formed to NADH,60 and 95% NADH reappears almost instantly, much faster than the NADH oxidation (inset to Figure 8B). These results lead to the conclusion that the oxidation proceeds according to eq 5.
| (5) |
Figure 8.
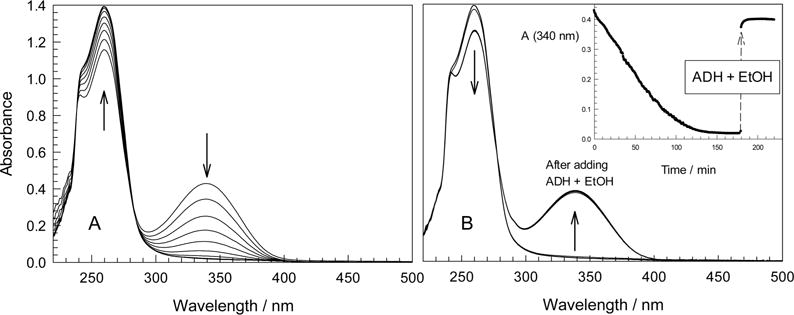
(A) Spectral changes that accompany 1a-catalyzed oxidation of NADH into NAD+ by O2 and (B) regeneration of NADH by ADH/EtOH. Time interval between spectra shown in A is 20 min (scans were made every 30 s). ADH (from Saccharomyces cerevisiae, 0.7 mg, 210 units in 50 μL water) and 10 μL of EtOH were added to the reaction mixture after 3 h followed by vigorous shaking. Inset in B illustrates the time scale of TAML-catalyzed oxidation and the enzyme-catalyzed regeneration of NADH. Conditions: 0.1 M AOT, 0.01 M carbonate (pH 10), w0 7; [1a] 2.46 × 10⁻⁶ M, [NADH] 9.9 × 10⁻⁵ M.
Whenever the catalytic reduction of O2 is being studied, it is important to be sure that adventitious oxidizing agents are not interfering with the reaction chemistry.62 A major concern is the presence of peroxidic impurities in the components of the reaction media. To rule out the possible involvement of peroxides, 1b, which is more reactive in oxidations by H2O2 in pure water than 1a,8 was used as the catalyst in the reverse micellar oxidation of NADH. Fluorinated TAMLs such as 1b react with O2 in aprotic solvents much slower than their methylated counterparts.16 The data in Figure S8 (SI) show that 1b is 5-times less reactive than 1a in the reverse micelles at pH 10 and w0 3. This establishes that adventitious peroxides are unlikely major participants. Furthermore, colorimetric testing for peroxide with KI and peroxide test strips produce no color changes.37 These results support the case that 1a does indeed launch an oxygenase-like process eq 5 in the reverse micelles and that H2O2 is not involved.
Next the ability of the iron(IV) complex 2a16 to oxidize NADH ([FeIV]:[NADH] = 1:1.05) was tested in reverse micelles in degassed media under argon to preclude or at least minimize autoxidation. The NADH absorbance around 340 nm decreased on addition of 2a, indicative of the oxidation of NADH (Figure 9). NAD+ was produced in 62 and 52% with respect to the total iron according to UV–vis and HPLC data, respectively. When ferric 1a was employed in place of 2a under otherwise identical conditions, the yield of NAD+ fell to 14% (HPLC). That any oxidation was observed at all suggested that O2 was not excluded completely by the degassing procedure. These facts support the hypothesis that NADH can be oxidized by 2a and allow us to conclude that catalyst-based oxidations are competent to produce the observed chemistry in these reaction systems where one should always be on the lookout for adventitious free radical autoxidation.
Figure 9.
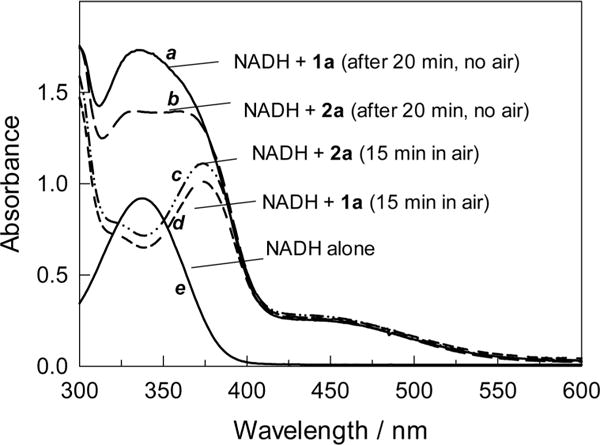
UV–vis spectra of NADH in the presence of 1a or 2a (1.5 mL methanol was added to 1.5 mL reaction mixture to quench the reaction). Conditions: w0 7, pH 12, [NADH] 2.1 × 10⁻⁴ M, [total iron] = 2.0 × 10⁻⁴ M. (a, b: spectra of NADH reacted with 1a or 2a in the absence of O2; c, d: spectra of NADH reacted with 1a or 2a after exposure to air for 15 min; e: spectrum of NADH alone).
Comparison of Initial Rates of NADH Oxidation
NADH is slowly oxidized in reverse micelles in the absence of 1a as shown in Figure S7 (SI). TAML 1a accelerates the oxidation to such extent that the spontaneous process can be neglected in many cases. Nevertheless, the initial rates shown in 3D Figure 10 were corrected for the uncatalyzed reaction in the absence of 1a. The degree of hydration w0 is a key factor that regulates the reactivity. Reaction 5 is strikingly faster in lower w0 micelles. One explanation is that water impedes the binding of O2 to the FeIII center thus slowing the catalytic rate. However, the actual concentrations of iron species and/or NADH within a microreactor will be changing with w0. The catalyst will certainly partition preferentially to the water, so concentration effects cannot be neglected and perhaps provide the dominant explanation.63 Reaction 5 is much less sensitive to pH than to w0 (Figure 10).
Figure 10.
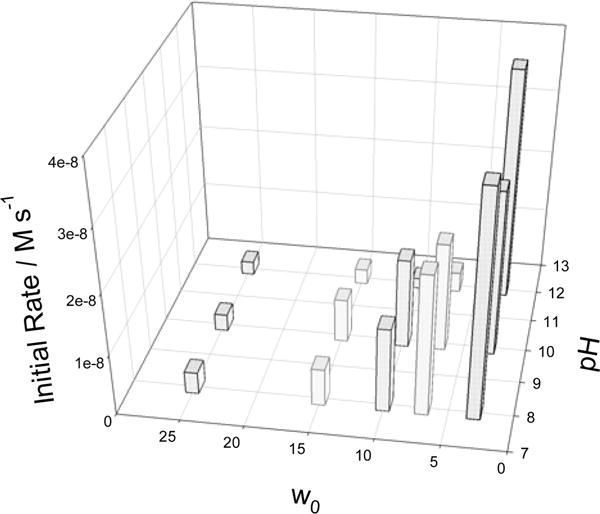
Initial rates of NADH oxidation catalyzed by 1a in reverse micelles. Conditions: [1a] 2.5 × 10⁻⁶ M, [NADH] 5.1 × 10⁻⁵ M, the flash frequency is 30 s. See text for explanations.
Effect of Light on the Catalyzed NADH Oxidation in Reverse Micelles
TAML-catalyzed reaction 5 is accelerated by light. The effect was established by changing the scanning frequency when the NADH oxidation was monitored by a photodiode array UV–vis spectrometer. The process was noticeably faster when spectra were registered more frequently, i.e., when the flash frequency (Ff = inverse time between recording (TbR) of successive spectra) was higher (Figure 11). The slowest rate was registered when reaction 5 was followed using a double beam UV–vis spectrometer, but it increased linearly with increasing flash frequency when the photodiode array instrument was used (inset to Figure 11). The straight line has an insignificant positive intercept which may reflect a dark process. A double beam spectrometer emits much less light to the sample than a photodiode array instrument which utilizes the undispersed light beam in the 190–1100 nm spectral region. Reactions susceptible to “diode array acceleration” are known and have recently been reviewed.64 The majority of these processes involve O2. The mechanisms do not involve species in long-lived excited states and are usually complex requiring individual systematic studies.
Figure 11.
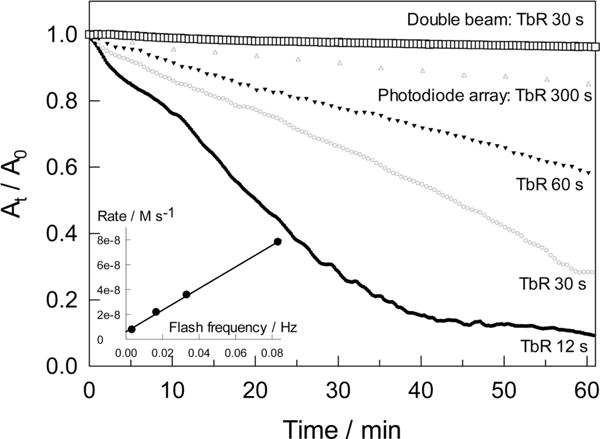
Kinetics of NADH oxidation registered by different UV–vis spectrometers applying different pulse frequencies. The top curve was obtained using a double beam instrument, and lower curves were produced using a photodiode array instrument. TbR is the time between recordings of successive spectra. Other conditions: pH 10, w0 10, [NADH] 5.14 × 10⁻⁵ M, [1a] 2.39 × 10⁻⁶ M.
The light accelerates the uncatalyzed oxidation of NADH in the reverse micelles in the absence of 1a (Figure S7, SI). Thus, the irradiation affects NADH. Experiments with pinacyanol chloride (Figure S9, SI) suggest that irradiation does not impact 1a directly. The bleaching rate of PNC was found to be practically insensitive to the flash frequency of the photodiode array spectrometer (Figure S9, SI); a minor effect is ascribed to the reported photodegradation of aggregated PNC in water,65 which is also observed in the absence of 1a (inset to Figure S9, SI). The kinetics of absorbance growth at 750 nm has been studied to probe the formation of FeIIIFeIV and/or FeIVFeIV from 1a and O2 in the reverse micelles as a function of the flash frequency at w0 15 and pH 12. Under such conditions the rates are lower and the measurements are more accurate. No light effect was registered (see Figure S10, SI), indicating that NADH is the photosensitive component of reaction 5.
Oxidation of Pinacyanol Chloride and Hydroquinone
In 1998, PNC was used to unveil the catalytic activity of 1a/H2O2.66 PNC has limited solubility in aqueous buffer at pH 12 but dissolves readily in the AOT reverse micelles. As noted above, PNC decomposes slowly in the reverse micelles without 1a (Figure S9, SI); the process is faster in water at pH 10 due to the aggregation of PNC to form a dark solid.67 The oxidation of PNC by O2 in the reverse micelles is strongly catalyzed by 1a at pH 10 (Figures 12 and S9, SI). The bleaching of PNC was investigated in some detail at w0 3, 10, and 25 and pH 8, 10, and 12 (Table S4, SI). It is rather slow at pH 8 typical of lower activity of 1a/H2O2 in water at neutral/acidic pHs.3 At pH 10, the fastest bleaching was observed at w0 10, but it slowed down in the “drier micelles” at w0 3 (Figure S11, SI). The oxidation of FeIII to FeIV and the oxidative bleaching of PNC by FeIV are affected oppositely by w0. Lower w0 values favor the former process but disfavor the latter. Under the optimal conditions (w0/pH = 10/12) in the presence of just 1% 1a, TON and TOF equal 90 and 1.6 × 10⁻³ s−1, respectively. The 1a-catalyzed oxidation of PNC by O2 in the reverse micelles is less deep than by H2O2 in water. Figure 12 shows that a decrease of the main 600 nm peak is accompanied by a buildup of a smaller peak at 350 nm, which was not observed in the aqueous solution.68
Figure 12.
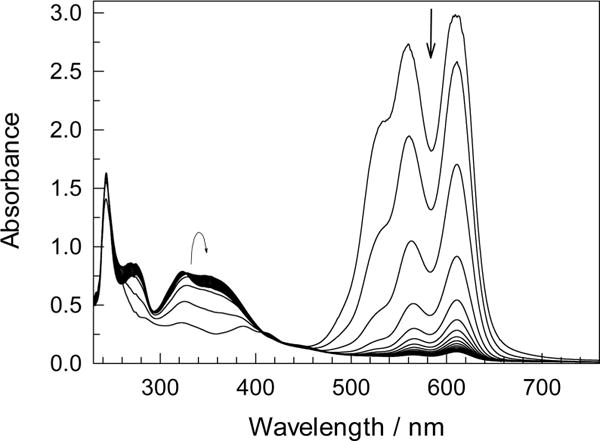
Spectral changes that accompany 1a-catalyzed oxidation of PNC by O2 in the reverse micelles. Conditions: [PNC] 4.5 × 10⁻⁵ M, [1a] 5.0 × 10⁻⁶ M, w0 10, pH 10, spectra shown with 10 min intervals.
The rapid oxidation of hydroquinone (λmax 289 nm) to 1,4-benzoquinone (λmax 247 nm)69 is conveniently studied by UV–vis spectroscopy.69 The process is very fast under basic conditions and is followed by a second oxidation step.70 The spontaneous oxidation of HQ was found to slow in the reverse micelles prepared using a tiny amount of water (w0 ∼1.6, see Experimental Section) and studied immediately after preparation. The oxidation of HQ is faster in the presence of 1a under all conditions tested. Notably, the HQ oxidation was faster in wet micelles with higher w0 (Figure S13, SI), in contrast with the oxidation of NADH, which was found to be more rapid in micelles with low w0, or PNC, which occurred most rapidly at intermediate w0. This is probably because the effective pH inside the water pools decreases with w0 to favor HQ stability. A secondary oxidation process is also visible for HQ at higher pH (pH 10 and 12, Figure S12, SI).
Limitations of Reverse Micelles as Media for TAML-Catalyzed Oxidation by O2
TAML activators catalyze the bleaching of Orange II7 and Safranin O71 dyes by H2O2 in water. These two dyes are more difficult to decolorize than PNC.68 Orange II has become widely used for assaying the catalytic activity of synthetic oxidation catalysts.7,11,30,72–74 Neither Orange II nor Safranin O were decolorized in the presence of 1a in the AOT reverse micelles even in the presence of equimolar amounts of 1a and Orange II or Safranine O in the reaction media.

On the Formation of the Heterovalent Dimer
The AOT reverse micelle microreactors have proven to be attractive and challenging media for TAML activator processes. By imposing limitations on the water content of the AOT microreactors to favor TAML interactions with O2 in the adjacent dioxygen pool, the resting ferric species is easily converted into iron(IV) derivatives that can catalytically oxidize selected electron donors. These oxidations replace H2O2 as a primary oxidant of TAML catalysis with the far more technically attractive O2. In the reverse micelles, O2 converts iron(III) TAML 1a into the heterovalent FeIIIFeIV dimer 3a via the simplified process of eq 6, assuming the μ-oxo bridged formulation. There are relatively few characterized FeIIIFeIV centers in synthetic complexes41–44,75–77 and metalloproteins,45,46,78,79 and this adds interest to the discovery of compound 3a. The reaction stoichiometry is rather unusual for iron–oxygen interactions80,81 because one O2 molecule formally requires eight iron(III) units for complete depositing its four electrons.
| (6) |
| (7) |
Equation 6 should be compared with the known process of eq 7 in which iron(III) TAML activators are rapidly oxidized by O2 in aprotic organic solvents to form the homovalent FeIVFeIV μ-oxo bridged dimer 2a.16 In this case, four iron(III) units are needed, which is of course, a more common scenario.82 Hydrogen peroxide as a 2e oxidant leads to 3a via eq 8, i.e., the iron(III) to H2O2 stoichiometry is 4:1 at pH 11.8 in 50% glycerol at lower temperatures.
| (8) |
It is intriguing that the yield of 3a produced in pure water is much lower than in the presence of glycerol; the dominant product in pure water is the homovalent dimer 2a.4 Explanations are conceivable. For example, glycerol may be more than a cosolvent83 by behaving as a reducing agent84,85 to favor the formation of the less oxidized heterovalent dimer 3a.
Reactivity Comparisons of TAML Species
The oxygenase-like activity of TAML activators in the reverse micelles established in this work is moderate; 1a/O2 does not bleach what are facile targets in water, such as Orange II, but does catalyze the mild oxidation of reactive electron donors such as NADH; enzymatically active NAD+ is produced with TON of 88. The TOF of 0.003 is, however, lower than those recently reported for O2 oxidations involving the iron(III) complex of meso-tetrakis(4-sulfonatophenyl)porphyrin (0.11 in the aqueous phosphate buffer of pH 7)86 and 1a in the presence of glucose oxidase/D-glucose (ca. 0.03 at pH 7.5).61
The lower reactivity of 1a in these reverse micelles may have advantages. Typically, TAML activators in basic water catalyze multistep, deep oxidation of organic substrates by H2O2,17 fragmenting and nearly mineralizing persistent pollutants including polychlorophenols,87 organophosphorus pesticides,88 and many others.17 Here the mild process for NADH, even with light induction, is reminiscent of cellular processes where the NAD+ is available for catalytic cycling. Thus, the activity achieved may be of use for transformations of fragile molecules by O2 that avoid destructive deep oxidation. We are further examining the potential.
The lower reactivity of TAML activators in these processes is adequately understood at a molecular level because there is a clear parallel between the reactivity and the iron oxidation state as shown in Chart 2 where the iron oxidation state in characterized TAML species increases from left to right (from 3+ to 5+); FeVO expresses a ca. 104 fold rate advantage over FeIVFeIV in organic media.18,19 Monomers FeIVO are known to be more reactive than dimers FeIVFeIV in aqueous solutions.89 Thus, the dominating speciation of iron here as the least oxidized and oxidizing FeIIIFeIV explains the observed reactivity picture.
CONCLUSIONS
By catalyzing the oxidation of NADH to NAD+ by O2 in AOT reverse micelles with a TON of 88, peroxidase-mimicking TAML activators have been shown to be capable of oxygenase-mimicry under appropriately engineered conditions. The oxygen oxidations are less aggressive than hydrogen peroxide oxidations. Nevertheless, oxygen is special, making the findings important and suggesting that more research should be carried out to explore whether or not TAML activators can function effectively using affordable molecular oxygen in a wide range of oxidation processes.
Supplementary Material
Acknowledgments
T.J.C. thanks the Heinz endowments for support of the Institute for Green Science which covered this study. M.P.H. acknowledges funding from National Institute of Health grant R01 GM077387. Funding for the EPR spectrometer is from National Science Foundation grant CHE1126268.
Footnotes
Supporting Information
Experimental details, HPLC methods, and additional results (Tables S1–S3). UV–vis data for 1a under different conditions (Figures S1, S4, S10). UV–vis analysis of substrate degradations under varied conditions in reverse micelles (Table S4, Figures S7–S9, and Figures S11–S13). EPR experimental results and simulations (Figures S2, S3, and S5). Raw Mössbauer spectra (Figure S6).The Supporting Information is available free of charge on the ACS Publications website at DOI: 10.1021/jacs.5b05229.
Notes
The authors declare no competing financial interest.
References
- 1.Collins T. J Acc Chem Res. 2002;35:782–790. doi: 10.1021/ar010079s. [DOI] [PubMed] [Google Scholar]
- 2.Collins TJ, Khetan SK, Ryabov AD. In: Handbook of Green Chemistry. Anastas PT, Crabtree RH, editors. Wiley-VCH Verlag GmbH & Co. KgaA; Weinheim: 2009. pp. 39–77. [Google Scholar]
- 3.Ryabov AD, Collins TJ. Adv Inorg Chem. 2009;61:471–521. [Google Scholar]
- 4.Chanda A, Shan X, Chakrabarti M, Ellis W, Popescu D, Tiago de Oliveira F, Wang D, Que L, Jr, Collins TJ, Münck E, Bominaar EL. Inorg Chem. 2008;47:3669–3678. doi: 10.1021/ic7022902. [DOI] [PMC free article] [PubMed] [Google Scholar]
- 5.Tiago de Oliveira F, Chanda A, Banerjee D, Shan X, Mondal S, Que L, Jr, Bominaar EL, Münck E, Collins TJ. Science. 2007;315:835–838. doi: 10.1126/science.1133417. [DOI] [PubMed] [Google Scholar]
- 6.Dunford HB. Heme Peroxidases. Wiley-VCH; New York: 1999. [Google Scholar]
- 7.Chahbane N, Popescu D-L, Mitchell DA, Chanda A, Lenoir D, Ryabov AD, Schramm K-W, Collins TJ. Green Chem. 2007;9:49–57. [Google Scholar]
- 8.Ghosh A, Mitchell DA, Chanda A, Ryabov AD, Popescu DL, Upham E, Collins GJ, Collins TJ. J Am Chem Soc. 2008;130:15116–15126. doi: 10.1021/ja8043689. [DOI] [PubMed] [Google Scholar]
- 9.Popescu D-L, Chanda A, Stadler MJ, Mondal S, Tehranchi J, Ryabov AD, Collins TJ. J Am Chem Soc. 2008;130:12260–12261. doi: 10.1021/ja805099e. [DOI] [PubMed] [Google Scholar]
- 10.Ellis WC, Tran CT, Denardo MA, Fischer A, Ryabov AD, Collins TJ. J Am Chem Soc. 2009;131:18052–18053. doi: 10.1021/ja9086837. [DOI] [PubMed] [Google Scholar]
- 11.Ellis WC, Tran CT, Roy R, Rusten M, Fischer A, Ryabov AD, Blumberg B, Collins TJ. J Am Chem Soc. 2010;132:9774–9781. doi: 10.1021/ja102524v. [DOI] [PMC free article] [PubMed] [Google Scholar]
- 12.Jones CW. Applications of hydrogen peroxide and derivatives. The Royal Society of Chemistry; Cambridge: 1999. [Google Scholar]
- 13.Stahl SS, Lippard SJ. In: Iron Metabolism. Ferreira GC, Moura JJG, Franco R, editors. Wiley-VCH; Weinheim: 1999. pp. 303–321. [Google Scholar]
- 14.Bakač A. Inorg Chem. 2010;49:3584–3593. doi: 10.1021/ic9015405. [DOI] [PubMed] [Google Scholar]
- 15.Campbell AN, Stahl SS. Acc Chem Res. 2012;45:851–863. doi: 10.1021/ar2002045. [DOI] [PMC free article] [PubMed] [Google Scholar]
- 16.Ghosh A, Tiago de Oliveira F, Yano T, Nishioka T, Beach ES, Kinoshita I, Münck E, Ryabov AD, Horwitz CP, Collins TJ. J Am Chem Soc. 2005;127:2505–2513. doi: 10.1021/ja0460458. [DOI] [PubMed] [Google Scholar]
- 17.Ryabov AD. Adv Inorg Chem. 2013;65:118–163. [Google Scholar]
- 18.Kundu S, Van Kirk Thompson J, Ryabov AD, Collins TJ. J Am Chem Soc. 2011;133:18546–18549. doi: 10.1021/ja208007w. [DOI] [PubMed] [Google Scholar]
- 19.Kundu S, Thompson JVK, Shen LQ, Mills MR, Bominaar EL, Ryabov AD, Collins TJ. Chem – Eur J. 2015;21:1803–1810. doi: 10.1002/chem.201405024. [DOI] [PubMed] [Google Scholar]
- 20.Ghosh M, Singh KK, Panda C, Weitz A, Hendrich MP, Collins TJ, Dhar BB, Sen Gupta S. J Am Chem Soc. 2014;136:9524–9527. doi: 10.1021/ja412537m. [DOI] [PMC free article] [PubMed] [Google Scholar]
- 21.Panda C, Debgupta J, Diaz Diaz D, Singh KK, Sen Gupta S, Dhar BB. J Am Chem Soc. 2014;136:12273–12282. doi: 10.1021/ja503753k. [DOI] [PubMed] [Google Scholar]
- 22.Kwon E, Cho K-B, Hong S, Nam W. Chem Commun. 2014;50:5572–5575. doi: 10.1039/c4cc01058b. [DOI] [PubMed] [Google Scholar]
- 23.Ghosh A, Ryabov AD, Mayer SM, Horner DC, Prasuhn DE, Jr, Sen Gupta S, Vuocolo L, Culver C, Hendrich MP, Rickard CEF, Norman RE, Horwitz CP, Collins TJ. J Am Chem Soc. 2003;125:12378–12378. doi: 10.1021/ja0367344. [DOI] [PubMed] [Google Scholar]
- 24.Fendler JH. Acc Chem Res. 1976;9:153–61. [Google Scholar]
- 25.Pileni MP. J Phys Chem. 1993;97:6961–73. [Google Scholar]
- 26.Levashov AV, Klyachko NL, editors. Enzymes in reverse micelles (microemulsions): Theory and practice. Marcel Dekker Inc; New York: 2003. [Google Scholar]
- 27.La Sorella G, Strukul G, Scarso A. Green Chem. 2015;17:644–683. [Google Scholar]
- 28.De TK, Maitra A. Adv Colloid Interface Sci. 1995;59:95–193. [Google Scholar]
- 29.Stadler MJ. Ph.D. Thesis. Carnegie Mellon University; Pittsburgh, PA: 2007. [Google Scholar]
- 30.Banerjee D, Apollo FM, Ryabov AD, Collins TJ. Chem -Eur J. 2009;15:10199–10209. doi: 10.1002/chem.200900729. [DOI] [PubMed] [Google Scholar]
- 31.Battino R, Rettich TR, Tominaga T. J Phys Chem Ref Data. 1983;12:163–178. [Google Scholar]
- 32.Biasutti MA, Abuin EB, Silber JJ, Correa NM, Lissi EA. Adv Colloid Interface Sci. 2008;136:1–24. doi: 10.1016/j.cis.2007.07.001. [DOI] [PubMed] [Google Scholar]
- 33.Ellis WC. Ph.D. Thesis. Carnegie Mellon University; Pittsburgh, PA: 2010. [Google Scholar]
- 34.Ghosh A. Ph D Thesis. Carnegie Mellon University; Pittsburgh, PA: 2004. [Google Scholar]
- 35.George P. Biochem J. 1953;54:267–276. doi: 10.1042/bj0540267. [DOI] [PMC free article] [PubMed] [Google Scholar]
- 36.Menger FM, Yamada K. J Am Chem Soc. 1979;101:6731–6734. [Google Scholar]
- 37.Carroll WFJ, Foster BL, Barkley WE, Cook SH, Fivizzani KP, Izzo R, Jacobson KA, Maupins K, Moloy K, Ogle RB, Palassis J, Phifer RW, Reinhardt PA, Thompson LT, Winfield L. Prudent Practices in the Laboratory. The National Academies Press; Washington, D.C.: 2011. [Google Scholar]
- 38.Markham KA, Kohen A. Curr Anal Chem. 2006;2:379–388. [Google Scholar]
- 39.Petasis DT, Hendrich MP. In: Quantitative interpretation of EPR spectroscopy with applications for iron-sulfur proteins. Rouault TA, editor. De Gruyter; Berlin: 2014. pp. 21–48. [Google Scholar]
- 40.Hong S, Sutherlin KD, Park J, Kwon E, Siegler MA, Solomon EI, Nam W. Nat Commun. 2014;5:5440. doi: 10.1038/ncomms6440. [DOI] [PMC free article] [PubMed] [Google Scholar]
- 41.Dong Y, Que L, Jr, Kauffmann K, Münck E. J Am Chem Soc. 1995;117:11377–11378. [Google Scholar]
- 42.Lee D, Du Bois J, Petasis D, Hendrich MP, Krebs C, Huynh BH, Lippard SJ. J Am Chem Soc. 1999;121:9893–9894. [Google Scholar]
- 43.Lee D, Pierce B, Krebs C, Hendrich MP, Huynh BH, Lippard SJ. J Am Chem Soc. 2002;124:3993–4007. doi: 10.1021/ja012251t. [DOI] [PubMed] [Google Scholar]
- 44.Slep LD, Mijovilovich A, Meyer-Klaucke W, Weyhermueller T, Bill E, Bothe E, Neese F, Wieghardt K. J Am Chem Soc. 2003;125:15554–15570. doi: 10.1021/ja030377f. [DOI] [PubMed] [Google Scholar]
- 45.Sturgeon BE, Burdi D, Chen S, Huynh B-H, Edmondson DE, Stubbe J, Hoffman BM. J Am Chem Soc. 1996;118:7551–7557. [Google Scholar]
- 46.Valentine AM, Tavares P, Pereira AS, Davydov R, Krebs C, Hoffman BM, Edmondson DE, Huynh BH, Lippard SJ. J Am Chem Soc. 1998;120:2190–2191. [Google Scholar]
- 47.Kostka KL, Fox BG, Hendrich MP, Collins TJ, Rickard CEF, Wright LJ, Münck E. J Am Chem Soc. 1993;115:6746–6757. [Google Scholar]
- 48.Bartos MJ, Kidwell C, Kauffmann KE, Gordon-Wylie SW, Collins TJ, Clark GC, Münck E, Weintraub ST. Angew Chem, Int Ed Engl. 1995;34:1216–19. [Google Scholar]
- 49.Bartos MJ, Gordon-Wylie SW, Fox BG, Wright LJ, Weintraub ST, Kauffmann KE, Münck E, Kostka KL, Uffelman ES, Rickard CEF, Noon KR, Collins TJ. Coord Chem Rev. 1998;174:361–390. [Google Scholar]
- 50.Collins TJ, Kostka KL, Münck E, Uffelman ES. J Am Chem Soc. 1990;112:5637–5639. [Google Scholar]
- 51.Collins TJ, Fox BG, Hu ZG, Kostka KL, Münck E, Rickard CEF, Wright LJ. J Am Chem Soc. 1992;114:8724–5. [Google Scholar]
- 52.Biasutti MA, Abuin EB, Silber JJ, Correa NM, Lissi EA. Adv Colloid Interface Sci. 2008;136:1–24. doi: 10.1016/j.cis.2007.07.001. [DOI] [PubMed] [Google Scholar]
- 53.Grandi C, Smith RE, Luisi PL. J Biol Chem. 1981;256:837–843. [PubMed] [Google Scholar]
- 54.Shield JW, Ferguson HD, Bommarius AS, Hatton TA. Ind Eng Chem Fundam. 1986;25:603–612. [Google Scholar]
- 55.Pollak N, Dolle C, Ziegler M. Biochem J. 2007;402:205–218. doi: 10.1042/BJ20061638. [DOI] [PMC free article] [PubMed] [Google Scholar]
- 56.Gamenara D, Seoane G, Saenz-Méndez P, Domínguez de María P. Redox Biocatalysis: Fundamentals and Applications. Wiley; Hoboken, NJ: 2013. [Google Scholar]
- 57.Uppada V, Bhaduri S, Noronha SB. Curr Sci. 2014;106:946–957. [Google Scholar]
- 58.Weckbecker A, Groger H, Hummel W. Adv Biochem Eng /Biotechnol. 2010;120:195–242. doi: 10.1007/10_2009_55. [DOI] [PubMed] [Google Scholar]
- 59.Wichmann R, Vasic-Racki D. Adv Biochem Eng /Biotechnol. 2005;92:225–260. doi: 10.1007/b98911. [DOI] [PubMed] [Google Scholar]
- 60.Golub E, Freeman R, Willner I. Angew Chem, Int Ed. 2011;50:11710–11714. doi: 10.1002/anie.201103853. [DOI] [PubMed] [Google Scholar]
- 61.Miller JA, Alexander L, Mori DI, Ryabov AD, Collins TJ. New J Chem. 2013;37:3488–3495. [Google Scholar]
- 62.Scheeline A, Olson DL, Williksen EP, Horras GA, Klein ML, Larter R. Chem Rev. 1997;97:739–756. doi: 10.1021/cr960081a. [DOI] [PubMed] [Google Scholar]
- 63.Berezin IV, Martinek K, Yatsimirskii AK. Russ Chem Rev. 1973;42:1729–1756. [Google Scholar]
- 64.Fabian I, Lente G. Pure Appl Chem. 2010;82:1957–1973. [Google Scholar]
- 65.Byers GW, Gross S, Henrichs PM. Photochem Photobiol. 1976;23:37–43. doi: 10.1111/j.1751-1097.1976.tb06768.x. [DOI] [PubMed] [Google Scholar]
- 66.Horwitz CP, Fooksman DR, Vuocolo LD, Gordon-Wylie SW, Cox NJ, Collins TJ. J Am Chem Soc. 1998;120:4867–4868. [Google Scholar]
- 67.Khouri SJ, Buss V. J Solution Chem. 2010;39:121–130. [Google Scholar]
- 68.Mitchell DA, Ryabov AD, Kundu S, Chanda A, Collins TJ. J Coord Chem. 2010;63:2605–2618. [Google Scholar]
- 69.Li YB, Trush MA. Arch Biochem Biophys. 1993;300:346–355. doi: 10.1006/abbi.1993.1047. [DOI] [PubMed] [Google Scholar]
- 70.James TH, Snell JM, Weissberger A. J Am Chem Soc. 1938;60:2084–2093. [Google Scholar]
- 71.Chanda A, Ryabov AD, Mondal S, Alexandrova L, Ghosh A, Hangun-Balkir Y, Horwitz CP, Collins TJ. Chem – Eur J. 2006;12:9336–9345. doi: 10.1002/chem.200600630. [DOI] [PubMed] [Google Scholar]
- 72.Theodoridis A, Maigut J, Puchta R, Kudrik EV, Van Eldik R. Inorg Chem. 2008;47:2994–3013. doi: 10.1021/ic702041g. [DOI] [PubMed] [Google Scholar]
- 73.Ember E, Rothbart S, Puchta R, van Eldik R. New J Chem. 2009;33:34–49. [Google Scholar]
- 74.Rothbart S, Ember EE, van Eldik R. New J Chem. 2012;36:732–748. [Google Scholar]
- 75.Voronkova VK, Mrozinski J, Yampol’skaya MA, Yablokov YV, Evtushenko NS, Byrke MS, Gerbeleu NV. Inorg Chim Acta. 1995;238:139–147. [Google Scholar]
- 76.Korendovych IV, Kryatov SV, Rybak-Akimova EV. Acc Chem Res. 2007;40:510–21. doi: 10.1021/ar600041x. [DOI] [PubMed] [Google Scholar]
- 77.Goure E, Avenier F, Dubourdeaux P, Seneque O, Albrieux F, Lebrun C, Clemancey M, Maldivi P, Latour J-M. Angew Chem, Int Ed. 2014;53:1580–4. doi: 10.1002/anie.201307429. [DOI] [PubMed] [Google Scholar]
- 78.Voevodskaya N, Galander M, Hogbom M, Stenmark P, McClarty G, Graslund A, Lendzian F. Biochim Biophys Acta, Proteins Proteomics. 2007;1774:1254–1263. doi: 10.1016/j.bbapap.2007.07.001. [DOI] [PubMed] [Google Scholar]
- 79.Voevodskaya N, Lendzian F, Graslund A. Biochem Biophys Res Commun. 2005;330:1213–1216. doi: 10.1016/j.bbrc.2005.03.104. [DOI] [PubMed] [Google Scholar]
- 80.Bertini I, Gray HB, Lippard SJ, Valentine JS. Bioinorganic Chemistry. University Science Books; Mill Valley, CA: 1994. [Google Scholar]
- 81.Bertini I, Gray HB, Stiefel EI, Valentine JS. Biological Inorganic Chemistry Structure and Reactivity. University Science Books; Sausalito, CA: 2007. [Google Scholar]
- 82.Kryatov SV, Rybak-Akimova EV, Schindler S. Chem Rev. 2005;105:2175–2226. doi: 10.1021/cr030709z. [DOI] [PubMed] [Google Scholar]
- 83.Chahdoura F, Favier I, Gómez M. Chem – Eur J. 2014;20:10884–10893. doi: 10.1002/chem.201403534. [DOI] [PubMed] [Google Scholar]
- 84.Mandelli D, Carvalho WA, Shul’pina LS, Kirillov AM, Kirillova MV, Pombeiro AJL, Shul’pin GB. Adv Organomet Chem Catal. 2014:247–257. [Google Scholar]
- 85.Katryniok B, Kimura H, Skrzynska E, Girardon J-S, Fongarland P, Capron M, Ducoulombier R, Mimura N, Paul S, Dumeignil F. Green Chem. 2011;13:1960–1979. [Google Scholar]
- 86.Maid H, Böhm P, Huber SM, Bauer W, Hummel W, Jux N, Gröger H. Angew Chem, Int Ed. 2011;50(2397–2400):2397–2400. doi: 10.1002/anie.201004101. [DOI] [PubMed] [Google Scholar]
- 87.Gupta SS, Stadler M, Noser CA, Ghosh A, Steinhoff B, Lenoir D, Horwitz CP, Schramm K-W, Collins TJ. Science. 2002;296:326–328. doi: 10.1126/science.1069297. [DOI] [PubMed] [Google Scholar]
- 88.Chanda A, Khetan SK, Banerjee D, Ghosh A, Collins TJ. J Am Chem Soc. 2006;128:12058–12059. doi: 10.1021/ja064017e. [DOI] [PubMed] [Google Scholar]
- 89.Banerjee D, Ryabov AD, Collins TJ. J Coord Chem. 2015:68. doi: 10.1080/00958972.2015.1065974. [DOI] [Google Scholar]
Associated Data
This section collects any data citations, data availability statements, or supplementary materials included in this article.


