Abstract
Flow cytometric analysis is a recommended tool in the diagnosis of myelodysplastic syndromes. Current flow cytometric approaches evaluate the (im)mature myelo-/monocytic lineage with a median sensitivity and specificity of ~71% and ~93%, respectively. We hypothesized that the addition of erythroid lineage analysis could increase the sensitivity of flow cytometry. Hereto, we validated the analysis of erythroid lineage parameters recommended by the International/European LeukemiaNet Working Group for Flow Cytometry in Myelodysplastic Syndromes, and incorporated this evaluation in currently applied flow cytometric models. One hundred and sixty-seven bone marrow aspirates were analyzed; 106 patients with myelodysplastic syndromes, and 61 cytopenic controls. There was a strong correlation between presence of erythroid aberrancies assessed by flow cytometry and the diagnosis of myelodysplastic syndromes when validating the previously described erythroid evaluation. Furthermore, addition of erythroid aberrancies to two different flow cytometric models led to an increased sensitivity in detecting myelodysplastic syndromes: from 74% to 86% for the addition to the diagnostic score designed by Ogata and colleagues, and from 69% to 80% for the addition to the integrated flow cytometric score for myelodysplastic syndromes, designed by our group. In both models the specificity was unaffected. The high sensitivity and specificity of flow cytometry in the detection of myelodysplastic syndromes illustrates the important value of flow cytometry in a standardized diagnostic approach. The trial is registered at www.trialregister.nl as NTR1825; EudraCT n.: 2008-002195-10
Introduction
Myelodysplastic syndromes (MDS) are a heterogeneous group of clonal hematopoietic disorders characterized by cytopenia(s) and risk of leukemic transformation.1 Multi-parameter flow cytometric (FC) analysis is a recommended tool to support the diagnosis of MDS, which is based on dysplastic features by cytomorphology and typical cytogenetic abnormalities.2 The International/European LeukemiaNet Working Group for Flow Cytometry in MDS (IMDS-flow) provided recommendations on how to process and analyze bone marrow aspirates of patients with unexplained cytopenias suspected of MDS.3,4 Analytic methods have been developed and validated for characterization and quantification of dysplasia and enable accurate diagnosis of MDS.5–12 The most straightforward is a four-parametric diagnostic score that integrates percentage of CD34-positive myeloid progenitors, percentage of B-cell progenitors within the CD34-positive compartment, CD45 expression level of CD34-positive myeloid progenitors (related to CD45 expression level on lymphocytes), and sideward light scatter peak channel value (SSC) of granulocytic cells (related to SSC of lymphocytes). This diagnostic score has a sensitivity and specificity of 69% and 92%, respectively, in low-intermediate risk MDS.13,14 More elaborate scores can reach specificities of up to 100%; this, however, is accompanied by lower sensitivities.15 In accordance with recommendations issued by the IMDS-flow, our group designed and validated an integrated MDS-FC score (iFS).16 The iFS comprises the diagnostic score and evaluation of frequently described aberrant expression levels of lineage defining markers and presence of lineage infidelity markers on (im)mature myelo-/monocytic cells. Sensitivity and specificity of the iFS within a large cohort of patients with persistent cytopenias of unknown origin were 63% and 98%, respectively.17 The lower sensitivity in this and other reports can be explained by the fact that most MDS-FC approaches only evaluate the myeloid cell compartment. Since dyserythropoiesis is the most prevalent feature by cytomorphology in MDS, the addition of in-depth evaluation of the erythroid compartment is expected to improve sensitivity.18 MDS patients with erythroid dysplasia, but without dysmyelopoiesis, may then be identified by FC.
For evaluation of the erythroid compartment, different antibody combinations of CD45, CD235a, CD71, CD36, CD105, and intracellular markers such as cytosolic H-ferritin, cytosolic L-ferritin and mitochondrial ferritin have been described.19–22 The IMDS-flow group recently proposed guidelines for erythroid evaluation, advising the evaluation of CD36 coefficient of variation (CV), CD71 CV and mean fluorescence intensity (MFI), and percentage of progenitors (CD117 positive within CD45 negative-diminished cell fraction) within the erythroid compartment. Sensitivity and specificity of this marker combination for the detection of MDS-associated erythroid aberrancies were 35% and 90%, respectively. The current study aimed to validate these erythroid parameters in an independent cohort of patients diagnosed with MDS treated within a prospective clinical study and in a reference group of patients with proven non-clonal cytopenias. Furthermore, the additive value of erythroid evaluation to currently applied MDS-FC diagnostic approaches was explored.
Methods
Patients
A well-defined MDS group and cytopenic control group were assembled between May 2009 and July 2014 (Table 1). The MDS group consisted of patients enrolled in the HOVON89 study. Bone marrow aspirates for FC analysis were taken prior to inclusion, and MDS was diagnosed in accordance with the minimum diagnostic criteria established by the WHO 2001 criteria.23 The definition of non-clonal cytopenias was based on clinical characteristics, cytomorphology, cytogenetic and biochemical indicators. The median age of the MDS group was 71 (range 38–85). The median age of the control group was 65 (range 23–91). The research program was approved by the local ethics committee, and all patient-related research strictly abided by the Declaration of Helsinki.
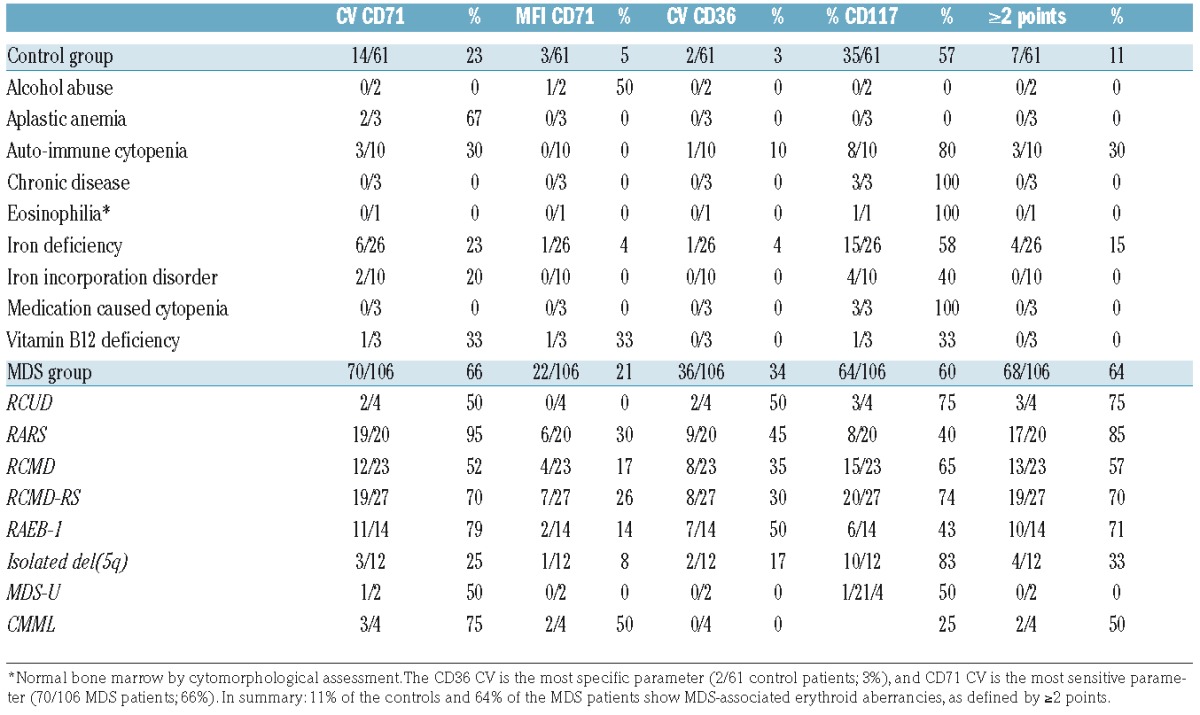
Table 1.
Erythroid markers that comprise the IMDS-Flow erythroid FC score and the cumulative score, stratified by patient group.
Sample preparation, antibody combinations, and cell acquisition
Sample processing was performed according to ELN guidelines for FC within 24 hours.15 A 4-color analysis was performed from 2009–2012, and an 8-color analysis from 2012–2014. The staining panels are outlined in the Online Supplementary Table S1. At least 100,000 CD45-positive events were acquired using a FACSCalibur™ or FACSCantoII™ (BD Biosciences, San Jose, CA, USA). Cells were analyzed using Cell QuestPro (BD Biosciences) or Infinicyt software (Cytognos, Salamanca, Spain), respectively. Gating was performed as previously described.15,24
MDS-FC scores
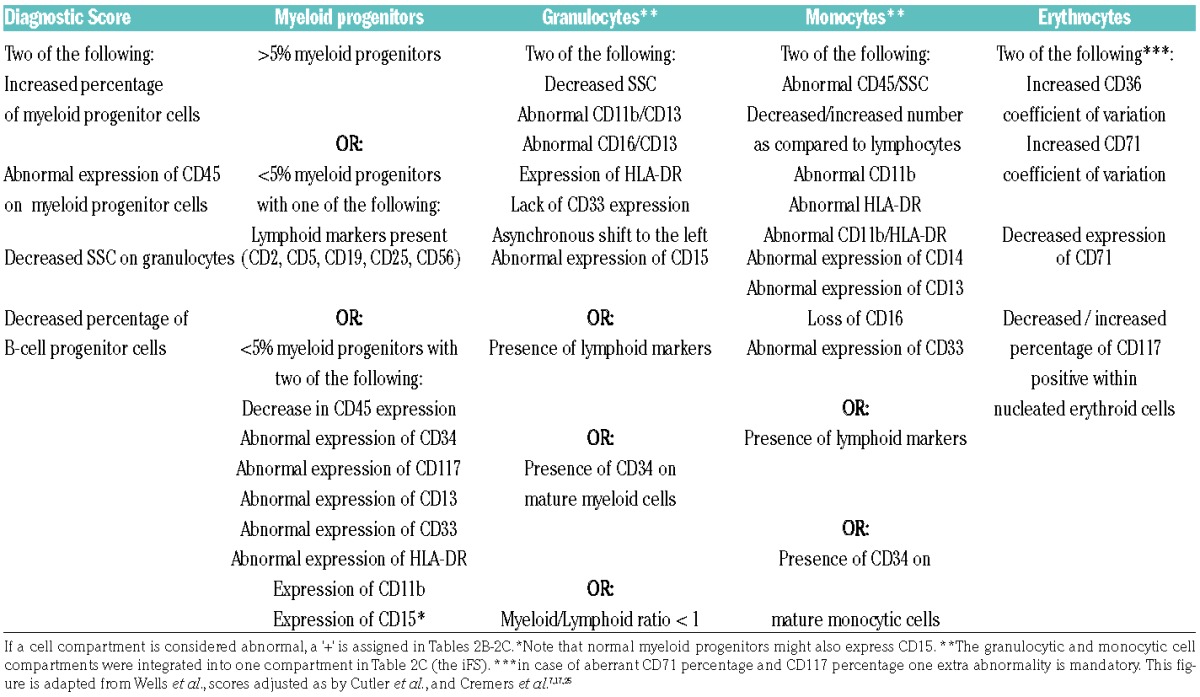
For evaluation of the erythroid compartment, guidelines as described by the IMDS-flow were applied. Erythroid evaluation included analysis of CD71 (CV and MFI), CD36 (CV), and CD117 (percentage within the CD45-negative-diminished cell fraction). Cut-off values were assessed as described in the tandem-paper (see also the mathematical examples in the Online Supplementary Files of the paper). Examples are provided in Online Supplementary Figure S1. Following the simplified recommendations, an increased CV of CD71, a decreased MFI of CD71, an increased CV of CD36, and a decreased or increased percentage of CD117 were each assigned one point. A score of ≥2 points was defined as MDS-associated erythroid aberrancies. The four-parameter diagnostic score was calculated according to guidelines as previously described, using the defined cut-offs.13 The iFS was established as described previously.25 The diagnostic score, the iFS, and the erythroid score are described in Table 2A.
Table 2A.
The parameters that describe the original integrated MDS-FC score, the erythroid score and the diagnostic score.
Models for incorporation of erythroid analysis
Tables 2B–2C describe the two models designed to add erythroid FC analysis to validated MDS-FC approaches. Patients with MDS-associated erythroid aberrancies received one extra point in comparison with the original diagnostic score; a total of ≥2 points was labeled as MDS. The second model added erythroid evaluation to the iFS. Patients with iFS results B with erythroid aberrancies by FC were labeled compatible with MDS.
Table 2B.

Table 2C.
The addition of the erythroid evaluation to the integrated MDS-FC score (iFS).16

Statistics
Results from MDS-FC were compared between the MDS and control group. Absolute numbers and relative percentages described the data. To test the concordance between presence of MDS-associated erythroid aberrancies and patient group, a chi-square test was performed. To compare the results of different techniques the McNemar test was used. P-values <0.05 were statistically significant. Specificity and sensitivity, and 95%-confidence intervals, were calculated for each MDS-FC model using a two-by-two model. Inter-observer analysis of MDS-FC aberrancies and the diagnostic score was tested by an independent MDS-expert center: the Department of Immunology of the Erasmus University Medical Center, Rotterdam, The Netherlands. Analyses were performed using PASW Statistics version 20.0 (SPSS, Chicago, IL, USA).
Results
Evaluation of erythroid markers
In accordance with the IMDS-flow recommendations, we analyzed CD36 (CV), CD71 (CV and MFI), and CD117 (percentage within the CD45 negative-diminished cell fraction). Table 1 lists the analyzed erythroid markers per group. An increased CV of CD71 was the most sensitive marker for MDS as it was positive in 66% of MDS patients, followed by an increased/decreased percentage of CD117 (64%). An increased CV of CD36 was the most specific marker as only 3% of controls were positive for this marker. Within the MDS group, 64% patients showed multiple erythroid aberrancies (≥2 points), compared with 11% of patients within the control group. The presence of multiple erythroid aberrancies was significantly correlated with the diagnosis of MDS (P<0.001).
Correlation between patient group and cytomorphology
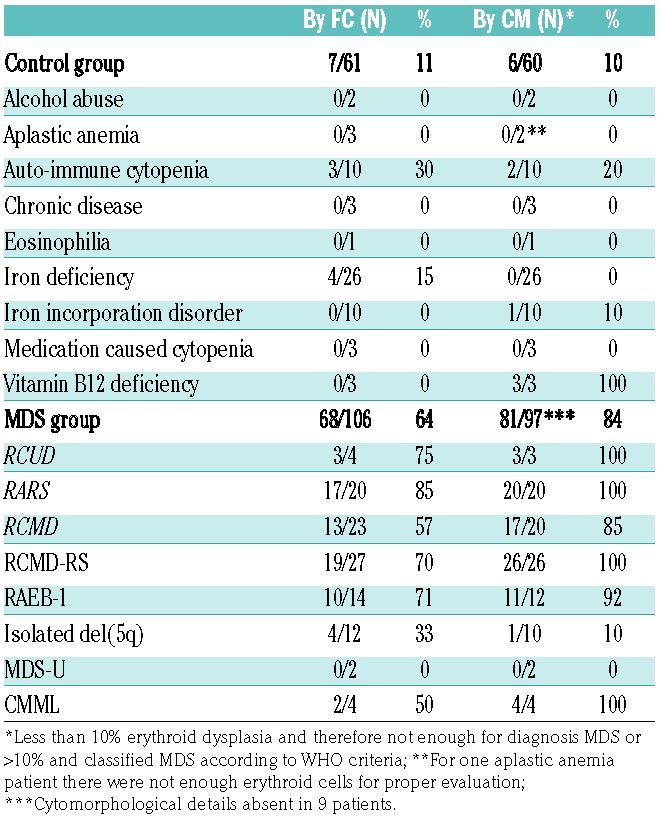
Since we found a significant correlation between patient group (MDS or control) and the presence of erythroid aberrancies, the next step was to evaluate the relation between erythroid evaluation by cytomorphology and FC in more detail. As controls might have minimal dyserythropoiesis by cytomorphology, FC might also detect erythroid aberrancies in controls.26,27 Information about erythroid features by cytomorphology was available in 92% of patients in the MDS group, and in 98% patients within the control group. Table 3 provides an overview of the results. Although the positive test results (dyserythropoiesis by cytomorphology and erythroid aberrancies by FC) seem equally distributed between the MDS and the controls, FC identified more dysplastic cases than cytomorphology (MDS-FC-positive cases within the cytopenic controls based on morphology). Therefore, the McNemar test, which focuses on the differences between two correlated proportions, was not significant (P=0.01).
Table 3.
Comparison of dyserythropoiesis as assessed by cytomorphology and flow cytometry.
Addition of erythroid markers to current MDS-FC scoring systems - diagnostic score
The original diagnostic score was indicative for MDS in 78/106 MDS patients, and negative for MDS in 53/61 of the control patients (Figure 1). Hence, sensitivity and specificity of this diagnostic score were 74% (95% CI: 64%–82%) and 87% (95% CI: 76%–94%), respectively. By erythroid evaluation, 64% of MDS patients and 11% of controls revealed erythroid aberrancies by FC (Table 1). Erythroid results were added to the diagnostic score as illustrated in Table 2B. This led to an upgrade in MDS-FC category in 13 MDS patients and 2 controls. Consequently, the sensitivity and specificity for the diagnostic score including erythroid evaluation were 86% (95% CI: 78%–92%) and 84% (95% CI: 72%–92%), respectively.
Figure 1.
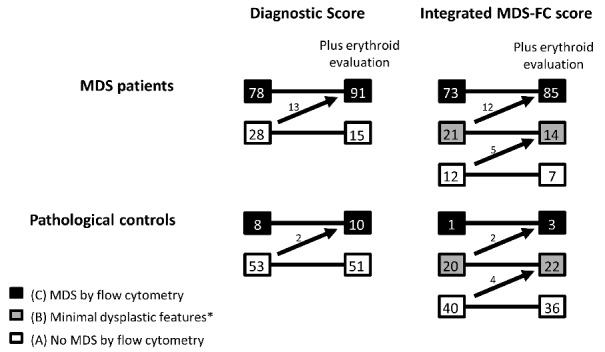
MDS-FC results in the MDS and control group. The diagnostic score and the integrated MDS-FC score in patients within the MDS group and control group. The arrows demonstrate the patients changing groups after addition of erythroid evaluation as recommended by the IMDS-flow group. *Flow cytometric results showed minimal dysplastic features, not enough for MDS.
Addition of erythroid markers to current MDS-FC scoring systems - integrated MDS-FC score
With the addition of erythroid analysis, two extra RARS patients, five RCMD patients, four RCMD-RS patients, and one del(5q) patient were subsequently recognized as MDS. The addition of erythroid analysis did not alter the results for the RAEB-1, MDS-U and CMML patients (Figure 2 and Table S2). Results of the original iFS were C ‘compatible with MDS’ in 73/106, B ‘minor MDS related aberrancies’ in 21/106, and A ‘not compatible with MDS’ in 12/106 MDS patients. Interestingly, each MDS patient not recognized by the original iFS showed only dyserythropoiesis with or without dysmegakaryopoiesis by cytomorphological assessment. In the control group, results were A in 40/61 patients, B in 20/61 patients, and C in only 1/61 patients. The calculated sensitivity and specificity of the iFS were 69% (95% CI: 59% to 78%) and 98% (95% CI: 91%–100%), respectively.
Figure 2.
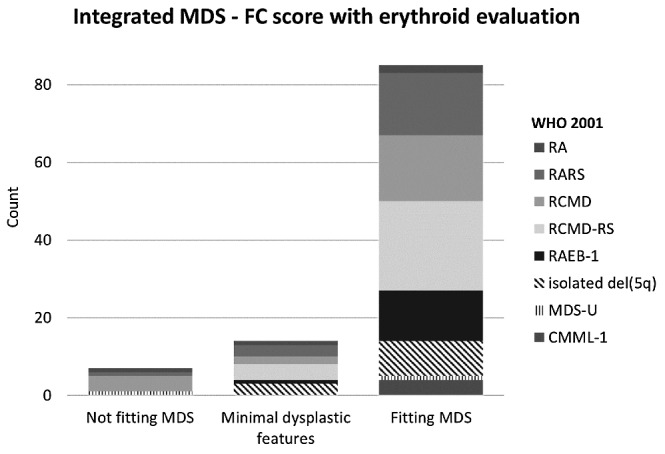
WHO-classifications within different MDS-FC groups. Distribution of WHO-classifications within the original iFS categories, and iFS categories after the addition of erythroid evaluation. With the addition of the erythroid compartment, patients shift into a higher MDS-FC category. Category A ‘no MDS-related features’, B ‘limited number of changes associated with MDS’, or C ‘features consistent with MDS’. Absolute patient numbers are provided in the Online Supplementary Files (Table S2)
In the MDS group, 33 patients were not assigned to MDS by the original iFS (Figure 1; category A and B). After addition of erythroid evaluation, 12 MDS patients changed from B to C (now allocated MDS), and 5 patients in category A were changed to B (limited changes but still no MDS). In total, 21 patients were not assigned to MDS; 7 in category A, 14 in category B. In the control group, one patient was incorrectly identified as MDS (category C). After addition of erythroid evaluation, two extra patients in category B were upgraded to C and thus allocated as MDS (Figure 1). Overall, the sensitivity of the iFS increased to 80% (95% CI: 71%–87%), and the specificity showed only a minor decline to 95% (95% CI: 86%–99%)
In summary, the sensitivity for both the diagnostic score and the iFS increased significantly after addition of erythroid evaluation. For the diagnostic score, sensitivity increased from 74% to 86%, and the iFS sensitivity increased from 69% to 80%. For both strategies, specificity was only marginally affected: 87% to 84% for the diagnostic score; and 98% to 95% for the iFS. Figure 2 illustrates distribution of WHO classifications within the original iFS, and after addition of erythroid evaluation.
Robustness of the MDS-FC results
Interpretation of FC data in MDS is considered to require a high level of expertise. To check solidity of our MDS-FC based conclusions, 25% of the MDS cases were analyzed blindly by an independent MDS-FC expert center (VHJvdV and JtM). The scores were calculated in the same data files. Results of the diagnostic score revealed a concordance of 100% and 89% for the 4-color and 8-color analysis, respectively. Analysis of the iFS revealed a concordance of 89% and 86%, for the 4-color analysis and the 8-color analysis, respectively. Addition of erythroid evaluation did not influence the concordance of the MDS-FC models.
Discussion
The evaluation of dyserythropoiesis by a flow cytometric (FC) approach is not included in most of today’s MDS-FC models. The International/European LeukemiaNet Working Group for Flow Cytometry in MDS (IMDS-flow) proposed a method for evaluation of the erythroid compartment by FC. In the current study, we validated erythroid evaluation and investigated the value of the introduced erythroid evaluation in two previously validated MDS-FC approaches. We analyzed 167 bone marrow aspirates, 106 patients with MDS, and 61 cytopenic controls for which the IMDS-Flow erythroid score, diagnostic score, and integrated FC score (iFS) were calculated.13,16 Originally, the erythroid score was designed as a weighted score. It can also be applied as a numerical score (one point per parameter) in which ≥2 points identifies MDS-associated erythroid aberrancies. The exception made in the tandem-manuscript is to be noted: if the 2 points are based on the combination of decreased MFI of CD71 and abnormal percentage of CD117, an additional aberrancy is warranted. The latter was not seen in this cohort. Results from erythroid evaluation confirmed the results of the IMDS-flow report since we showed a strong significant correlation between MDS-associated erythroid aberrancies assessed by FC and MDS. Investigation of the correlations between cytomorphological results and FC results suggested that FC detected less erythroid aberrancies compared with cytomorphology results. Here, the fact that both techniques investigate different aspects needs to be considered. FC mainly evaluates cell surface characteristics, whilst cytomorphology also evaluates features within the cell, such as nuclear bridging. It is unknown whether these dysplastic features result in altered antigen expression. The FC method is however rather specific as, for example, it did not report MDS-associated erythroid aberrancies where cytomorphology described dyserythropoiesis in patients with a vitamin B12 deficiency. This indicates that both techniques provide supplementary information and complement, rather than contradict, one another.
The goal of the study was to increase the sensitivity of currently applied MDS-FC models. Indeed, the addition of erythroid lineage analysis to the currently applied diagnostic score demonstrated an increased sensitivity (from 74% to 86%), without a major loss in specificity (87% to 84%). These results support the findings of Mathis et al., who tested the addition of erythroid evaluation by FC in non-lysed samples (RED score) to the diagnostic score.22 The combination was analyzed in a cohort of 101 patients (83 MDS patients and only 18 controls) and resulted in a sensitivity and specificity of 88% and 89%, respectively. The RED score and the erythroid score described by the IMDS-flow both comprised evaluation of CD36 CV and CD71 CV. Differences were, however, i) a non-lysed method in the RED score, ii) the addition of hemoglobin level in the RED score, iii) the added value of percentage of CD117, and iii) added value of expression level of CD71. As illustrated by Mathis and colleagues, hemoglobin showed a strong negative correlation with the other markers in the RED score. Note, hemoglobin might be subject to confounders, e.g., transfusion requirements, and as a non-FC parameter less suitable in a MDS-FC model.
The second diagnostic MDS-FC model evaluated in the current study was the iFS; a more extensive model, comprising the diagnostic score and evaluation of frequently described aberrancies on (im)mature myelo-/monocytic cells. Addition of erythroid markers to this score led to an increased sensitivity (from 69 to 80%), without substantially affecting the specificity (from 98 to 95%). The combination of the iFS with the IMDS-flow erythroid score showed the highest specificity; higher than the other described scores.
Most described MDS-FC scores were designed and validated in large patient cohorts. However, interpretation of results within individual patients can be challenging. To our knowledge, the iFS is the only MDS-FC algorithm that has proven its power in individual patients, demonstrated by its high specificity in patients with cytopenias of unknown origin followed over time.17 After addition of erythroid lineage evaluation, its specificity remained high and, therefore, it might be expected that the new model is applicable in individual patient analysis.
To not overcall patients with cytopenia of unknown origin as MDS, one would prefer to apply the most specific model. However, in an era where cost-effectiveness is becoming increasingly important, a limited panel might be preferred. To improve the four-parameter diagnostic score, Bardet and colleagues advised the addition of CD7 (on myeloid progenitors) and CD56 (on monocytes) to the diagnostic score.28 Specificity of this adjusted score was 87%; however, the sensitivity was low (66%). Here, the addition of selected erythroid markers might improve the sensitivity of FC.
The addition of analysis of mutation in genes involving splicing factors, epigenetic regulators, signal transduction or the cohesion complex, to diagnostic evaluation is suggested.29,30 However, none of the mutations is disease specific, and some mutations appeared to be present in low frequency in the elderly population.31 Therefore, more research regarding their role in the diagnostic setting in MDS is warranted. Until then, FC has proven to be a valuable diagnostic tool, which can fill in the gaps where cytomorphology and cytogenetic results are less certain of a diagnosis. It has shown to be highly specific in the diagnosis of MDS, so can exclude patients from unnecessary follow-up. MDS-FC is described to be less sensitive in MDS recognition. Our study, however, showed that addition of erythroid evaluation to currently applied MDS-FC models increased the sensitivity of FC in the detection of MDS. We postulate, therefore, that MDS-FC is ready for general clinical application.
Supplementary Material
Acknowledgments
The authors would like to thank Yvonne van der Veeken, Elsbeth Römers, and Adri Zevenbergen (VU University Medical Center, Cancer Center Amsterdam, Amsterdam) for their technical assistance, and all the participating centers within Dutch-Belgian Hematology Oncology Cooperative Trial Group (HOVON) for including patients in the HOVON89 trial.
Footnotes
Check the online version for the most updated information on this article, online supplements, and information on authorship & disclosures: www.haematologica.org/content/102/2/320
References
- 1.Vardiman JW, Thiele J, Arber DA, et al. The 2008 revision of the World Health Organization (WHO) classification of myeloid neoplasms and acute leukemia: rationale and important changes. Blood. 2009;114(5):937–951. [DOI] [PubMed] [Google Scholar]
- 2.Malcovati L, Hellström-Lindberg E, Bowen D, et al. Diagnosis and treatment of primary myelodysplastic syndromes in adults: recommendations from the European LeukemiaNet. Blood. 2013; 122(17):2943–2964. [DOI] [PMC free article] [PubMed] [Google Scholar]
- 3.van de Loosdrecht AA, Alhan C, Béné MC, et al. Standardization of flow cytometry in myelodysplastic syndromes: report from the first European LeukemiaNet working conference on flow cytometry in myelodysplastic syndromes. Haematologica. 2009;94(8):1124–1134. [DOI] [PMC free article] [PubMed] [Google Scholar]
- 4.Porwit A, van de Loosdrecht AA, Bettelheim P, et al. Revisiting guidelines for integration of flow cytometry results in the WHO classification of myelodysplastic syndromes-proposal from the International/European LeukemiaNet Working Group for Flow Cytometry in MDS. Leukemia. 2014;28(9):1793–1798. [DOI] [PubMed] [Google Scholar]
- 5.Chopra A, Pati H, Mahapatra M, et al. Flow cytometry in myelodysplastic syndrome: analysis of diagnostic utility using maturation pattern-based and quantitative approaches. Ann Hematol. 2012; 91(9):1351–1362. [DOI] [PubMed] [Google Scholar]
- 6.Matarraz S, López A, Barrena S, et al. Bone marrow cells from myelodysplastic syndromes show altered immunophenotypic profiles that may contribute to the diagnosis and prognostic stratification of the disease: a pilot study on a series of 56 patients. Cytometry B Clin Cytom. 2010; 78(3):154–168. [DOI] [PubMed] [Google Scholar]
- 7.Wells D, Benesch M, Loken MR, et al. Myeloid and monocytic dyspoiesis as determined by flow cytometric scoring in myelodysplastic syndrome correlates with the IPSS and with outcome after hematopoietic stem cell transplantation. Blood. 2003;102(1):394–403. [DOI] [PubMed] [Google Scholar]
- 8.van de Loosdrecht AA, Ireland R, Kern W, et al. Rationale for the clinical application of flow cytometry in patients with myelodysplastic syndromes: position paper of an International Consortium and the European LeukemiaNet Working Group. Leuk Lymphoma. 2013; 54(3):472–475. [DOI] [PubMed] [Google Scholar]
- 9.Kern W, Haferlach C, Schnittger S, Haferlach T. Clinical utility of multiparameter flow cytometry in the diagnosis of 1013 patients with suspected myelodysplastic syndrome: correlation to cytomorphology, cytogenetics, and clinical data. Cancer. 2010;116(19):4549–4563. [DOI] [PubMed] [Google Scholar]
- 10.Lorand-Metze I, Ribeiro E, Lima CSP, et al. Detection of hematopoietic maturation abnormalities by flow cytometry in myelodysplastic syndromes and its utility for the differential diagnosis with non-clonal disorders. Leuk Res. 2007; 31(2):147–155. [DOI] [PubMed] [Google Scholar]
- 11.Malcovati L, Della Porta MG, Lunghi M, et al. Flow cytometry evaluation of erythroid and myeloid dysplasia in patients with myelodysplastic syndrome. Leukemia. 2005;19(5):776–783. [DOI] [PubMed] [Google Scholar]
- 12.Xu F, Li X, Chang C-K, et al. Establishment and Validation of an Updated Diagnostic FCM Scoring System Based on Pooled Immunophenotyping in CD34+ Blasts and Its Clinical Significance for Myelodysplastic Syndromes. PLoS One. 2014;9(2):e88706. [DOI] [PMC free article] [PubMed] [Google Scholar]
- 13.Della Porta MG, Picone C, Pascutto C, et al. Multicenter validation of a reproducible flow cytometric score for the diagnosis of low-grade myelodysplastic syndromes: results of a European LeukemiaNET study. Haematologica. 2012;97(8):1209–1217. [DOI] [PMC free article] [PubMed] [Google Scholar]
- 14.Ogata K, Della Porta MG, Malcovati L, et al. Diagnostic utility of flow cytometry in low-grade myelodysplastic syndromes: a prospective validation study. Haematologica. 2009;94(8):1066–1074. [DOI] [PMC free article] [PubMed] [Google Scholar]
- 15.Westers TM, Ireland R, Kern W, et al. Standardization of flow cytometry in myelodysplastic syndromes: a report from an international consortium and the European LeukemiaNet Working Group. Leukemia. 2012;26(7):1730–1741. [DOI] [PubMed] [Google Scholar]
- 16.Van de Loosdrecht A, Westers T. Cutting edge: flow cytometry in myelodysplastic syndromes. J Natl Compr Canc Netw. 2013;11(7):892–902. [DOI] [PubMed] [Google Scholar]
- 17.Cremers EMP, Westers TM, Alhan C, et al. Multiparameter flow cytometry is instrumental to distinguish myelodysplastic syndromes from non-neoplastic cytopenias. Eur J Cancer. 2016;54:49–56. [DOI] [PubMed] [Google Scholar]
- 18.Germing U, Strupp C, Giagounidis A, et al. Evaluation of dysplasia through detailed cytomorphology in 3156 patients from the Düsseldorf Registry on myelodysplastic syndromes. Leuk Res. 2012;36(6):727–734. [DOI] [PubMed] [Google Scholar]
- 19.Xu F, Wu L, He Q, et al. Immunophenotypic analysis of erythroid dysplasia and its diagnostic application in myelodysplastic syndromes. Intern Med J. 2012;42(4):401–411. [DOI] [PubMed] [Google Scholar]
- 20.Fajtova M, Kovarikova A, Svec P, et al. Immunophenotypic profile of nucleated erythroid progenitors during maturation in regenerating bone marrow. Leuk Lymphoma. 2013;54(11):2523–2530. [DOI] [PubMed] [Google Scholar]
- 21.Eidenschink Brodersen L, Menssen AJ, Wangen JR, et al. Assessment of erythroid dysplasia by “Difference from normal” in routine clinical flow cytometry workup. Cytometry B Clin Cytom. 2015;88(2):125–135. [DOI] [PubMed] [Google Scholar]
- 22.Mathis S, Chapuis N, Debord C, et al. Flow cytometric detection of dyserythropoiesis: a sensitive and powerful diagnostic tool for myelodysplastic syndromes. Leukemia. 2013;27(10):1981–1987. [DOI] [PubMed] [Google Scholar]
- 23.Vardiman JW, Harris NL, Brunning RD. The World Health Organization (WHO) classification of the myeloid neoplasms. Blood. 2002;100(7):2292–2302. [DOI] [PubMed] [Google Scholar]
- 24.Westers TM, van der Velden VHJ, Alhan C, et al. Implementation of flow cytometry in the diagnostic work-up of myelodysplastic syndromes in a multicenter approach: report from the Dutch Working Party on Flow Cytometry in MDS. Leuk Res. 2012;36(4):422–430. [DOI] [PubMed] [Google Scholar]
- 25.Cutler J, Wells D, van de Loosdrecht AA, et al. Phenotypic abnormalities strongly reflect genotype in patients with unexplained cytopenias. Cytometry B Clin Cytom. 2011;80(3):150–157. [DOI] [PubMed] [Google Scholar]
- 26.Maassen A, Strupp C, Giagounidis A, et al. Validation and proposals for a refinement of the WHO 2008 classification of myelodysplastic syndromes without excess of blasts. Leuk Res. 2013; 37(1):64–70. [DOI] [PubMed] [Google Scholar]
- 27.Della Porta MG, Travaglino E, Boveri E, et al. Minimal morphological criteria for defining bone marrow dysplasia: a basis for clinical implementation of WHO classification of myelodysplastic syndromes. Leukemia. 2015;29(1):66–75. [DOI] [PubMed] [Google Scholar]
- 28.Bardet V, Wagner-Ballon O, Guy J, et al. Multicentric study underlining the interest of adding CD5, CD7 and CD56 expression assessment to the flow cytometric Ogata score in myelodysplastic syndromes and myelodysplastic/myeloproliferative neoplasms. Haematologica. 2015;100(4):472–478. [DOI] [PMC free article] [PubMed] [Google Scholar]
- 29.Haferlach T, Nagata Y, Grossmann V, et al. Landscape of genetic lesions in 944 patients with myelodysplastic syndromes. Leukemia. 2014;28(2):241–247. [DOI] [PMC free article] [PubMed] [Google Scholar]
- 30.Papaemmanuil E, Gerstung M, Malcovati L, et al. Clinical and biological implications of driver mutations in myelodysplastic syndromes. Blood. 2013;122(22):3616–3627. [DOI] [PMC free article] [PubMed] [Google Scholar]
- 31.Genovese G, Kähler AK, Handsaker RE, et al. Clonal Hematopoiesis and Blood-Cancer Risk Inferred from Blood DNA Sequence. N Engl J Med. 2014. Dec 25;371(26):2477–2487. [DOI] [PMC free article] [PubMed] [Google Scholar]
Associated Data
This section collects any data citations, data availability statements, or supplementary materials included in this article.


