Abstract
With the success of the genome-wide association studies (GWASs), many candidate loci for complex human diseases have been reported in the GWAS catalog. Recently, many disease prediction models based on penalized regression or statistical learning methods were proposed using candidate causal variants from significant single-nucleotide polymorphisms of GWASs. However, there have been only a few systematic studies comparing existing methods. In this study, we first constructed risk prediction models, such as stepwise linear regression (SLR), least absolute shrinkage and selection operator (LASSO), and Elastic-Net (EN), using a GWAS chip and GWAS catalog. We then compared the prediction accuracy by calculating the mean square error (MSE) value on data from the Korea Association Resource (KARE) with body mass index. Our results show that SLR provides a smaller MSE value than the other methods, while the numbers of selected variables in each model were similar.
Keywords: body mass index, clinical prediction rule, genome-wide association study, penalized regression models, variable selection
Introduction
With the development of genotyping technologies, many disease-related genetic variants have been verified by genome-wide association studies (GWASs). Diagnosis and disease risk prediction from the utilization of the genetic variants have improved even further [1]. Direct-to-consumer genetic companies, such as 23andME (http://www.23andme.com/) and Pathway Genomics (https://www.pathway.com/), provide personal genome information services. For example, the BRCA1 and BRCA2 genes play important roles in breast cancer diagnosis and clinical treatment [2,3]. While several disease prediction studies have been conducted using disease-related genetic variants, there are some limitations to disease risk prediction. It becomes difficult to construct a disease risk prediction model, because there are typically a larger number of genetic variants than the number of individuals in the “large p small n” problem. Also, the effect size of genetic variants for most complex human diseases is small, and missing heritability exists [4]. Moreover, some loss of statistical power to identify significant associations is caused by the correlating single-nucleotide polymorphisms (SNPs) due to linkage disequilibrium (LD) [5]. Multicollinearity due to high LD among SNPs causes high variance of coefficient estimates. In order to solve these issues, various statistical approaches have been recently proposed.
Initially, a gene score (GS) was computed using statistical models for disease risk prediction [6,7,8]. These risk prediction models were created from GSs by summing up the marginal effect of each disease-associated genetic variant. Several studies have shown that GS is useful for risk prediction [9]. However, the accuracy of the risk prediction is poor when joint effects exist between multiple genetic variants [10,11].
Building a risk prediction model using multiple SNPs is an effective way to improve disease risk prediction. Multiple logistic regression (MLR) is one of the typical traditional approaches. Several studies have shown the usefulness of an MLR-based approach for creating disease risk prediction models [12,13,14]. However, the parameter estimation of MLR becomes unstable, and the predictive power of the risk prediction model decreases if there is high LD among SNPs.
In order to solve the “large p and small n” problem, many penalized regression approaches, like ridge [15,16,17], least absolute shrinkage and selection operator (LASSO) [18], and Elastic-Net (EN) [19], have been proposed. For highdimensional data, these penalized approaches have several advantages in variable selection, as well as in prediction, over non-penalized approaches. For example, several researchers showed that the utilization of a large amount of SNPs with penalized regression approaches improves the accuracy of Crohn's disease and bipolar disorder risk prediction [20,21].
It is important to build a risk prediction model that pertains to discrete variables, such as disease diagnosis. It is also important to make predictions based on continuous variables, such as human health-related outcomes. When using medicines to treat diseases, we can use genetic information to calculate the dosage, in addition to basic physical information, such as height and weight. For example, there is a prediction model for warfarin responsiveness that was made with multivariate linear regression [22]. We can apply such a model directly to disease treatment.
In this study, we focus on the prediction of quantitative traits using common genetic variants. We systematically compared the performance of prediction models through real data from the Korea Association Resource (KARE). We first selected the prediction variables using statistical methods, such as stepwise linear regression (SLR), LASSO, and EN. We then constructed commonly used risk prediction models, such as SLR, LASSO, and EN. Finally, we compared the predictive accuracy by calculating the mean square error (MSE) value for predicting body mass index (BMI). Overall, our results show that LASSO and SLR provide the smallest MSE value among the compared methods.
Methods
Data
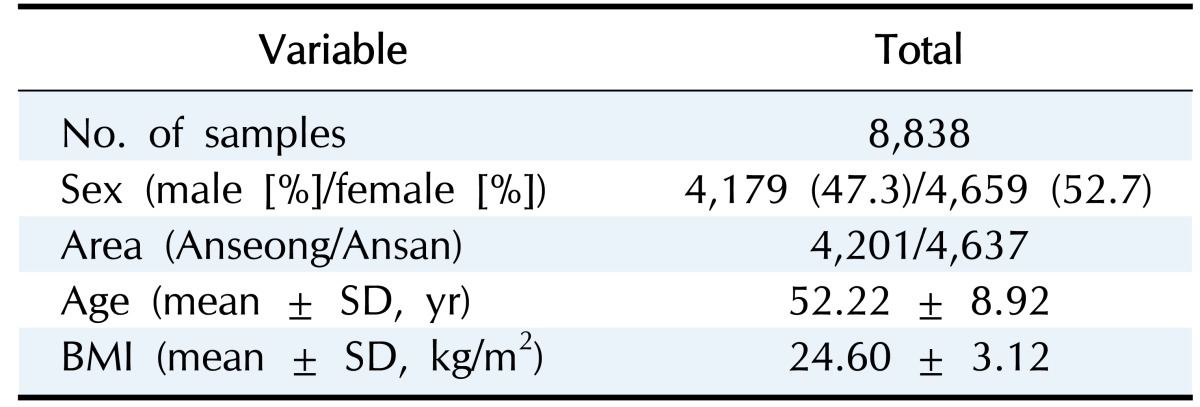
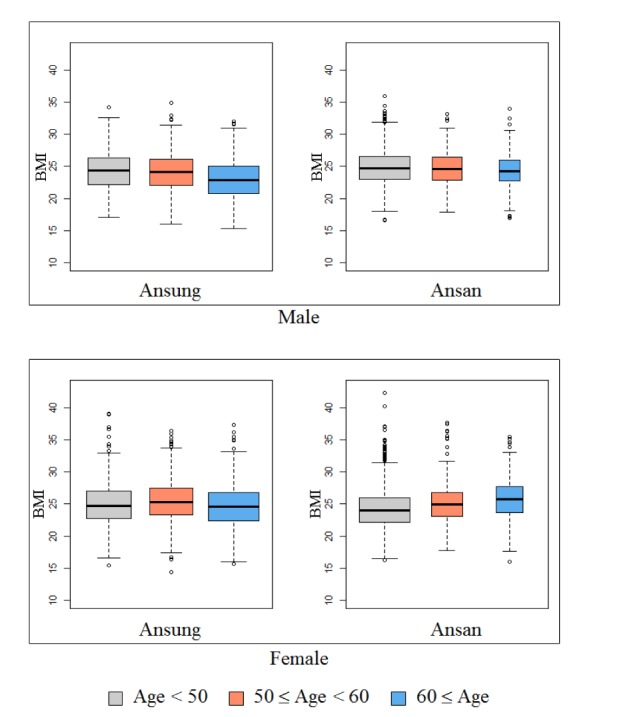
The KARE project, which began in 2007, is an Anseong and Ansan regional society-based cohort. After applying SNP quality control criteria—Hardy-Weinberg equilibrium p < 10−06, genotype call rates < 95%, and minor allele frequency < 0.01—352,228 SNPs were utilized for analysis. Also, after eliminating 401 samples with call rates less than 96%, 11 contaminated samples, 41 gender-inconsistent samples, 101 serious concomitant illness samples, 608 cryptic-related samples, and 4 samples with missing phenotype, 8,838 participants were analyzed [23]. Table 1 summarizes the demographic information. In addition, Fig. 1 shows box plots of BMI for the given demographic variables.
Table 1. Demographic variables for KARE cohort.
KARE, Korea Association Resource; BMI, body mass index.
Fig. 1. Box plots of body mass index (BMI) for the given demographic variables.
Statistical analysis
We selected SNPs from the KARE data analysis based on single-SNP analysis and collected SNPs in the GWAS catalog [24]. Then, we performed two steps to make quantitative prediction models. First, we selected the variables by using SLR, LASSO, and EN and then built quantitative prediction models by using the same methods.
SNP sets
First, based on three different populations—overall population, Asian-only population, and Korean-only population —we collected the SNPs registered in the GWAS catalog for BMI. Second, the SNPs were selected by single-SNP analysis using linear regression with adjustments for sex, age, and area. We chose the SNPs based on the p-values. We considered the following seven SNP sets:
(1) ASIAN-100 (GWAS catalog [Asia] + Single-SNP analysis, number of SNPs = 100)
(2) KOREAN-100 (GWAS catalog [Korea] + single-SNP analysis, number of SNPs = 100)
(3) ALL-200 (GWAS catalog [All] + single-SNP analysis, number of SNPs = 200)
(4) ASIAN-200 (GWAS catalog [Asia] + single-SNP analysis, number of SNPs = 200)
(5) KOREAN-200 (GWAS catalog [Korea] + single-SNP analysis, number of SNPs = 200)
(6) GWAS-ALL (GWAS catalog [All], number of SNPs = 136)
(7) GWAS-ASIAN (GWAS catalog [Asia], number of SNPs = 16)
Step 1: Variable selection
In the KARE data, out of 8,838 individuals, we randomly selected 1,767 for test sets and composed the training set with the rest of the 7,071 participants. We selected SNPs using 5-fold cross-validation (CV) of the training set. In this case, we used SLR, LASSO, and EN to select SNPs.
The SLR model is one of the most widely used models. Let yi be a quantitative phenotype for subject i = 1, …, n; xij be the value of SNP j = 1, …, p for subject i; code be 0, 1, and 2 for the number of minor alleles; and εi be the error term for subject i. The SLR model is
| yi = β0 + β1xi1 + ... + βpxip + γ1sexi + γ2agei + γ3areai + εi, |
where β0 and βj are the intercept and effect sizes of SNPs, respectively. γ1, γ2, and γ3 represent the sex, age, and area of the i-th individual, respectively. Variable selection was performed by a MSE-based stepwise procedure. The stepwise procedure was performed using the R package “MASS” [25].
The LASSO and EN estimates of β were obtained by minimizing
and
respectively. The tuning parameters λ1 and λ2 are estimated using CV. The penalized methods were performed using the R package “glmnet” [26].
Then, we defined five groups.
(1) Group 1 (consists of SNPs that appeared at least one time in the 5-fold CV)
(2) Group 2 (consists of the SNPs that appeared at least two times in the 5-fold CV)
(3) Group 3 (consists of the SNPs that appeared at least three times in the 5-fold CV)
(4) Group 4 (consists of the SNPs that appeared at least four times in the 5-fold CV)
(5) Group 5 (consists of the SNPs that appeared in all 5-fold CVs)
Step 2: Quantitative prediction
To build a quantitative prediction model, we used the same prediction methods that were applied for the variable selection step for the comparison of these three methods in the variable selection and quantitative prediction. Each prediction model was created by using 7,071 training individuals via 5-fold CV. To compare the performance of the quantitative prediction models, we calculated the MSE by applying each quantitative prediction model using the test set (n = 1,767).
Results
To create the SNP sets associated with BMI, single-SNP analysis was performed by linear regression with adjustments for sex, age, and area. As shown in Supplementary Fig. 1, we found one significant SNP (rs17178527) after Bonferroni correction (1.45 × 10−07). rs17178527 of LOC729076 has been reported as BMI-associated SNP in previous GWASs [23,27]. In addition, Supplementary Table 1 shows the results of the single-SNP analysis with p-values less than 5.00 × 10−05. The SNPs that were reported to be associated with BMI in the GWAS catalog are summarized in Supplementary Table 2. Seven SNP sets are summarized in Table 2.
Table 2. List of the SNP sets.
SNP, single nucleotide polymorphism; GWAS, genome-wide association study; KARE, Korea Association Resource; ASIAN-100, GWAS catalog (Asia) + single-SNP analysis; KOREAN-100, GWAS catalog (Korea) + single-SNP analysis; ALL-200, GWAS catalog (All) + single-SNP analysis; ASIAN-200, GWAS catalog (Asia) + single-SNP analysis; KOREAN-200, GWAS catalog (Korea) + single-SNP analysis; GWAS-ALL, GWAS catalog (All); GWAS-ASIAN, GWAS catalog (Asia).
Step 1: Variable selection
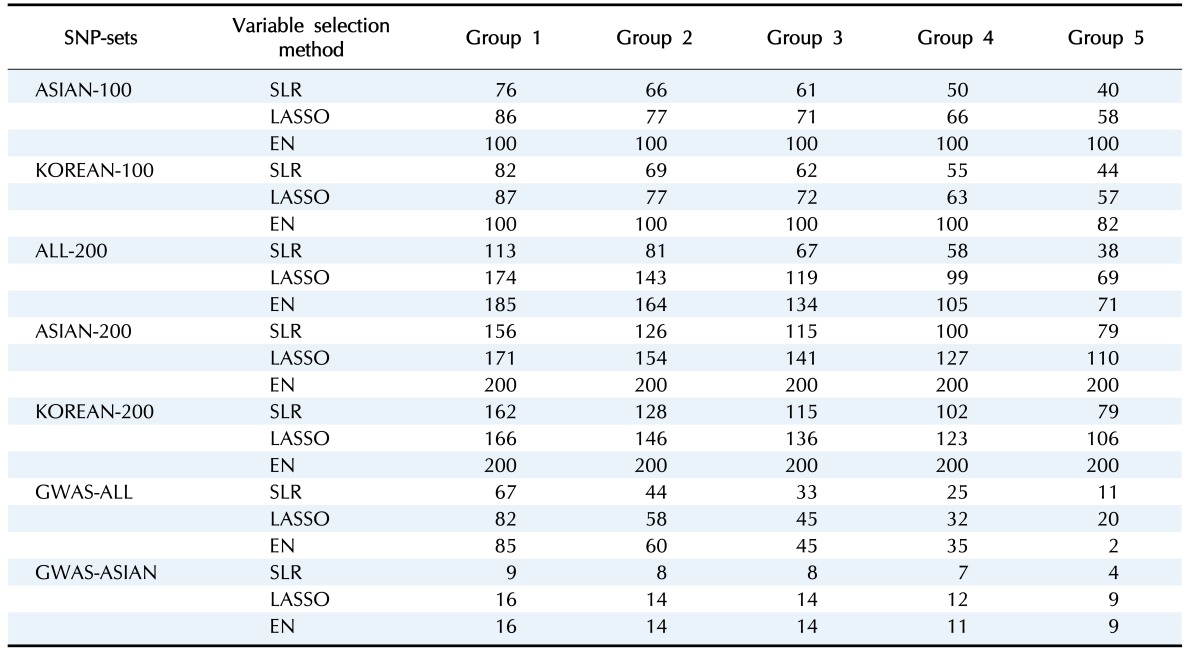
Variable selection in each SNP set was performed via 5-fold CV of the training set. Fig. 2 shows the overlapping number of selected SNPs by the variable selection methods. In addition, Table 3 provides more detailed information. Overall, SLR selected fewer SNPs than LASSO and EN. All SNPs were selected when EN was used in ASIAN-100, ASIAN-200, and KOREAN-200.
Fig. 2. Venn diagrams give us shared parts from 5-fold CV by variables selection methods. CV, cross-validation; ASIAN-100, genome-wide association study (GWAS) catalog (Asia) + singlesingle-nucleotide polymorphism (SNP) analysis; KOREAN-100, GWAS catalog (Korea) + single-SNP analysis; ALL-200, GWAS catalog (All) + single-SNP analysis; ASIAN-200, GWAS catalog (Asia) + single-SNP analysis; KOREAN-200, GWAS catalog (Korea) + single-SNP analysis; GWAS-ALL, GWAS catalog (All); GWAS-ASIAN, GWAS catalog (Asia); SLR, stepwise linear regression; LASSO, least absolute shrinkage and selection operator; EN, Elastic-Net.
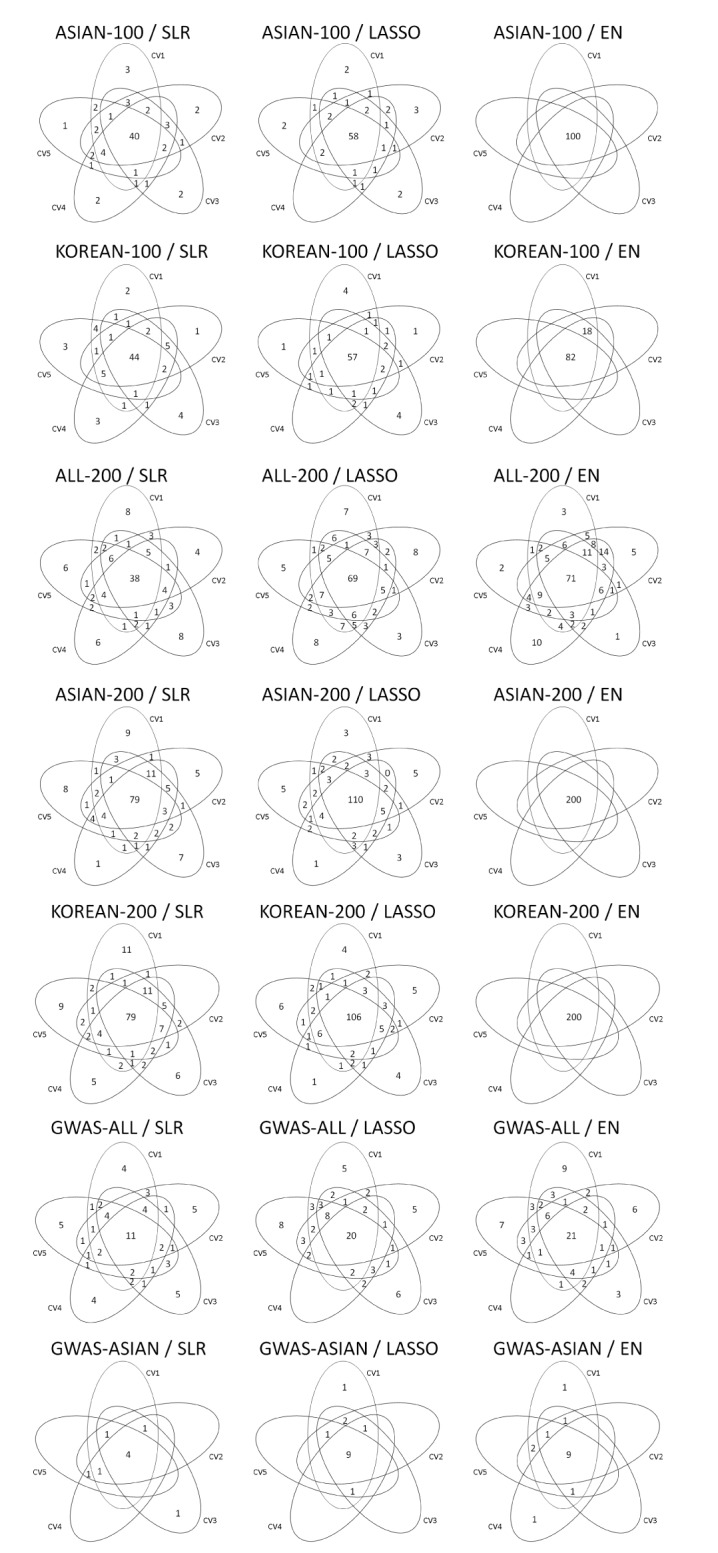
Table 3. The number of overlapping SNPs selected by 5-fold CV for each variable selection method.
SNP, single nucleotide polymorphism; CV, cross-validation; ASIAN-100, genome-wide association study (GWAS) catalog (Asia) + single-SNP analysis; SLR, stepwise linear regression; LASSO, least absolute shrinkage and selection operator; EN, Elastic-Net; KOREAN-100, GWAS catalog (Korea) + single-SNP analysis; ALL-200, GWAS catalog (All) + single-SNP analysis; ASIAN-200, GWAS catalog (Asia) + single-SNP analysis; KOREAN-200, GWAS catalog (Korea) + single-SNP analysis; GWAS-ALL, GWAS catalog (All); GWAS-ASIAN, GWAS catalog (Asia).
Step 2: Quantitative prediction
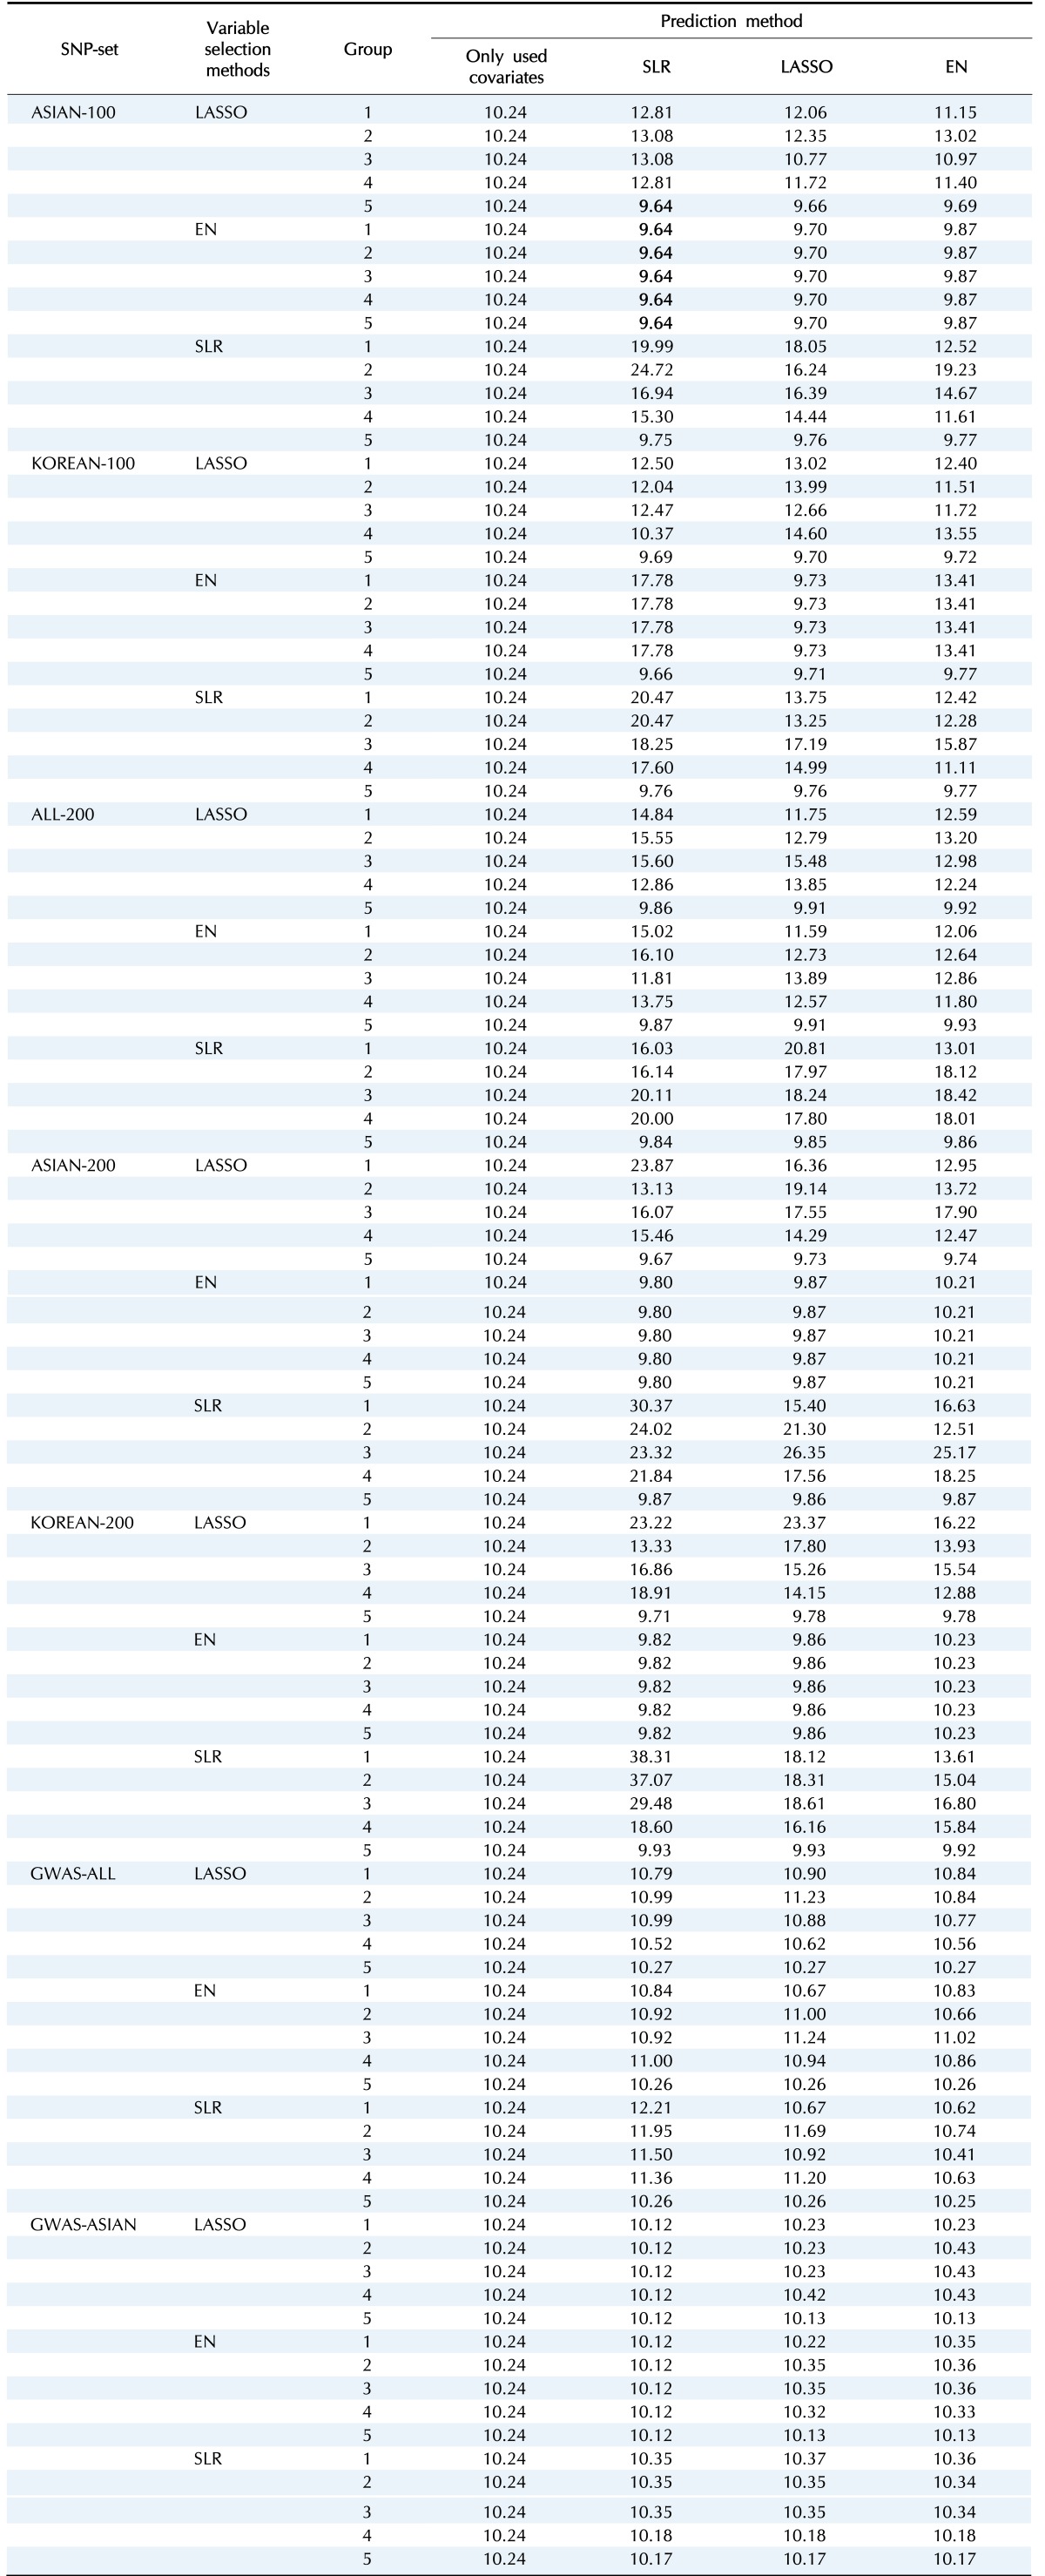
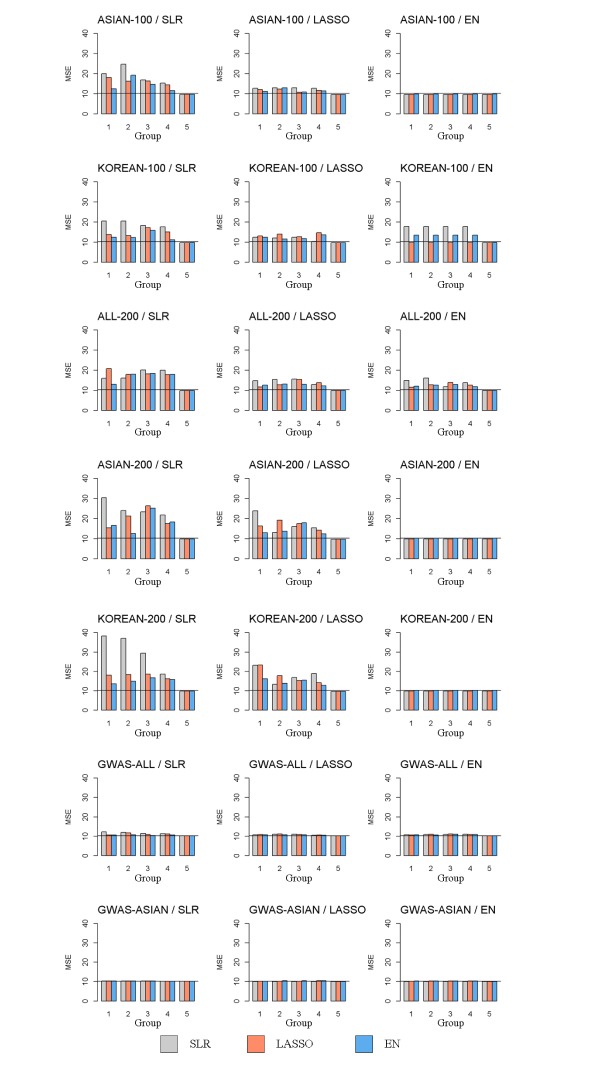
We made quantitative prediction models based on SLR, LASSO, and EN using the entire training dataset. Then, the MSE was calculated by applying the quantitative prediction models to the test dataset. Table 4 and Fig. 3 show the performance of each quantitative prediction model in the test dataset. The model using only covariates yielded an MSE value of 10.24. As can be seen from Fig. 3, the prediction model created from Group 5 yielded the smallest MSE. Fig. 4 describes the comparison results between the numbers of SNPs and MSEs from the prediction models using SLR.
Table 4. MSE values from test dataset.
MSE, mean square error; SNP, single nucleotide polymorphism; SLR, stepwise linear regression; LASSO, least absolute shrinkage and selection operator; EN, Elastic-Net; ASIAN-100, GWAS catalog (Asia) + single-SNP analysis; KOREAN-100, GWAS catalog (Korea) + single-SNP analysis; ALL-200, GWAS catalog (All) + single-SNP analysis; ASIAN-200, GWAS catalog (Asia) + single-SNP analysis; KOREAN-200, GWAS catalog (Korea) + single-SNP analysis; GWAS-ALL, GWAS catalog (All); GWAS-ASIAN, GWAS catalog (Asia).
Fig. 3. Each set by MSE value, x-axis are the number of CV containing the selected variable. Group 1, 5 is a model from variables of the union of CV and of the intersection of CV, respectively. The gray bar indicates the SLR, the orange bar indicates the LASSO, the blue bar indicates the EN and the black line is MSE value of 10.24 from the prediction model using only covariates. MSE, mean square error; CV, cross-validation; ASIAN-100, genome-wide association study (GWAS) catalog (Asia) + single-single-nucleotide polymorphism (SNP) analysis; KOREAN-100, GWAS catalog (Korea) + single-SNP analysis; ALL-200, GWAS catalog (All) + single-SNP analysis; ASIAN-200, GWAS catalog (Asia) + single-SNP analysis; KOREAN-200, GWAS catalog (Korea) + single-SNP analysis; GWAS-ALL, GWAS catalog (All); GWAS-ASIAN, GWAS catalog (Asia); SLR, stepwise linear regression; LASSO, least absolute shrinkage and selection operator; EN, Elastic-Net.
Fig. 4. The comparison of the results from variables selected by different methods and from creating a model using stepwise. MSE, mean square error; SNP, single-nucleotide polymorphism; ASIAN-100, genome-wide association study (GWAS) catalog (Asia) + single-SNP analysis; KOREAN-100, GWAS catalog (Korea) + single-SNP analysis; ALL-200, GWAS catalog (All) + single-SNP analysis; ASIAN-200, GWAS catalog (Asia) + single-SNP analysis; KOREAN-200, GWAS catalog (Korea) + single-SNP analysis; GWAS-ALL, GWAS catalog (All); GWAS-ASIAN, GWAS catalog (Asia); SLR, stepwise linear regression; LASSO, least absolute shrinkage and selection operator; EN, Elastic-Net.
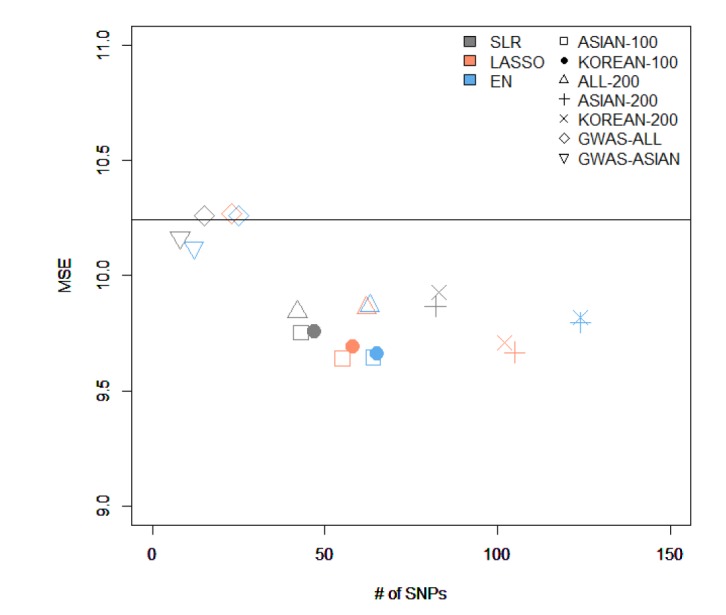
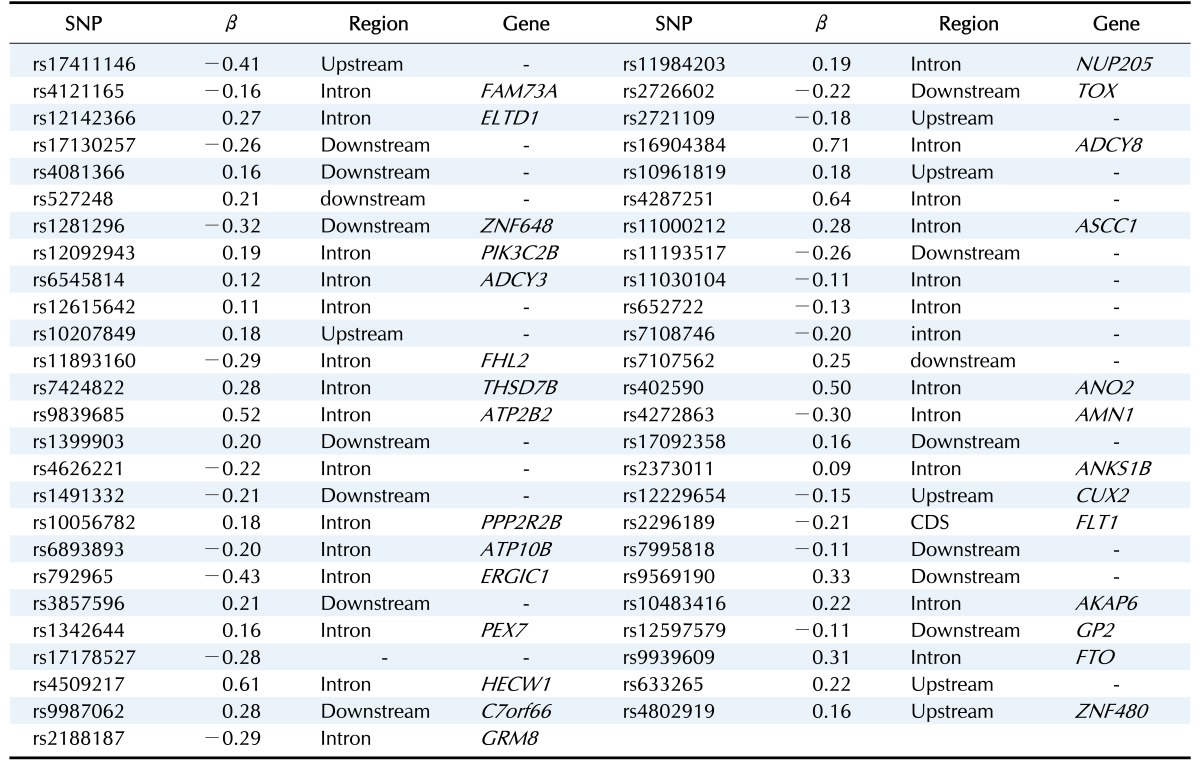
Among all sets, the case that used LASSO to select variables and SLR to create the model showed the smallest MSE value of 9.64 in ASIAN-100, with 51 SNPs. Among the 51 SNPs of LASSO-SLR with one set from ASIAN-100, 28 SNPs were mapped to genes (Table 5). Some genes, such as FTO, GP2, AKAP6, ANKS1B, ADCY3, and ADCY8, have been reported to be associated with BMI [28,29,30,31,32,33].
Table 5. Development of LASSO-SLR prediction model with one set from ASIAN-100 for predicting BMI.
LASSO, least absolute shrinkage and selection operator; SLR, stepwise linear regression; ASIAN-100, GWAS catalog (Asia) + single-SNP analysis; BMI, body mass index; SNP, single-nucleotide polymorsphism.
Discussion
In this study, we used statistical methods (SLR, LASSO, and EN) to select variables and build quantitative prediction models. Then, we compared the performance of the quantitative prediction models by each SNP set (ASIAN-100, KOREAN-100, ALL-200, ASIAN-200, KOREAN-200, GWAS-ALL, and GWAS-ASIAN). As a result, the performance of the prediction models using the GWAS catalog and KARE data was better than that of the prediction models using only SNPs reported in the GWAS catalog. For the case that selected variants using LASSO in ASIAN-100 and created a prediction model using SLR, the MSE value was the smallest, 9.64. At this time, the number of SNPs was 51. Also, for the model with the fewest SNPs, we selected variables using SLR from ALL-200 and created a model using SLR. The number of SNPs was 38, and the MSE value was 9.84. Through the 5-fold CV, we developed a quantitative prediction model. After calculating MSE from groups 1 to 5, when assembled with SNPs that were included in all CVs, the resulting values of MSE were small. However, when a different group was used, the MSE value was bigger than when using the covariates to build the model. Therefore, with CV, when using SNPs that match each of their CVs, the efficiency of their quantitative prediction model was high. In the variable selection, SLR performed better than other methods. SLR selected fewer SNPs than the other methods in all SNP sets while providing smaller MSEs. It seems that LASSO and EN tended to select SNPs with little contribution to BMI. For further research, we plan to perform simulation studies and a real-data analysis with other continuous traits.
There are many ways to extend the analysis of quantitative prediction studies. First, along with the application of recently developed methods, such as bootstrapping methods [34,35], we will continue to explore new ways to develop more prediction models. Second, the incorporation of rare variants can improve the performance of a quantitative prediction model. Advanced sequencing technology has made it possible to investigate the role of common and rare variants in complex disease risk prediction. Additionally, we can use biological information while choosing the variables. By using single-SNP analysis, we can use gene or pathway information to find useful SNPs [36], and from here, we can assemble an SNP set by adding an SNP list from the pathways related to the disease of interest.
Acknowledgments
This research was supported by a grant of the Korea Health Technology R&D Project through the Korea Health Industry Development Institute (KHIDI), funded by the Ministry of Health & Welfare, Republic of Korea (HI15C2165), and the Bio-Synergy Research Project (2013M3A9C4078158) of the Ministry of Science, ICT and Future Planning through the National Research Foundation. The GWAS chip data were supported by bioresources from the National Biobank of Korea, the Centers for Disease Control and Prevention, Republic of Korea (4845-301, 4851-302 and -307).
Supplementary materials
Supplementary data including two tables and one figure can be found with this article online http://www.genominfo.org/src/sm/gni-14-149-s001.pdf.
Genetic information associated with BMI after adjusting for sex, age, and area (p < 5.00 × 10-05)
List of SNPs reported by the GWAS catalog
Results of single-SNP analysis for 344,893 SNPs in KARE data. (A) QQ plot of p-values derived from linear regression with adjustments for sex, age, and area. The 95% confidence interval around the null hypothesis is displayed as the shaded portion. (B) Manhattan plot of the single-SNP analysis. The red dotted line marks the threshold for genome-wide significance (p = 1.45 × 10-07). SNP, single-nucleotide polymorphism; KARE, Korea Association Resource; QQ, quantile-quantile.
References
- 1.Kooperberg C, LeBlanc M, Obenchain V. Risk prediction using genome-wide association studies. Genet Epidemiol. 2010;34:643–652. doi: 10.1002/gepi.20509. [DOI] [PMC free article] [PubMed] [Google Scholar]
- 2.Futreal PA, Liu Q, Shattuck-Eidens D, Cochran C, Harshman K, Tavtigian S, et al. BRCA1 mutations in primary breast and ovarian carcinomas. Science. 1994;266:120–122. doi: 10.1126/science.7939630. [DOI] [PubMed] [Google Scholar]
- 3.Lancaster JM, Wooster R, Mangion J, Phelan CM, Cochran C, Gumbs C, et al. BRCA2 mutations in primary breast and ovarian cancers. Nat Genet. 1996;13:238–240. doi: 10.1038/ng0696-238. [DOI] [PubMed] [Google Scholar]
- 4.Manolio TA, Collins FS, Cox NJ, Goldstein DB, Hindorff LA, Hunter DJ, et al. Finding the missing heritability of complex diseases. Nature. 2009;461:747–753. doi: 10.1038/nature08494. [DOI] [PMC free article] [PubMed] [Google Scholar]
- 5.Wang WY, Barratt BJ, Clayton DG, Todd JA. Genome-wide association studies: theoretical and practical concerns. Nat Rev Genet. 2005;6:109–118. doi: 10.1038/nrg1522. [DOI] [PubMed] [Google Scholar]
- 6.International Schizophrenia Consortium. Purcell SM, Wray NR, Stone JL, Visscher PM, O'Donovan MC, et al. Common polygenic variation contributes to risk of schizophrenia and bipolar disorder. Nature. 2009;460:748–752. doi: 10.1038/nature08185. [DOI] [PMC free article] [PubMed] [Google Scholar]
- 7.Machiela MJ, Chen CY, Chen C, Chanock SJ, Hunter DJ, Kraft P. Evaluation of polygenic risk scores for predicting breast and prostate cancer risk. Genet Epidemiol. 2011;35:506–514. doi: 10.1002/gepi.20600. [DOI] [PMC free article] [PubMed] [Google Scholar]
- 8.Evans DM, Visscher PM, Wray NR. Harnessing the information contained within genome-wide association studies to improve individual prediction of complex disease risk. Hum Mol Genet. 2009;18:3525–3531. doi: 10.1093/hmg/ddp295. [DOI] [PubMed] [Google Scholar]
- 9.Janssens AC, van Duijn CM. Genome-based prediction of common diseases: advances and prospects. Hum Mol Genet. 2008;17:R166–R173. doi: 10.1093/hmg/ddn250. [DOI] [PubMed] [Google Scholar]
- 10.Weedon MN, McCarthy MI, Hitman G, Walker M, Groves CJ, Zeggini E, et al. Combining information from common type 2 diabetes risk polymorphisms improves disease prediction. PLoS Med. 2006;3:e374. doi: 10.1371/journal.pmed.0030374. [DOI] [PMC free article] [PubMed] [Google Scholar]
- 11.van der Net JB, Janssens AC, Sijbrands EJ, Steyerberg EW. Value of genetic profiling for the prediction of coronary heart disease. Am Heart J. 2009;158:105–110. doi: 10.1016/j.ahj.2009.04.022. [DOI] [PubMed] [Google Scholar]
- 12.Lindström S, Schumacher FR, Cox D, Travis RC, Albanes D, Allen NE, et al. Common genetic variants in prostate cancer risk prediction: results from the NCI Breast and Prostate Cancer Cohort Consortium (BPC3) Cancer Epidemiol Biomarkers Prev. 2012;21:437–444. doi: 10.1158/1055-9965.EPI-11-1038. [DOI] [PMC free article] [PubMed] [Google Scholar]
- 13.Jostins L, Barrett JC. Genetic risk prediction in complex disease. Hum Mol Genet. 2011;20:R182–R188. doi: 10.1093/hmg/ddr378. [DOI] [PMC free article] [PubMed] [Google Scholar]
- 14.Wacholder S, Hartge P, Prentice R, Garcia-Closas M, Feigelson HS, Diver WR, et al. Performance of common genetic variants in breast-cancer risk models. N Engl J Med. 2010;362:986–993. doi: 10.1056/NEJMoa0907727. [DOI] [PMC free article] [PubMed] [Google Scholar]
- 15.Hoerl AE. Ridge regression. Biometrics. 1970;26:603. [Google Scholar]
- 16.Hoerl AE, Kennard RW. Ridge regression: applications to nonorthogonal problems. Technometrics. 1970;12:69–82. [Google Scholar]
- 17.Hoerl AE, Kennard RW. Ridge regression: biased estimation for nonorthogonal problems. Technometrics. 1970;12:55–67. [Google Scholar]
- 18.Tibshirani R. Regression shrinkage and selection via the lasso. J R Stat Soc Ser B Methodol. 1996;58:267–288. [Google Scholar]
- 19.Zou H, Hastie T. Regularization and variable selection via the elastic net. J R Stat Soc Ser B Stat Methodol. 2005;67:301–320. [Google Scholar]
- 20.Wei Z, Wang W, Bradfield J, Li J, Cardinale C, Frackelton E, et al. Large sample size, wide variant spectrum, and advanced machine-learning technique boost risk prediction for inflammatory bowel disease. Am J Hum Genet. 2013;92:1008–1012. doi: 10.1016/j.ajhg.2013.05.002. [DOI] [PMC free article] [PubMed] [Google Scholar]
- 21.Austin E, Pan W, Shen X. Penalized regression and risk prediction in genome-wide association studies. Stat Anal Data Min. 2013;6 doi: 10.1002/sam.11183. [DOI] [PMC free article] [PubMed] [Google Scholar]
- 22.Cha PC, Mushiroda T, Takahashi A, Kubo M, Minami S, Kamatani N, et al. Genome-wide association study identifies genetic determinants of warfarin responsiveness for Japanese. Hum Mol Genet. 2010;19:4735–4744. doi: 10.1093/hmg/ddq389. [DOI] [PubMed] [Google Scholar]
- 23.Cho YS, Go MJ, Kim YJ, Heo JY, Oh JH, Ban HJ, et al. A large-scale genome-wide association study of Asian populations uncovers genetic factors influencing eight quantitative traits. Nat Genet. 2009;41:527–534. doi: 10.1038/ng.357. [DOI] [PubMed] [Google Scholar]
- 24.Welter D, MacArthur J, Morales J, Burdett T, Hall P, Junkins H, et al. The NHGRI GWAS Catalog, a curated resource of SNP-trait associations. Nucleic Acids Res. 2014;42:D1001–D1006. doi: 10.1093/nar/gkt1229. [DOI] [PMC free article] [PubMed] [Google Scholar]
- 25.Ripley B, Venables B, Bates DM, Hornik K, Gebhardt A, Firth D, et al. Package ‘MASS’. CRAN Repository; 2013. [Accessed 2016 Dec 1]. Available from: http://cran r-project org/web/packages/MASS/MASS pdf. [Google Scholar]
- 26.Friedman J, Hastie T, Tibshirani R. Regularization paths for generalized linear models via coordinate descent. J Stat Softw. 2010;33:1–22. [PMC free article] [PubMed] [Google Scholar]
- 27.Kim J, Namkung J, Lee S, Park T. Application of structural equation models to genome-wide association analysis. Genomics Inform. 2010;8:150–158. [Google Scholar]
- 28.Wang KS, Liu X, Owusu D, Pan Y, Xie C. Polymorphisms in the ANKS1B gene are associated with cancer, obesity and type 2 diabetes. AIMS Genet. 2015;2:192–203. [Google Scholar]
- 29.Frayling TM, Timpson NJ, Weedon MN, Zeggini E, Freathy RM, Lindgren CM, et al. A common variant in the FTO gene is associated with body mass index and predisposes to childhood and adult obesity. Science. 2007;316:889–894. doi: 10.1126/science.1141634. [DOI] [PMC free article] [PubMed] [Google Scholar]
- 30.Wen W, Cho YS, Zheng W, Dorajoo R, Kato N, Qi L, et al. Meta-analysis identifies common variants associated with body mass index in east Asians. Nat Genet. 2012;44:307–311. doi: 10.1038/ng.1087. [DOI] [PMC free article] [PubMed] [Google Scholar]
- 31.Manning AK, Hivert MF, Scott RA, Grimsby JL, Bouatia-Naji N, Chen H, et al. A genome-wide approach accounting for body mass index identifies genetic variants influencing fasting glycemic traits and insulin resistance. Nat Genet. 2012;44:659–669. doi: 10.1038/ng.2274. [DOI] [PMC free article] [PubMed] [Google Scholar]
- 32.Sung YJ, Pérusse L, Sarzynski MA, Fornage M, Sidney S, Sternfeld B, et al. Genome-wide association studies suggest sex-specific loci associated with abdominal and visceral fat. Int J Obes (Lond) 2016;40:662–674. doi: 10.1038/ijo.2015.217. [DOI] [PMC free article] [PubMed] [Google Scholar]
- 33.Stergiakouli E, Gaillard R, Tavaré JM, Balthasar N, Loos RJ, Taal HR, et al. Genome-wide association study of height-adjusted BMI in childhood identifies functional variant in ADCY3. Obesity (Silver Spring) 2014;22:2252–2259. doi: 10.1002/oby.20840. [DOI] [PMC free article] [PubMed] [Google Scholar]
- 34.Hall P, Lee ER, Park BU. Bootstrap-based penalty choice for the lasso, achieving oracle performance. Stat Sin. 2009;19:449–471. [Google Scholar]
- 35.Chatterjee A, Lahiri SN. Bootstrapping Lasso estimators. J Am Stat Assoc. 2011;106:608–625. [Google Scholar]
- 36.Eleftherohorinou H, Wright V, Hoggart C, Hartikainen AL, Jarvelin MR, Balding D, et al. Pathway analysis of GWAS provides new insights into genetic susceptibility to 3 inflammatory diseases. PLoS One. 2009;4:e8068. doi: 10.1371/journal.pone.0008068. [DOI] [PMC free article] [PubMed] [Google Scholar]
Associated Data
This section collects any data citations, data availability statements, or supplementary materials included in this article.
Supplementary Materials
Genetic information associated with BMI after adjusting for sex, age, and area (p < 5.00 × 10-05)
List of SNPs reported by the GWAS catalog
Results of single-SNP analysis for 344,893 SNPs in KARE data. (A) QQ plot of p-values derived from linear regression with adjustments for sex, age, and area. The 95% confidence interval around the null hypothesis is displayed as the shaded portion. (B) Manhattan plot of the single-SNP analysis. The red dotted line marks the threshold for genome-wide significance (p = 1.45 × 10-07). SNP, single-nucleotide polymorphism; KARE, Korea Association Resource; QQ, quantile-quantile.


