

Abstract
A method is demonstrated for utilizing in Fabry-Perot interferometry the data on reflection phase shift dispersion obtained from fringes of equal chromatic order. Unknown wavelengths can be calculated from the Fabry-Perot patterns obtained with a large etalon spacing, even without prior knowledge of the phase shift of the reflecting surfaces. When the theoretical phase shift as a function of wavelength is known approximately, then the correct orders of interference can be determined for both the Fabry-Perot fringes and fringes of equal chromatic order. From the wavelengths of the latter the phase shift dispersion can be measured to an accuracy of about 10 A. The method is especially useful for reflectors with large dispersion of phase shift, such as multilayers. Results in the visible spectrum are reported for aluminum films and a pair of dielectric 15-layer broadband reflectors.
1. Introduction
In the field of interferometric length and wavelength measurement it has long been recognized that the dispersion of phase shift on reflection must be considered. In Fabry-Perot interferometry, procedures for determining and/or correcting for phase shift dispersion have been described by Fabry and Buisson [1],2 Eversheim [2], Meggers [3], Bauer [4], Jackson [5], Meissner [6], Barrell and Teasdale-Buckell [7], and by Rank and Bennett [8].
In wavelength intercomparison, the phase shift dispersion enters the calculations at two points: (1) The determination of the etalon spacing, and (2) the calculation of the unknown wavelength.
The purpose of this paper is to describe how the accurate measurement of phase shift dispersion by fringes of equal chromatic order (feco) [9, 10, 11] can be used with Fabry-Perot interferometry in the determination of the etalon spacing and in precise measurement of unknown wavelengths.
1.1. Determination of Etalon Spacing
The method of exact fractions [12, 13] is generally used to determine the etalon spacing from the observed interference pattern. For three known wavelengths, λa, λb, λc, the fractional orders fa, fb, and fc, are calculated [6, 14] from the diameters of the circular fringes. Then the integral order numbers, ma, mb, mc, and the exact etalon spacing, t, are found by trying many different integers for ma, mb, and mc until the products (ma+fa)λa, (mb+fb)λb, and (mc+fc)λc are all essentially equal. The etalon spacing is then set equal to
| (1) |
This method obviously ignores the phase shift. The quantity ½(m+f)λ really represents the optical spacing of the etalon plates, which is the physical separation plus the phase shift on reflection for the particular wavelength. Since in general the phase shift is a function of wavelength, the quantity ½(m+f)λ is not constant as implied in eq (1) but is a function of wavelength. It is fortunate that for the metals aluminum and silver which are commonly used on Fabry-Perot mirrors, the phase shift dispersion is such that it is possible to find integers ma, mb, and mc which satisfy eq (1). When two different etalon spacings are determined by this method correct wavelengths values can be calculated.
Multilayer reflectors [15, 16, 17, 18] are finding considerable application in interferometry because of their low absorbance and high reflectance. For the common type of high reflection coating consisting of alternate high and low index layers, each of quarter-wave thickness for wavelength λ, the phase shift dispersion is small in the wavelength region near λ. Outside this spectral region the phase shift dispersion is much larger than for silver and aluminum mirrors. A 15-layer broadband high reflectance multilayer described by Baumeister and Stone [19] has a very large phase shift dispersion [20]. In such cases of high phase shift dispersion it is possible that integers cannot be found which will satisfy eq (1), or wrong integers may be selected.
Rank and Bennett [8] have described a method for using calculated values of the phase shift to correct the order number of interference in a Fabry-Perot etalon. Baumeister and Jenkins [20] have described another method for employing calculated phase shifts and have applied it to a nine-layer coating. The latter authors have also made measurements of the phase shift produced by the 15-layer broadband multilayer using Fizeau fringes [1]. The precision of this method was limited by the broad two-beam fringes used for comparison.
1.2. Calculation of the Unknown Wavelength
For work of highest accuracy, the above method of exact fractions is used only to determine the correct order numbers. The etalon spacing and the unknown wavelength are computed from a standard wavelength λs as follows. The method eliminates phase shift dispersion errors.
The fractional orders of interference, fx and fs are obtained for the unknown wavelength, λx, and for the standard wavelength, which can be one of the wavelengths used to determine the etalon spacing. The equations for interference at normal incidence are
| (2) |
and
| (3) |
Here ϕ(λ) is the phase shift in units of length; it is the additional optical path introduced on reflection. There are as many as four unknowns in these equations: λx, t, ϕ(λx), and ϕ(λs). (The unknown wavelength, λx, must be known in advance with sufficient accuracy to determine the order number, mx.)
If another etalon spacing, t′, is used, two more equations are obtained
| (4) |
| (5) |
The order number can be determined by the method of exact fractions described above. Again is determined from the approximate value of λx. The four equations can be solved [6] for λx by forming the difference between the two equations involving λx, also between the two equations involving λs, and equating the differences.
| (6) |
The phase shift terms are thereby eliminated. The difference in etalon spacing, t−t′, is obtained by subtracting eq (5) from eq (3)
Variations of the above method of analysis have been used by Meggers [3], Jackson [5], and Meissner [6]. The variations make analysis of an extended series of data more convenient, but fundamentally they depend on the measured quantities, fs, , fx, and in the manner shown in eq (6).
The order numbers ms, , mx, and are integers which can be determined without ambiguity in cases where ϕ(λs) and ϕ(λx) can be adequately approximated. The accuracy with which λx can be calculated from eq (6) therefore depends on the accuracy with which the fractions, f, can be measured. In particular, the error in λx is given approximately by
| (7) |
where Δλx, Δfs, , Δfx, and represent the standard deviations in the values of λx, fs, , fx, and , respectively.
If the phase shift dispersion can be determined by independent measurements, then the unknown wavelength can be calculated from eqs (2) and (3)
| (8) |
The error in λx is given approximately by
| (9) |
Comparison of eqs (7) and (9) shows under what conditions the second method (eq 8) gives more accurate results than the first method (eq 6). For a given value of Δfs, the value of Δfs/ms in eq (9) will be smaller than in eq (7). However, the difference need not be great if is small compared to ms (that is, if the smaller etalon spacing, t′, is small compared to the large etalon spacing, t).
The greatest gain is realized if 2Δϕ(λs)/msλs can be made significantly smaller than , similarly for the quantities involving the unknown wavelength, λx. Since it is possible to have , this requirement can be written as 2Δϕ/λ<Δf′. The limit on determination of the fraction f′ from the diameters of the circular fringes is about Δf′= 0.01 [21,22]. It will be shown that when fringes of equal chromatic order are used to determine the phase shift dispersion, the quantity 2Δϕ/λ can be considerably less than 0.01.
2. Theoretical Calculation of Phase Shift on Reflection
The convention used in this paper is that the phase shift on reflection, ϕ, represents an increase in optical path. The angular phase shift, ϵ = 2πϕ/λ, enters the expressions for the reflected waves as follows (θ=0; see fig. 1)
| (10) |
| (11) |
| (12) |
| (13) |
| (14) |
Here ω is the angular frequency, T the time, κ=2π/λ.
Figure 1. Schematic diagram of interferometer.

The reflecting surfaces are denoted by 1 and 2. For feco and for the center of the Fabry-Perot interference pattern the angle of incidence, θ, is zero.
The condition for constructive interference in transmission is that the optical path difference between two successive rays should be an integral number of wavelengths.
| (15) |
From eqs (10) and (11) we have
For metals or for dielectric multilayers, theory can be used to calculate the quantity
Therefore the relation between the desired angular phase shift, ϵ, and the calculated value, δ, is
| (16) |
where v is an integer.
For a metal reflector the angular phase shift, δ, is calculated from the index of the incident medium, μ0, and the optical constants, μ and k, of the metal. The expression for the complex amplitude reflectance is [23]
| (17) |
The tangent of the phase shift δ is then found by taking the ratio of imaginary part to real part:
| (18) |
The quadrant for δ is determined by taking into account the signs of the real and imaginary parts of eq (17). Thus for (the case for all metals commonly employed in interferometry, when the separation medium is air or vacuum) the real part is negative and the imaginary part is positive, which means that δ is in the second quadrant. The phase shift ϕ=ϵλ/2π=(v2π−δ)λ/2π therefore represents an increase of optical path of between λ/2 and 3λ/4.3 Figure 2 shows the phase shift for aluminum calculated from the optical constants [24, 25].
Figure 2. Dispersion of phase shift on reflection for aluminum films.

The theoretical values were calculated from the optical constants as given by Schulz [24, 25]. For the upper experimental curve the data from table 1 and the integer q=31 were used. Since this curve is parallel to the theoretical curve, it follows that q=31 is the correct order number for the fringe at λ0=6593.7A. For the lower experimental curve the integer q=30 was used.
For a multilayer the phase shift can be calculated from electromagnetic theory by one of several methods. An accurate method employs multiplication of matrices, each matrix representing a single layer [26, 27]. An exhaustive treatment of the subject has been given by Abelès [28], but the outline given by Koehler [29] is adequate for many problems.
In dealing with phase shifts on reflection from multilayers the concept of nodes is very useful [20]. For light reflected from a plane interface between air and a high index dielectric, the phase shift is ϕ = λ/2, and there is a node at the surface. For ϕ>λ/2, as with a metal, the node is inside the metal. For ϕ<λ/2, the node is on the air side of the surface. With multilayers of the common type, having a high index layer on the outside, a node for the tuned wavelength, λ, falls at the outer surface. For the broadband multilayer it has been shown [20] that there is one wavelength for which a node falls at the outer surface. At longer wavelengths the node is outside of this surface, and vice versa. Figure 3 shows the dependence of phase shift on wavelength.
Figure 3. Dispersion of phase shift on reflection for 15 layer broadband reflecting films.

The angular phase shift, δ, as given by Baumeister and Jenkins [20] was converted to linear phase shift ϕ by means of eq (16) in which v=1 and the relation ϕ = ϵλ/2π. The experimental curve has the same general shape except that it is shifted to longer wavelengths. Wavelengths from table 2 were used.
3. Experimental Procedure
Data on the phase shift dispersion were obtained by means of fringes of equal chromatic order [9, 10, 11, 30]. As shown in figure 4 collimated white light illuminated the interferometer. The very small spacing, 10 to 30μ, was accomplished by means of aluminum foil. The transmitted light entered a spectrograph, with the image of the interferometer surface being focused on the slit. As illustrated in figure 5, bright fringes appeared in the focal plane of the spectrograph for those wavelengths at which constructive interference occurred. After photographing the fringes along with an iron arc reference spectrum, the wavelengths of the fringes were measured. The method of calculating the phase shift dispersion is given below.
Figure 4. Interferometer for fringes of equal chromatic order.

A. White light source. B. pinhole, C. collimator, D. beam-divider (for reflected fringes), E. flats with metal or multilayer reflecting films, F. achromatic doublet, G. interferometer base, and H. spectrograph.
For Fabry-Perot interferometry the setup is changed as follows: The line source is placed at the focal point of the collimator, C. A larger spacer is introduced between the flats, E. A lens with longer focal length than F is used to focus the fringe pattern on the spectrograph slit, which in this case is wide.
Figure 5. Fringes of equal chromatic order with iron reference spectra (positive print).

- Aluminum films, reflection fringes, 10-μ spacer;
- aluminum films, transmission fringes, 10-μ spacer;
- 15 layer broadband films, transmission fringes, 17-μ spacer.
In c, the only obvious indication of the large dispersion of phase shift is the fact that the fringe spacing does not decrease monotonically with increasing wavelength. In the red the last few fringes are more widely spaced than those immediately preceding. Where several fringes are overexposed in the red the standard deviation in determination of wavelengths is about 0.4 A, whereas in other portions of the spectrum it is from 0.1 to 0.3 A.
Fabry-Perot interference patterns were obtained using invar spacers of 2 and 5 mm, also fused quartz spacers of 20-mm length. The light source was a natural krypton lamp, krypton being selected because of its relatively sharp and well-distributed lines. The etalons were used in air maintained near 20° C and 10-mm water vapor pressure, and corrections to the wavelengths were made by the method described by Bruce [31].
From the photograph of the interference pattern. the ring diameters were measured for several wavelengths. For the 2-mm spacer, two rings were measured at each wavelength; for the others, four rings were measured. The fractional orders, f, of interference at the center of the patterns were calculated with a least squares procedure described by Meissner [6].
4. Equations for Fringes of Equal Chromatic Order and Fabry-Perot Fringes
For the wavelengths λ0, λ1, etc., at which feco occur in the spectrograph, the normal incidence interference eq (15) can be written as
| (19) |
| (20) |
λ0 and λ1 are the wavelengths of adjacent fringes, λ0>λ1. The order number for the fringe at λ0 is n, and for each successive fringe the order number is increased by one. t′ is the physical separation of the reflecting surfaces, and ϕ(λ) is the phase shift in units of length at each surface.
In these equations the left sides can be evaluated only at the wavelengths λ0, λ1, etc., at which there are fringes. However the quantity on the right side is a continuous function of λ which is conveniently denoted as τn(λ),
| (21) |
The function τn(λ) is then evaluated by plotting nλ0 versus λ0, (n+1)λ1 versus λ1, etc., and connecting the points by a smooth curve. This curve has the same shape as the 2ϕ(λ) curve but is displaced vertically by 2t′.
With the Fabry-Perot etalon the interference equations for the centers of the ring pattern at known wavelengths λa, λb, λc, are:
| (22) |
| (23) |
| (24) |
Here again the quantity on the right side is a continuous function of λ, the curve being displaced upward from the curve τn(λ) by the amount 2(t−t′). Therefore, in general the points (ma+fa)λa, (mb+fb)λb, and (mc+fc)λc lie along a curve which is parallel to the τn curve.
5. Methods of Analysis
5.1. Method I
The first method for obtaining the order numbers n and m is used in cases where the phase shift dispersion is known approximately, as for example with metallic films with known optical constants for various wavelengths. For the feco an integer p is selected and the curve τp(λ) is determined by plotting pλ0 versus λ0, (p+1)λ1 versus λ1, etc. If it does not have the same shape as the known 2ϕ(λ) curve, then other integers are tried until an integer, n, is found which makes τn(λ) essentially parallel to 2ϕ(λ). This procedure is illustrated in figure 2.
Similarly for the Fabry-Perot data, integers ma, mb, mc are found such that when (ma+fa)λa is plotted against λa, (mb+fb)λb against λb, etc., the points fall along a curve parallel to τn(λ). In order to measure an unknown wavelength, λx, in terms of a standard wavelength, λs, a modification of eq (8) is employed. Although the absolute values of ϕ(λx) and ϕ(λs) have not been determined, it can be seen from eq (21) that the difference, 2ϕ(λx) − 2ϕ(λs), is given by
| (25) |
Therefore eq (8) becomes
| (26) |
The method has been described in terms of graphical procedures. A possible variation utilizes numerical calculations similar to those in the usual method of exact fractions. For wavelength λa the value of τn(λa) is found from the curve or by means of a numerical interpolation of the τn(λ) data. An integer ra is selected and the product (ra+fa)λa is formed, also the difference (ra+fa)λa−τn(λa). This is done for all the integers, ra, which lie within the range of possibility. Similarly different integers are tried for rb and rc until a set is found which satisfy the equation
Once the correct integers have been found by this technique eq (26) can be used to compute unknown wavelengths.
5.2. Method II
The second, more general, method can be used when the phase shift dispersion is unknown. An arbitrary integer, q, is selected and the curve τq(λ) is determined as before. Then for the Fabry-Perot data, different integers are tried for ra, rb, and rc, until a set is found for which the points (ra+fa)λa, (rb+fb)λb, and (rc+fc)λc fall along a curve parallel to τq(λ). That is,
| (27) |
In appendix 9.1 it is shown that when the integers rj are chosen in this manner then we have
| (28) |
regardless of the value of q. Here the subscript j represents the subscript a, b, c, s, or x.
The final step is to determine an unknown wavelength λx in terms of a standard wavelength, λs, and the measured fractions fx and fs. The integers rs and rx are determined in the same manner as ra, rb, and rc. When these quantities are substituted in eq (28) two equations result which can be solved for λx:
| (29) |
Just as in the standard method, the wavelength λx must be known in advance with sufficient accuracy that the proper integer, rx, can be selected. The correct integer, rx, is the one which makes the quantity (rx+fx)λx fall closest to the curve (rj+fj)λj versus λj.
6. Results
6.1. Evaporated Aluminum Films
Table 1 gives the wavelengths of feco obtained in transmission with a 10-μ spacer, the aluminum films having a transmittance of 5 to 8 percent. In principle the phase shift should be calculated taking into account the finite thickness of the aluminum films [32]. However, figure 2 shows that for the thicknesses used, the phase shift values calculated from the bulk constants yield a curve quite parallel to the experimental curve. Method I was used to determine the order number, n, as illustrated in figure 2.
Table 1.
Fabry-Perot and feco data obtained with aluminum films
| Ambient conditions for Fabry-Perot data, 20-mm, 5-mm spacers: 21.2°C, 754.6mm Hg barometric pressure, 10-mm vapor pressure; 2-mm spacer: 22.0°C, 758.8-mm, 10-mm vapor pressure.
| ||
|---|---|---|
| Wavelengths of feco λi | n+i | Optical path differences (n+i)λi |
|
|
|
|
| A | A | |
| 6593.7 | 31 | 204, 404 |
| 6379.8 | 32 | 204,153 |
| 6180.7 | 33 | 203,962 |
| 5993.7 | 34 | 203, 787 |
| 5817.1 | 35 | 203, 599 |
| 5650.9 | 36 | 203,433 |
| 5493.8 | 37 | 203,272 |
| 5345.5 | 38 | 203,129 |
| 5205.1 | 39 | 202, 998 |
| 5071.6 | 40 | 202, 862 |
| 4944.7 | 41 | 202, 734 |
| 4824.2 | 42 | 202, 616 |
| 4709.5 | 43 | 202, 510 |
| 4600.1 | 44 | 202,404 |
| 4495.5 | 45 | 202, 295 |
| 4395.4 | 46 | 202, 191 |
| 4300.3 | 47 | 202,112 |
| Wavelength of krypton line, λj (ambient) | Order, m, of interference plus fraction, f | Optical path difference, (m+f)λi |
|---|---|---|
|
| ||
| 20-mm spacer | ||
|
| ||
| A | A | |
| 6456.3448 | 62160.634 | 401, 330, 486 |
| 6056.1779 | 66267.895 | 401,330,161 |
| 5570.3369 | 72047.649 | 401, 329, 678 |
| 4502.3929 | 89136.737 | 401, 328, 612 |
| 4274.0066 | 93899.833 | 401, 328, 506 |
|
| ||
| 5-mm spacer | ||
|
| ||
| 6456.3448 | 15473.779 | 99, 904,053 |
| 6056.1779 | 16496.155 | 99, 903, 649 |
| 5570.3369 | 17934.851 | 99, 903,162 |
| 4502.3929 | 22188.669 | 99, 902, 106 |
| 4274.0066 | 23374.296 | 99, 901, 895 |
|
| ||
| 2-mm spacer | ||
|
| ||
| 6456.3399 | 6179.600 | 39, 897, 598 |
| 6056.1733 | 6587.857 | 39, 897, 204 |
| 5570.3326 | 7162.346 | 39, 896, 649 |
| 4502.3894 | 8860.985 | 39, 895, 605 |
| 4274.0033 | 9334.420 | 39, 895, 342 |
For the 2-, 5-, and 20-mm spacers the integers, m, were found as described in 5.1 and illustrated in figure 6. With each spacer the points have the same vertical displacement from the curve τn, within experimental error.
Figure 6. Optical path differences: aluminum films.

A constant was subtracted from the (mi+fi)λj values to bring them on the same scale as the τ31 curve obtained from transmission feco. For the 20-, 5-, and 2-mm spacers the constants were 401119·103, 99696·103, and 39691·103 A respectively. For the 5-mm spacer (open circles) several different sets of integers, mj, were tried together with the appropriate fractions, fi. One set gives values of (mj+fj)λj which lie along the dashed line, which is parallel to τ31. The other sets give points which obviously do not lie along lines parallel to τ31. For the 2- and 20-mm spacers the correct integers plus fractions are given in table 1, and the optical path differences are plotted above.
As an example, the wavelengths 5570.34 and 4502.39 are considered being known approximately to the nearest 0.02 A, this precision being necessary to establish the order numbers. The more precise values are to be determined by interferometric comparison with the standard line at 6056 A. From figure 6,
Therefore from eq (26) we have
Similarly for λx=4502 A
These values agree to experimental accuracy with the wavelengths for ambient conditions, as given in table 1.
In illustrating method II, rather than choose an arbitrary integer, we choose an integer, q, such that τq is as nearly constant as possible. As shown in figure 2, τ30 has only a very slight negative slope. The integers, rj, which make the points (rj+fj)λj lie along a curve parallel to τ30 are one less than the corresponding integers mj, in table 1. That is, for λ=6456, rj = 62,159.
Then for the unknown line, λx≈4502.39 A
Thus with aluminum films if a certain integer, q, is chosen the τq(λ) curve is nearly constant and the phase shift correction is very small. Furthermore the quantities (rj+fj)λj are nearly constant. In the standard method of exact fractions the integers are selected so that the quantities (rj+fj)λj are equal. Therefore the method of exact fractions as normally used gives integers, rj, which are each one less than the “true” order numbers, mj.4 This introduces no error into the determination of unknown wavelengths because only differences in order numbers for two different etalon spacings are used in the final calculation.
6.2. Fifteen-Layer Broadband Reflectors
Table 2 gives the wavelengths of feco obtained in transmission for a broadband multilayer [19] made from alternate layers of cerium dioxide and magnesium fluoride [33]. The measured reflectance was between 83 and 94 percent over the region 4500 to 7000 A. In figure 3 the theoretical phase shift curve was obtained from values published by Baumeister and Jenkins [20]. The experimental phase shift curve confirms the general shape of the theoretical curve. The displacement of about 400 A to longer wavelengths indicates that the individual layers are somewhat thicker than the theoretical values [19]. This is confirmed by the location of the reflectance maximums and minimums.
Table 2.
Fabry-Perot and feco data obtained with 15-layer broadband multilayers
| Ambient conditions for Fabry-Perot data: 19.5° C, 757.05 mm Hg barometrie pressure, 6.5-mm vapor pressure.
| ||
|---|---|---|
| Wavelengths of feco λi | n+i | Optical path difference (n+i)λi |
|
|
|
|
| A | A | |
| 6769.1 | 48 | 324,920 |
| 6651.8 | 49 | 325,937 |
| 6447.2 | 51 | 328,807 |
| 6257.5 | 53 | 331,647 |
| 6055.4 | 55 | 333,049 |
| 5852.1 | 57 | 333,571 |
| 5655.3 | 59 | 333,600 |
| 5469.9 | 61 | 333,661 |
| 5295.6 | 63 | 333,623 |
| 5131.5 | 65 | 333, 548 |
| 4976.4 | 67 | 333,421 |
| 4830.4 | 69 | 333,295 |
| 4693.1 | 71 | 333,209 |
| 4563.4 | 73 | 333,128 |
| 4440.2 | 75 | 333,014 |
| 4323.3 | 77 | 332,891 |
| 4211.6 | 79 | 332,713 |
| Wavelength of krypton line, λj (ambient) | Order, m, of interference plus fraction, f | Optical path difference, (m+f)λj |
|---|---|---|
|
| ||
| 20-mm spacer
| ||
| A | A | |
| 6456.3278 | 62168.014 | 401,377,077 |
| 6056.1620 | 66276.498 | 401, 381, 209 |
| 5570.3222 | 72057.199 | 401,381,815 |
| 4502.3809 | 89148.651 | 401, 381,184 |
| 4273.9952 | 93912.374 | 401, 381,036 |
|
| ||
| 5-mm spacer | ||
|
| ||
| 6456.3278 | 15470.386 | 99, 881,883 |
| 6056.1620 | 16493.291 | 99, 886,042 |
| 5570.3222 | 17931.927 | 99, 886, 611 |
| 4502.3809 | 22185.150 | 99, 885, 996 |
| 4273.9952 | 23370.598 | 99, 885, 824 |
|
| ||
| 2-mm spacer | ||
|
| ||
| 6456.3278 | 6183.25 | 39, 921, 087 |
| 6056.1620 | 6592.49 | 39, 925,189 |
| 5570.3222 | 7167.60 | 39, 925, 841 |
| 4502.3809 | 8867.57 | 39, 925,178 |
| 4273.9952 | 9341.38 | 39, 925,013 |
For the 2-, 5-, and 20-mm spacers the integral orders of interference, m, were obtained as described in section 5.1. For each spacer, the total optical path differences (mj+fj)λj plotted against λj fell along a curve parallel to the τ48 curve, as shown in figure 7.
Figure 7. Optical path differences: 15 layer broadband films.
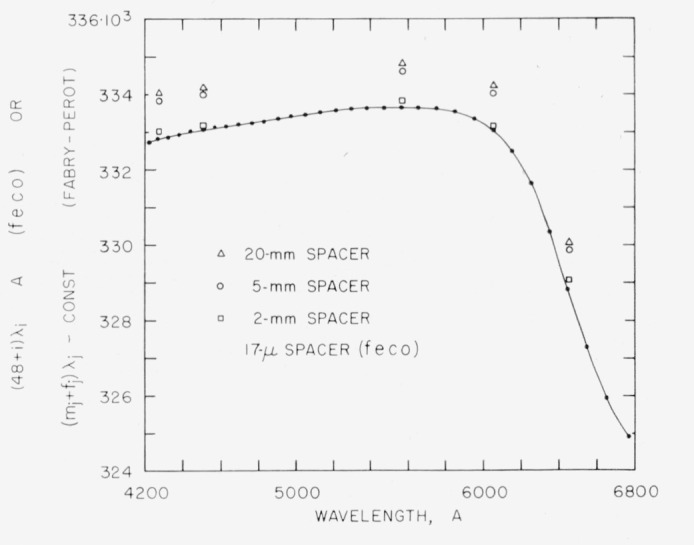
τ48 was obtained from feco in transmission. See table 2. For the 2-, 5-, and 20mm spacers, the correct integers mj were selected as described in section 5.1. Each set of points, (mj+fj)λj, lies along a curve parallel to the τ48 curve. The constants subtracted from (mj+fj)λj values for the 20-, 5-, and 2-mm spacers were 401047·103, 99552·103 and 39592-103A respectively.
Table 3 gives data for the calculation of wavelengths 5570 and 4502 A, taking as the standard the line at 6056 A. Both method I and the “standard” method (eq 6) have been used.
Table 3.
Wavelength calculations from Fabry-Perot and feco data obtained with multilayer reflectors
| a. Calculation using eq (26), 20-mm spacer and feco.
| |||
|---|---|---|---|
| λs | (ms+fs) | (ms+fs)λs | τ48(λs) |
|
|
|
|
|
| A | A | A | |
| 6056.1620* | 66276.498 | 401,381,209 | 333, 030 |
| λx† | τ48(λx) | (mx+fx) | λx | λx‡ |
|---|---|---|---|---|
|
|
|
|
|
|
| A | A | A | A | |
| 5570.32 | 333, 650 | 72057.199 | *5570.3224 | 5570.3222 |
| 4502.38 | 333,070 | 89148.651 | *4502.3816 | 4502.3809 |
6.3. Precision of Measurements
In the determination of wavelength of fringes the standard deviation for an individual reading was generally from 0.1 to 0.3 A. This resulted in a standard deviation for the values of τ of from 5 to 10 A, with a rare value as high as 30 A. With Δτ = 10 A as an example and λ = 5000 A, the ratio 2Δϕ/λ discussed earlier in connection with eq (9) becomes 2Δϕ/λ=Δτ/λ=0.002. This is to be compared with the usual error in exact fraction determination, Δf=0.01.
The improvement in precision of wavelength measurement is not so dramatic, however, since this is limited by the errors in measuring the fractions fs and fx. For example, in the standard method, eq (6), we take data from the 20-mm and 5-mm spacers (table 2) on the known line and the unknown line, 5570 A. For Δfs=Δfx=0.01, eq (7) yields Δλx=0.0022 A.
To compute the error obtained in the method employing feco, we take Δfs=Δfx=0.01 and 2Δϕ(λ)/λ=Δτ/λ=0.002. Then eq (9) yields Δλx=0.0012 A.
The precision of both methods can, of course, be improved by repeated readings. For example, Stanley and Meggers [34] report that in the measurement of iron lines with 20- or 25-mm spacers, the average of 5 or 6 readings had a probable error of 1 part in 7 million.
The question arises as to the best etalon spacing to be used for feco. Since the wavelength is multiplied by the order number to obtain the τ curve, smaller spacings and the resulting low order numbers tend to give smaller errors. But smaller spacings give fringes widely spaced in the spectrum. If the phase shift has a nonlinear variation with wavelength, as with the broadband multilayer, it is desirable to have the experimental points fairly close together. In this case, the best spacing was found to be 10 to 20μ, whereas for aluminum the smallest possible spacing was desirable.
6.4. Differences Between Transmission and Reflection Data
By placing a semireflecting mirror between the collimator and interferometer in figure 4 it is possible to project the light reflected from the interferometer onto the spectograph slit. With a small separation between the interferometer plates the resulting spectrum consists of dark fringes crossing the bright continuum. See figure 5a.
If the reflecting surfaces are nonabsorbing, the principle of conservation of energy requires that the reflected spectrum be the exact complement of the transmitted spectrum. Under these circumstances the wavelengths of the fringes should be the same in the two spectra. Then the τn curve plotted from the reflection data should also give the phase shift dispersion.
If the reflecting films are partially absorbing, this conclusion does not necessarily hold. Holden [35] has shown that there can be asymmetry in the intensity distribution of fringes obtained in reflection.
Experiments were conducted to determine whether or not the τn curve obtained from reflection feco was the same as that obtained by transmission. Exposures were taken within a few minutes of each other, and the same areas of the reflecting films were used. As expected, the aluminum films showed a small but significant difference. As shown in figure 8 the slopes are different, the maximum discrepancy between 4200 and 6500 A amounting to about 40 A. The reflection fringes showed a definite asymmetry, which made determination of their wavelengths more difficult.
Figure 8. Differences in data obtained by transmission and reflection.

The experimental points represent (n+i)λi, where n is the order number of the fringe at λ0, i is an integer, and λi is the wavelength of a fringe observed either by transmission or by reflection. In the case of the 15-layer films a relatively thick spacer (40μ) was used and fringes were closely spaced. Only about one-third of the fringes were measured and plotted. In the case of the aluminum films the vertical scale interval has been expanded to four times that of the multilayer in order to show more clearly the small but significant difference between the transmission and reflection data. Only the transmission feco should be used in connection with Fabry-Perot fringes obtained by transmission.
The two curves for the 15-layer multilayer showed a difference of about 150 A between 4800 and 6600 A. See figure 8. This result was unexpected because of the low absorption of dielectric multilayers. Transmittance and reflectance measurments on these multilayers indicated with the absorptance is no more than 2.5 percent at 4800 A and no more than 1 percent at 6000 A. However, no error is introduced if phase shift data obtained by transmission feco are used in connection with Fabry-Perot fringes obtained in transmission since both are governed by the interference eq (15). The reflection fringes are governed by a different interference condition [11, 35, 36].
6.5. Uniformity of Phase Shift Dispersion
With multilayer films the reflectance and phase shift on reflection are generally more sensitive functions of the thickness of the individual layers than with metal reflectors. If the absolute value of the phase shift is not constant over the aperture, it has the same effect as nonflatness of the support plate. If the dispersion of phase shift is not constant, then the shape of the reflected wavefront will depend on the wavelength [37]. In particular, if two such mirrors are adjusted to be optically parallel when a green line is used, they may not be optically parallel in the red or blue.
The phase shift dispersion was measured at six points across the 15-layer films. Over a 40-mm distance there was a definite change in the shape of the curve, amounting to 300 A from the blue to the red end of the spectrum. For precision Fabry-Perot interferometry this variation is too large to be tolerated. For the experiments reported here a 10-mm-diam aperture was placed between the interferometer plates. The total variation in phase shift dispersion over this area was less than 100 A, which is the same order of magnitude as the departure from flatness of the support plates.
Freshly deposited aluminum films showed very little variation in phase shift dispersion over a 40-mm aperture, the maximum discrepancy being about 40 A over the region 4300 to 6600 A.
These results indicate that multilayers for interferometers in which several wavelengths are to be used should be checked for uniformity of phase shift dispersion. The use of feco provides a convenient and precise method.
7. Conclusions
It has been found that measurements of reflection phase shift dispersion by means of fringes of equal chromatic order are useful at three stages in wavelength comparisons by Fabry-Perot interferometry. First, for multilayer reflectors it must be established that the phase shift dispersion is sufficiently uniform over the aperture. This can be done by obtaining the feco at several points across the aperture.
Second, the phase shift data can be combined with the method of exact fractions to yield the integral order numbers. This is especially valuable in the case of multilayers where the dispersion of the phase shift is high and where calculated phase shifts may be in error due to poorly known layer thicknesses.
Third, the accuracy of measurements of unknown wavelengths can be improved somewhat. The basic reason is that for high reflection mirrors, wavelengths of feco can be measured to about ±0.002 order, whereas the error in determining fractions in Fabry-Perot patterns is about ±0.01 order. This difference is due primarily to the fact that feco are obtained from a very small area of the plate. Small departures from flatness of the substrate surface do not reduce the sharpness of the feco. On the other hand, the Fabry-Perot fringes result from interference over the entire aperture, and variations in the surface reduce the fringe sharpness. In return for the gain in precision afforded by the feco the necessary precaution is that the variation in phase shift dispersion across the aperture is sufficiently small.
Acknowledgments
The author benefited from many discussions with J. B. Saunders. Karl Nefflen kindly loaned much equipment. Calculations of wavelength were very much easier as a result of an IBM 704 program modified for this purpose by Stanley Prusch. The aluminum coatings were prepared by W. L. Griffith, Jr. Finally, the author is grateful to the National Academy of Sciences—National Research Council and to the National Bureau of Standards for the postdoctoral research associateship under which this work was performed.
9. Appendix
9.1. Derivation of Equation (28)
It is to be shown that for an arbitrary integer q and for integers, rj, selected as described, the differences(rj+fj) λj−τq (λj) are equal to 2 (t−t′). To both sides of eq (19) we add the quantity (q−n) λ0.
Adding (q−n) λ1 to each side of eq (20) gives
Therefore the smooth curve connecting the points qλ0, (q+1) λ1, etc., is the continuous function
| (30) |
Now from eq (22) we obtain the relation
| (31) |
The integers ra, rb, etc., are selected so as to satisfy eq (27). Substitution of eq (31) and the corresponding equation for λb into eq (27) yields
or
| (32) |
Since r, m, q, and n are integers, the only general way in which eq (32) can be satisfied is ra−ma =rb−mb=q−n, in which case
| (33) |
where j stands for a, b, or c. Thus the difference between the etalon spacings can be determined, regardless of the phase shift dispersion and of the integer, q, which is arbitrarily selected.
9.2. Required Accuracy of Theoretical Phase Shift Curve
The phase shift curve must be known from theoretical calculations with a certain accuracy if the “true” order numbers are to be determined, as in section 5.1. We wish to show that the slope of the curve 2ϕ versus λ must be known to better than ±0.5.
With feco the criterion for selection of the true order number, n, for the fringe at λ0 is that the plot of nλ0 versus λ0, (n+1)λ1 versus λ1, etc., gives a curve τn(λ) which is parallel to 2ϕ(λ), i.e., τn(λ)=2t′+2ϕ (λ). The curve which results for an incorrect integer, q, is given by eq (30). Now the smallest possible error is one unit, i.e., q=n+1. Then by eq (30),
It is evident that at all values of λ the slope of the τn+1(λ) curve is greater by one than the slope of the τn(λ) curve. Thus the possible τq curves are a family of curves which at a given value of λ differ in slope by one. In order to make the correct selection of n, therefore, the slope of the 2ϕ(λ) curve should be known to better than ±0.5.
Similarly for Fabry-Perot data, the criterion for selection of the order numbers mj(j=a,b, or c) is that when the values of (mj+fj)λj are plotted against λj the points fall along a curve, A, parallel to 2ϕ(λ). If the integers, mj, are each increased by one, the resulting points (mj+1+fj)λj versus λj fall along a curve having a slope greater by one than curve A. Therefore in order to make the correct selection of mj, the slope of the 2ϕ(λ) curve should be known to better than ±0.5.
This is not a severe restriction, amounting to a maximum permissible uncertainty in ϵ=27πϕ/λ of about ±35° over the wavelength interval between 5000 and 6000 A. Therefore in most cases of metallic reflectors and multilayers the theoretical phase shift will be known accurately enough to calculate the true order numbers. When it is not known with sufficient accuracy, method II can be used.
Footnotes
Figures in brackets indicate the literature references on page. 199.
The integer v=1 was selected for simplicity. Some other authors select v=0, which makes ϕ represent a decrease of optical path of between λ/4 and λ/2. For an infinite wave train the two interpretations are physically identical. They do lead to different order numbers of interference.
The word “true” is in quotation marks because some authors use another convention for sign of the phase shift, which results in another order number. See section 2.
8. References
- 1.Fabry Ch, Buisson H. J phys. 1908;7:417. [Google Scholar]
- 2.Eversheim P. Ann Physik. 1909;30:815. [Google Scholar]
- 3.Meggers WF. Bull BS. 1915;12:198. [Google Scholar]
- 4.Bauer J. Ann Physik. 1934;20:481. [Google Scholar]
- 5.Jackson CV. Trans Roy Soc (London) 1936;A236:1. [Google Scholar]
- 6.Meissner KW. J Opt Soc Am. 1941;31:405. [Google Scholar]
- 7.Barrell H, Teasdale-Buckell P. Proc Phys Soc (London) 1951;B64:413. [Google Scholar]
- 8.Rank DH, Bennett HE. J Opt Soc Am. 1955;45:69. [Google Scholar]
- 9.Schulz LG. J Opt Soc Am. 1951;41:261, 1047. [Google Scholar]
- 10.Koehler WF. J Opt Soc Am. 1953;1955;4345:738. 934. [Google Scholar]
- 11.Koester CJ. J Opt Soc Am. 1958;48:255. [Google Scholar]
- 12.Michelson AA, Benoit R. Trav et Mem Bur Int Pds Mes. 11:1895. [Google Scholar]
- 13.Candler C. Modern interferometers. Hilger and Watts, Ltd; London, England: 1951. p. 117. [Google Scholar]
- 14.Rolt FH, Barrell H. Proc Roy Soc (London) 1929;A122:122. [Google Scholar]
- 15.Cartwright CH, Turner AF. Phys Rev. 1939;55:1128(A). [Google Scholar]
- 16.Dufour C. Ann phys. 1951;6:5. [Google Scholar]
- 17.Jarrett AH. Nature. 1952;169:790. [Google Scholar]
- 18.Giacomo P. Rev optique. 1956;35:317. [Google Scholar]
- 19.Baumeister PW, Stone JM. J Opt Soc Am. 1956;46:228. [Google Scholar]
- 20.Baumeister PW, Jenkins FA. J Opt Soc Am. 1957;47:57. [Google Scholar]
- 21.Childs WHJ. J Sci Instr. 1926;3:129. [Google Scholar]
- 22.Candler C. Modern interferometers. Hilger and Watts, Ltd; London, England: 1951. p. 118. [Google Scholar]
- 23.Pohl RW. Optik. Springer; Berlin: 1940. p. 148. [Google Scholar]
- 24.Schulz LG. J Opt Soc Am. 1954;44:357. [Google Scholar]
- 25.Schulz LG, Tangherlini FR. J Opt Soc Am. 1954;44:362. [Google Scholar]
- 26.Herpin A. Compt rend. 1947;225:182. [Google Scholar]
- 27.Muchmore RB. J Opt Soc Am. 1948;38:20. [Google Scholar]
- 28.Abelés F. Ann phys. 1950;5:596, 706. [Google Scholar]
- 29.Koehler WF. J Opt Soc Am. 1955;45:934. [Google Scholar]
- 30.Tolansky S. Multiple-beam interferometry of surfaces and films. Oxford Univ Press; NY: 1948. p. 96. [Google Scholar]
- 31.Bruce CF. Wavelength data and correction tables for length interferometry. Nat. Standards Lab., C.S.I.R.O; Australia: 1956. (tech paper no 8). [Google Scholar]
- 32.Schulz LG, Scheibner EJ. J Opt Soc Am. 1950;40:761. [Google Scholar]
- 33.Hass G, Ramsey JB, Thun R. J Opt Soc Am. 1958;48:324. [Google Scholar]
- 34.Stanley RW, Meggers WF. J Research NBS. 1957;58:41. [Google Scholar]
- 35.Holden J. J Opt Soc Am. 1951;41:504. [Google Scholar]
- 36.Cownie AR. J Opt Soc Am. 1957;47:132. [Google Scholar]
- 37.Giacomo P. J phys rad. 1958;19:307. [Google Scholar]