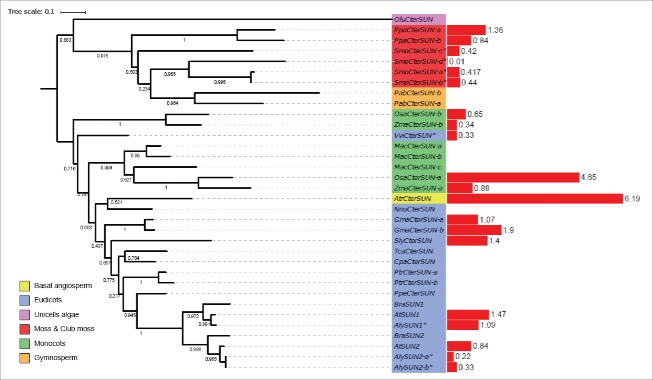
Figure 2.
Phylogenetic tree of Cter-SUN proteins and gene expression levels. Left: maximum likelihood tree of Cter-SUN protein homologues constructed from an alignment. Bootstrap values are presented. The color of the label shows the lineage of the plant. The gene label is constructed with the 3 letters from the species name (supplementary Table 4) and the gene name of the A. thaliana homologues. Right: red bar represents the value of the transcription level in seedlings expressed in RPKM, except for species indicated by *, the RNA-seq data was obtained from leaf tissue (Supplementary Table 2).

