

Abstract
Transcriptional enhancers are critical for maintaining cell-type–specific gene expression and driving cell fate changes during development. Highly transcribed genes are often associated with a cluster of individual enhancers such as those found in locus control regions. Recently, these have been termed stretch enhancers or super-enhancers, which have been predicted to regulate critical cell identity genes. We employed a CRISPR/Cas9-mediated deletion approach to study the function of several enhancer clusters (ECs) and isolated enhancers in mouse embryonic stem (ES) cells. Our results reveal that the effect of deleting ECs, also classified as ES cell super-enhancers, is highly variable, resulting in target gene expression reductions ranging from 12% to as much as 92%. Partial deletions of these ECs which removed only one enhancer or a subcluster of enhancers revealed partially redundant control of the regulated gene by multiple enhancers within the larger cluster. Many highly transcribed genes in ES cells are not associated with a super-enhancer; furthermore, super-enhancer predictions ignore 81% of the potentially active regulatory elements predicted by cobinding of five or more pluripotency-associated transcription factors. Deletion of these additional enhancer regions revealed their robust regulatory role in gene transcription. In addition, select super-enhancers and enhancers were identified that regulated clusters of paralogous genes. We conclude that, whereas robust transcriptional output can be achieved by an isolated enhancer, clusters of enhancers acting on a common target gene act in a partially redundant manner to fine tune transcriptional output of their target genes.
Distal regulatory elements are critical in establishing and maintaining tissue-specific transcriptional regulation of gene expression and are central in controlling cell identity. Furthermore, genome-wide association studies identifying disease and phenotypic trait-associated variants have found that the majority of these variants are within noncoding regions of the genome, suggesting regulatory activity (Maurano et al. 2012; Schaub et al. 2012). Further supporting this hypothesis are the observations that these noncoding regions overlap DNase I hypersensitive sites (DHSs) found in accessible chromatin and that the disease-associated variants often disrupt existing or create new transcription factor binding motifs. Alterations in regulatory DNA by large deletion or single mutation are known to cause disease and phenotypic alterations. For example, deletion of the hemoglobin subunit beta (HBB) locus control region (LCR) 50 kb upstream of the HBB gene causes β-thalassemia due to the inability of erythroid cells to produce mature globin (Kioussis et al. 1983; Tuan et al. 1989). As these critical regulatory sequences can be located tens to hundreds of kb away from the gene or genes they regulate, it can be challenging to identify regulatory elements and their target genes. A striking example of this is the limb enhancer that regulates the SHH (sonic hedgehog) gene. This enhancer is located 1 Mb away from the SHH gene in the intron of the LMBR1 gene, and point mutations in this enhancer are associated with preaxial polydactyly in humans (Lettice et al. 2003). These findings highlight the necessity for a mechanistic understanding of the distal regulatory elements that regulate gene transcription.
Several approaches have been used to identify transcriptional enhancers including: sequence-based approaches that rely on transcription factor motif identification, sequence conservation through evolution, co-activator binding (EP300 and Mediator), histone modifications, open chromatin, and approaches that combine multiple such features (Hallikas et al. 2006; Pennacchio et al. 2006; Heintzman et al. 2007; Visel et al. 2009; Chen et al. 2012; Ernst and Kellis 2012; Hoffman et al. 2012; Ballester et al. 2014). Despite these numerous efforts and the wealth of data generated by the ENCODE Project (The ENCODE Project Consortium 2012), only a fraction (26%) of enhancer predictions display enhancer activity in reporter assays (Kwasnieski et al. 2014). Mid- to high-throughput screening methods such as MPRA, STARR-seq, and FIREWACh, facilitate testing the activity of enhancers genome-wide in transiently, or in the case of FIREWACh, stably transfected cell lines (Melnikov et al. 2012; Arnold et al. 2013; Murtha et al. 2014); however, these assays do not test activity in the endogenous genomic context and therefore do not identify the regulated gene.
Recently, the concept of super-enhancers and stretch enhancers was proposed, and these regions were predicted to regulate cell identity genes and to confer higher expression on their target genes compared to regions termed typical enhancers (Hnisz et al. 2013; Loven et al. 2013; Parker et al. 2013; Whyte et al. 2013). Stretch enhancers are regions of ≥3 kb which exhibit an enhancer chromatin state based on the ChromHMM algorithm (Ernst et al. 2011; Parker et al. 2013). Super-enhancers have been predicted in numerous cell types where these regions have been identified by increased binding of the mediator protein MED1, enrichment of histone H3 K27 acetylation (H3K27ac), or binding of cell-type–specific transcription factors (Khan and Zhang 2016). The super-enhancer prediction involves bioinformatically stitching regions within 12.5 kb of one another in the linear genome; as a result, super-enhancers are, on average, longer than traditional enhancers, with a median size of 8.7 kb, and often contain more than one separate region which is bound by multiple transcription factors (Hnisz et al. 2013; Loven et al. 2013; Whyte et al. 2013). Although super-enhancers have been predicted in numerous cell types, few have been functionally investigated by deletion, and it remains unclear whether these predicted super-enhancers or stretch enhancers represent a novel paradigm in gene regulation separate from the traditional concept of enhancers (Pott and Lieb 2014). In fact, the two classic robust distal regulatory elements, the LCRs of the Hbb and hemoglobin subunit alpha (Hba) genes, are strikingly similar to super-enhancers; they contain multiple DHSs or are enhancer clusters (ECs), with each enhancer bound by multiple transcription factors (Grosveld et al. 1987; Tuan et al. 1989; Higgs et al. 1990; Chen et al. 1997; Mitchell et al. 2012). Furthermore, both the Hbb and Hba LCRs were recently determined to fit the bioinformatic criteria for super-enhancers (Hay et al. 2016).
The transcriptional regulatory networks that control cell identity of embryonic stem (ES) cells have been intensely studied, making mouse ES cells an ideal model for the study of transcriptional regulation. This knowledge has led to the development of numerous reprogramming strategies to generate induced pluripotent stem (iPS) cells in multiple species. Despite this knowledge, we lack a clear understanding of where in the genome the critical regulatory elements regulating pluripotency lie and how those elements function in their endogenous context. Advances in genome editing technology have provided the opportunity to characterize this regulatory landscape with greater fidelity. One example of this approach applied to ES cells is deletion of the enhancers surrounding the Sox2 gene. Two studies revealed that a cluster of predicted enhancer regions 100 kb downstream from the Sox2 gene, termed the Sox2 control region (SCR), are required for Sox2 transcription in mouse ES cells (Li et al. 2014; Zhou et al. 2014). The SCR overlaps a predicted super-enhancer and was found to be required for >85% of the transcript levels of Sox2 in ES cells. Similarly, other studies have revealed the role of select super-enhancers in gene regulation (Mansour et al. 2014; Hnisz et al. 2015; Hay et al. 2016; Huang et al. 2016; Shin et al. 2016). At the Sox2 locus, an additional super-enhancer was predicted surrounding the Sox2 gene; however, deletion of the enhancers within that region revealed that they are not required for Sox2 transcription in ES cells, thus raising questions about the super-enhancer prediction model (Zhou et al. 2014).
Results
Enhancer clusters containing multiple transcription factor-bound regions are robust in regulating transcription of their target genes
To study the regulatory role of clustered enhancers in mouse ES cells, we used a Cas9-mediated approach to delete ECs based on our ES cell enhancer prediction model which integrated EP300, H3K4me1, MED12, and NIPBL ChIP-seq data (Chen et al. 2012). Candidate regions were chosen containing at least two predicted enhancers within 25 kb of each other, each overlapping a MTL (multiple transcription factor-bound locus) bound by at least three ES cell expressed transcription factors from CODEX (Sanchez-Castillo et al. 2014). This approach identifies the functionally validated Sox2 distal enhancer (Li et al. 2014; Zhou et al. 2014) and 117 additional regions with regulatory potential, 71 of which overlap predicted super-enhancers in ES cells identified based on the intensity of the MED1 ChIP-seq signal (Supplemental Table S1; Whyte et al. 2013); from this list, candidates that overlap a super-enhancer and contain additional predicted enhancers, or that were bound by additional transcription factors, were prioritized for deletion (Table 1). To study the effect of enhancer deletion while avoiding potential confounding effects, targeted deletions did not include gene coding regions (Hsu et al. 2006), core promoter (TSS ±100 bp) regions (Butler and Kadonaga 2002; Juven-Gershon and Kadonaga 2010), or CTCF-bound chromatin interaction domain boundaries (Dixon et al. 2012) but focused on regions bound by multiple ES cell expressed transcription factors from CODEX (Sanchez-Castillo et al. 2014). To identify the regulated gene in an unbiased manner, RNA-seq was carried out on clones carrying a heterozygous enhancer deletion in F1 mouse ES cells (Mus musculus129 × Mus castaneus). As there is a SNP between the two alleles on average every 125 bp in these cells, we are able to analyze allele-specific gene expression by RNA-seq. We found that in two cases, deletion of EC(Sall1) or EC(Tet1), EC deletion abrogated the majority of transcription of the target gene in cis to the deleted allele. This finding is similar to what we have previously shown for the SCR which controls only Sox2 transcription in ES cells (Zhou et al. 2014). For clones carrying the EC(Sall1) or EC(Tet1) deletion on the 129 allele, analysis of RNA-seq data revealed that, in each case, the only gene in the genome significantly affected was the expected target gene (Fig. 1). In the same clones, no effect on expression of the castaneus allele was observed (Supplemental Fig. S1). Allele-specific RT-qPCR of additional clones for both the Sall1 and Tet1 EC deletions confirmed the results of the allele-specific RNA-seq and revealed that the EC was responsible for >80% of transcription of its target gene (Fig. 1C,F; Table 1). For all other deletions initially conducted (Table 1; Supplemental Figs. S2, S3), changes in target gene expression after enhancer deletion were more subtle and did not reach significance when considering all genes throughout the genome.
Table 1.
Variable effects of enhancer cluster deletion on gene expression in embryonic stem cells
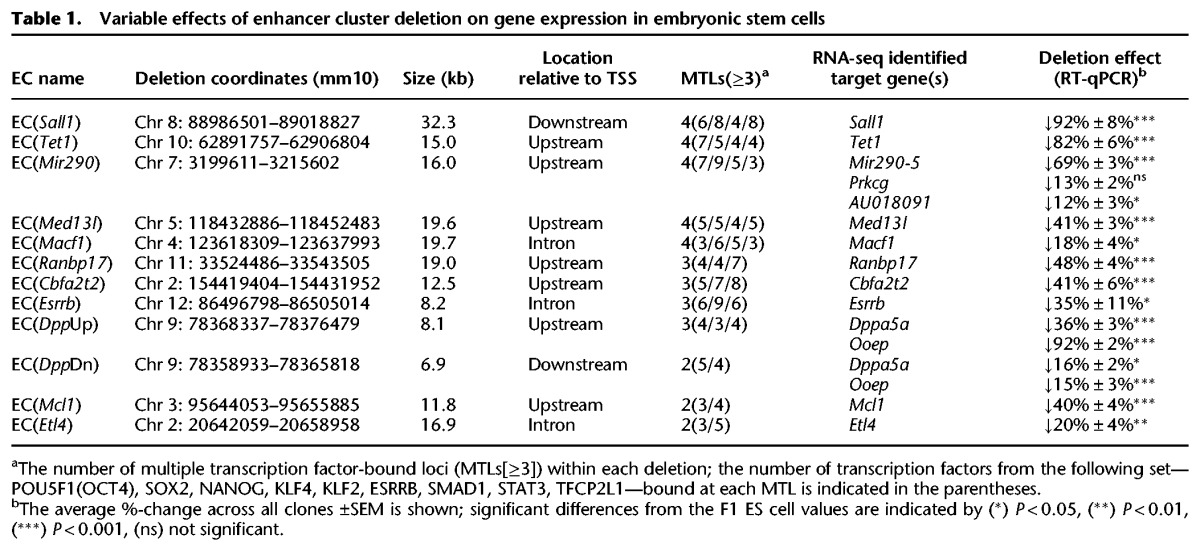
Figure 1.
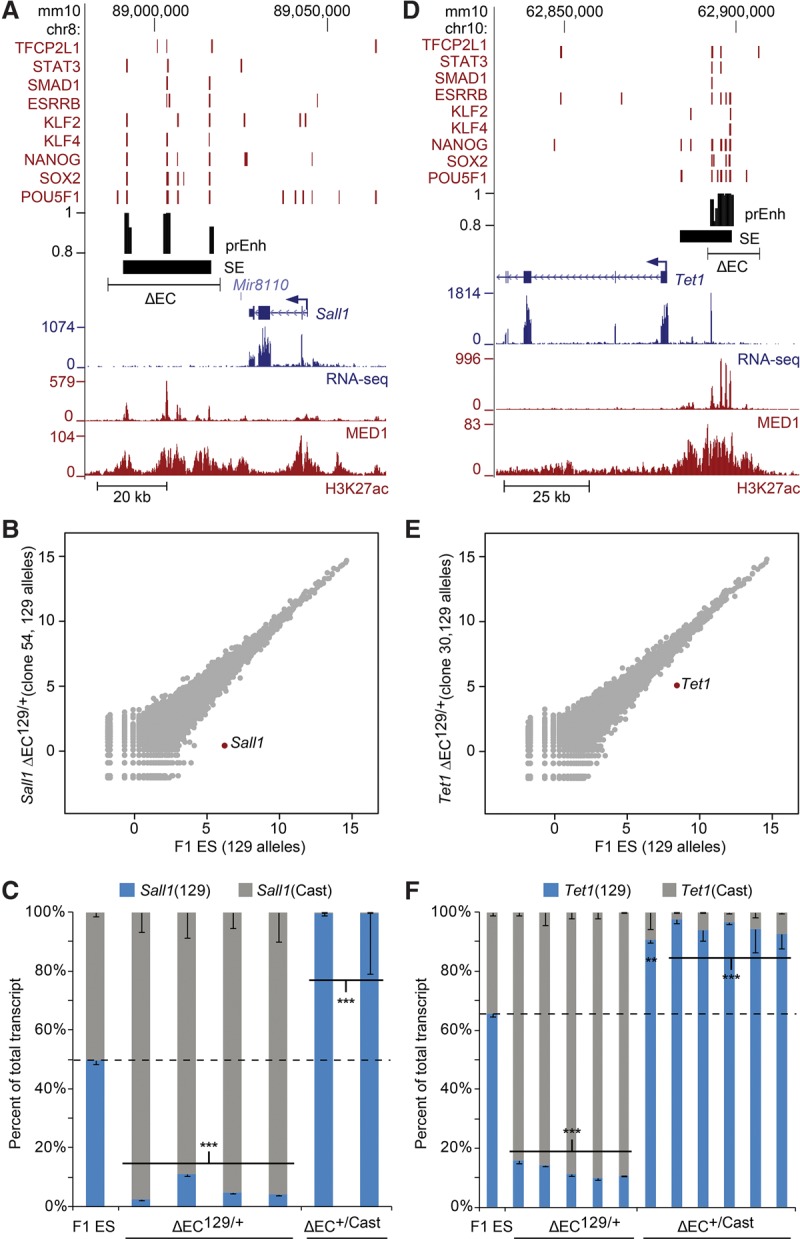
Enhancer clusters are required for transcription of their target genes. (A,D) Schematic representation of the Sall1 (A) and Tet1 (D) loci. Transcription factor bound regions (red bars), MED1 and H3K27ac ChIP-seq and RNA-seq data obtained from the CODEX database are shown. Predicted enhancers (prEnh) and called super-enhancers (SEs) are shown in black. Each deleted enhancer cluster (ΔEC) is designated by a line that links the 5′ and 3′ gRNA targets. All data are displayed on the mm10 assembly of the University of California at Santa Cruz (UCSC) Genome Browser. (B,E) Allele-specific RNA-seq analysis reveals EC specificity for cis-regulation of Sall1 (B) and Tet1 (E). Scatter plots indicate differences in 129 transcript abundance between F1 ES cells and the ΔEC129/+ clones. Transcript levels are log2-transformed reads per million. In each scatter plot, the EC target gene is highlighted in red. (C,F) Deletion of the EC dramatically reduces expression of the linked Sall1 (C) or Tet1 (F) allele. Allele-specific primers detect 129 or Cast RNA in RT-qPCR from F1 ES, ΔEC129/+, and ΔEC+/Cast clones. Expression for each allele is shown relative to the total. Error bars represent SEM. Significant differences from the F1 ES values are indicated: (**) P < 0.01, (***) P < 0.001.
Other studies have shown that regulatory enhancer-gene interactions are restricted to regions within individual topologically associating domains (TADs) (Dixon et al. 2012; Dowen et al. 2014; Schoenfelder et al. 2015). In cases where gene expression changes were more subtle than those observed for Sall1 and Tet1, we restricted our analysis of the RNA-seq data to the TAD in which the deletion was made. In most cases, deletion of the EC significantly reduced the expression of only one gene within the TAD in cis to the EC deletion (Supplemental Table S2). We did identify two cases, the enhancers surrounding Dppa5a and those upstream of Mir290, in which more than one gene was identified by RNA-seq as significantly reduced in cis to the EC deletion in all clones analyzed by RNA-seq (Supplemental Table S2). To confirm the effect on these target genes, we analyzed additional heterozygous deletion clones by RT-qPCR. For each deleted EC, the RT-qPCR analysis of additional clones revealed reduced expression of the target gene identified by RNA-seq in cis to the EC deletion (Supplemental Fig. S4). To determine the magnitude of the effect on target gene transcription, we calculated the average percent change compared to wild-type F1 ES cells for all clones obtained from each EC deletion and found that the effect of EC deletion varied in magnitude from 12% to 92% reduction in the transcript levels of the target gene (n ≥ 5 for each deletion) (Table 1). In the case of Etl4, the super-enhancer spans an exon, and MTLs are located on each side. The effect of EC deletion was a 20% reduction in transcript levels (Table 1; Supplemental Fig. S3). Further deletion of the additional enhancer did not further significantly reduce the expression of Etl4 (ΔEC + ΔE ↓18% ± 3% [P < 0.01] compared to F1 ES). In the case of the enhancers surrounding Dppa5a (EC[DppUp] and EC[DppDn]), RT-qPCR analysis of additional heterozygous clones confirmed the effect of the deletion on both Dppa5a and Ooep (Supplemental Fig. S4; Table 1). For EC(Mir290), although RNA-seq analysis suggested a role in the regulation of Prkcg and AU018091 in addition to the 290–295 cluster of microRNAs, the effect was small (<15% reduction) and only confirmed as a significant effect by RT-qPCR analysis for AU018091 (Table 1).
Enhancer clusters allow for redundant control of their target genes
We found that the enhancer cluster EC(DppUp), which lies between the Dppa5a and Ooep genes, regulated both Dppa5a and Ooep in cis. We considered two alternatives for the mechanism underlying this observation: Either this region contained two distinct regulatory modules, one for Dppa5a and one for Ooep, or each of the enhancers within the cluster contributed to the expression of both genes. To differentiate between these two alternatives, we split the EC into two segments and deleted each individually (Fig. 2). The region closest to Ooep, EC(DppUpB), contains one MTL bound by four transcription factors, whereas the region closest to Dppa5a, EC(DppUpA), contains three separate MTLs. Reporter assays revealed that each of these regions contained an active enhancer (Fig. 2B). Deletion of the entire EC(DppUp) significantly affects the expression of both Dppa5a and Ooep, although the effect on Ooep is much greater (92% reduction compared to a 36% reduction). This trend was also observed for the partial deletions; deletion of either the “A” or “B” region of EC(DppUp) had no significant effect on the expression of Dppa5a and a more subtle effect on the expression of Ooep (31% and 27% reduction, respectively) compared to deletion of the entire EC (Fig. 2C). This indicates that each enhancer within the cluster does indeed contribute to the transcription of both genes and has partially redundant function. Of note, although the 5′ gRNA is located 150 bp upstream of the Dppa5a TSS, removal of the 4.8-kb EC(DppUpA) region does not affect promoter activity, as normal levels of Dppa5a transcript were observed (Fig. 2).
Figure 2.
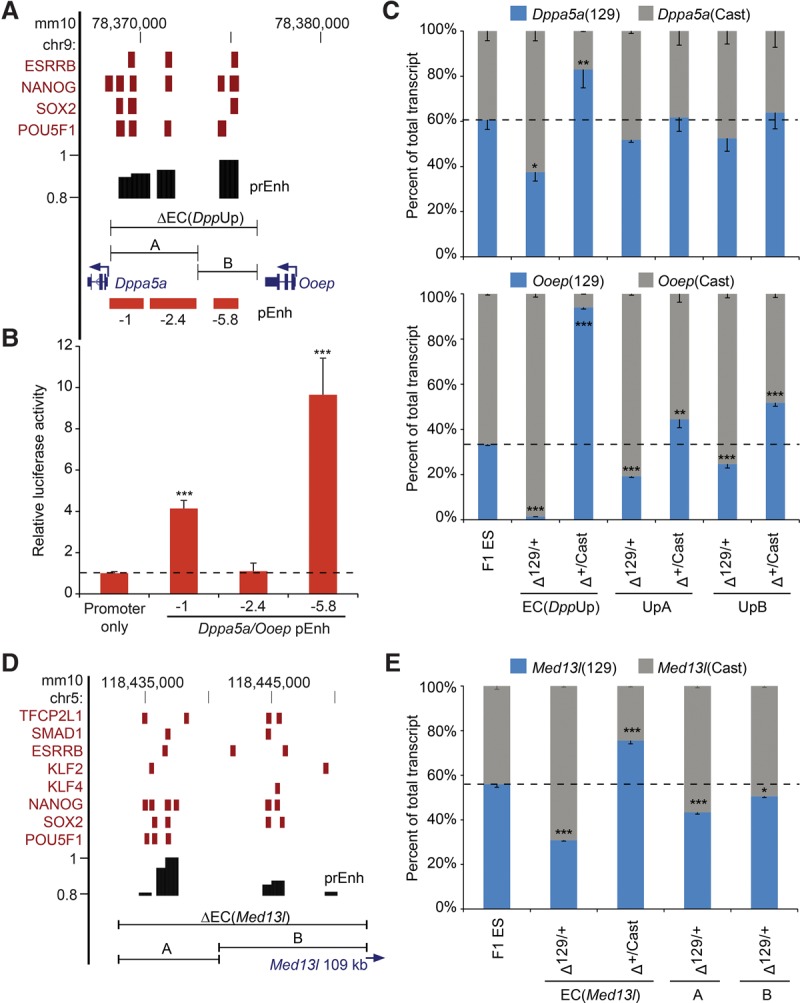
Partial enhancer cluster deletions reveal reduced effects on gene expression compared to larger deletions. (A,D) Schematic representation of Dppa5a/Ooep (A) and Med13l (D) EC regions. Transcription factor-bound regions (red bars) obtained from the CODEX database are shown. Predicted enhancers (prEnh) are shown in black. The deleted enhancer cluster (ΔEC) and partial deletions (A,B) are shown with a line that links the 5′ and 3′ gRNA targets. All data are displayed on the mm10 assembly of the UCSC Genome Browser. (B) Enhancer activity was identified in a reporter assay for the −1 enhancer and the −5.8 enhancer within the EC(DppUpA) and EC(DppUpB) regions, respectively. Error bars represent SEM. A significant difference from the promoter only vector is indicated: (***) P < 0.001. (C,E) Partial deletion of an EC has a reduced effect on expression of the linked Dppa5a/Ooep (C) or Med13l (E) allele compared to the full deletion. Allele-specific primers detect 129 or Cast RNA in RT-qPCR from F1 ES, Δ129/+, and Δ+/Cast clones. Expression for each allele is shown relative to the total. Error bars represent SEM. Significant differences from the F1 ES values are indicated: (*) P < 0.05, (**) P < 0.01, (***) P < 0.001.
To determine whether this partial redundancy in enhancer function was a common feature of ECs, we chose EC(Med13l) to investigate the effect of a partial EC deletion (Fig. 2D,E). In this case, Med13l is the only gene regulated by the EC (Supplemental Table S2) which lies over 100 kb upstream of the Med13l TSS (transcription start site). Similar to our results with EC(DppUp), we found that partial deletion of EC(Med13l) had a more subtle effect on Med13l transcription than did deletion of the entire EC. Whereas the full EC deletion caused a 41% reduction in Med13l expression, deletion of the “A” or “B” regions had a more subtle effect, with an average of 23% and 10% reduction, respectively. As with EC(DppUp), reporter assays revealed that each of the EC(Med13l) regions contained an active enhancer (Supplemental Fig. S5). These data suggest that partial redundancy in enhancer function may be a common feature in the regulation of genes controlled by multiple enhancers; however, these data also reveal the ability of each enhancer within the cluster to fine tune the expression levels of their target genes through contributing small enhancements in transcriptional output.
Transcriptional control of Dppa5a and Ooep by multiple enhancers flanking Dppa5a
At the Dppa5a/Ooep locus, we identified two enhancer clusters involved in the regulation of Dppa5a and Ooep (EC[DppUp] and EC[DppDn]). Individually, we found that EC(DppUp) contributed 36% of the transcriptional output of Dppa5a and 92% of the transcriptional output of Ooep, whereas EC(DppDn) contributed 16% of the transcriptional output of Dppa5a and 15% of the transcriptional output of Ooep (Table 1). We were not able to delete all of the enhancers at the same time with two gRNAs, as they surrounded the Dppa5a gene. As we found that individual enhancer regions within the EC(DppUp) and the EC(Med13l) coordinately regulated transcription of their target genes, we were next interested to understand how the two ECs surrounding Dppa5a may be functioning in a coordinated manner to regulate Dppa5a and Ooep. This entire region was called as one super-enhancer containing the Dppa5a gene, whereas our enhancer prediction denoted five enhancers surrounding Dppa5a. We introduced a deletion of EC(DppDn) into a clone that already contained an EC(DppUp) deletion on both alleles (Fig. 3). Strikingly, we found these combined deletions caused a further significant reduction in the transcript levels of both Dppa5a and Ooep to nearly undetectable levels (Fig. 3B). This occurs despite the fact that deletion of EC(DppDn) alone has only a modest effect on both Dppa5a (16% reduction) and Ooep (15% reduction) expression (Table 1). This finding indicates partially redundant control of Dppa5a and Ooep by enhancers in the upstream and downstream EC.
Figure 3.

Transcriptional control of Dppa5a and Ooep by multiple enhancers. (A) Schematic representation of the Dppa5a/Ooep locus. Transcription factor-bound regions (red bars), MED1 and H3K27ac ChIP-seq and RNA-seq data obtained from the CODEX database are shown. Predicted enhancers (prEnh) and called super-enhancers (SEs) are shown in black. The deleted enhancer clusters, ΔEC(DppUp) and ΔEC(DppDn), are shown with a line that links the 5′ and 3′ gRNA targets. All data are displayed on the mm10 assembly of the UCSC Genome Browser. (B) Deletion of EC(DppDn) in clones carrying a homozygous deletion of EC(DppUp) greatly affects expression of the linked Dppa5a and Ooep alleles. Allele-specific primers detect 129 or Cast RNA in RT-qPCR from F1 ES, Δ129/+, Δ+/Cast, and Δ129/Cast clones. Expression is shown relative to the F1 ES 129 value. Error bars represent SEM. Significant differences from the F1 ES values are indicated: (*) P < 0.05, (**) P < 0.01, (***) P < 0.001. Significant differences from the parent ΔEC-Up129/Cast clone are indicated: (ΟΟ) P < 0.01, (ΟΟΟ) P < 0.001.
A second predicted super-enhancer near Med13l lacks regulatory activity
We considered the possibility that previous deletions resulted in a more subtle effect on gene expression due to a similar redundancy in enhancer function as we observed at the Dppa5a/Ooep locus. The original deletion of EC(Med13l), which overlapped a predicted super-enhancer, was found to cause a 41% reduction in Med13l transcript levels, indicating that additional elements are able to maintain transcription of Med13l. To identify additional elements that may be regulating Med13l, we first investigated Hi-C and capture-Hi-C data to identify the regions interacting with the Med13l promoter. ES cell promoter capture-Hi-C defined a local interaction domain of 600 kb surrounding Med13l which corresponds to the TAD identified by Hi-C (Dixon et al. 2012; Schoenfelder et al. 2015). Within this interaction domain, the Med13l promoter interacts with EC(Med13l), and interactions are reduced upstream of the 5′end of this EC (Supplemental Fig. S6). Within the Med13l promoter interaction domain is another predicted super-enhancer which did not contain a predicted enhancer in our model; this region and the intervening region between the two called super-enhancers are sparsely bound by transcription factors (Fig. 4A). Of note, the capture-Hi-C data from Schoenfelder et al. (2015) indicated that none of the other gene promoters within the Med13l TAD displayed contact in ES cells to the more promoter proximal predicted super-enhancer, suggesting that this region was not functioning to regulate other genes within the Med13l TAD.
Figure 4.
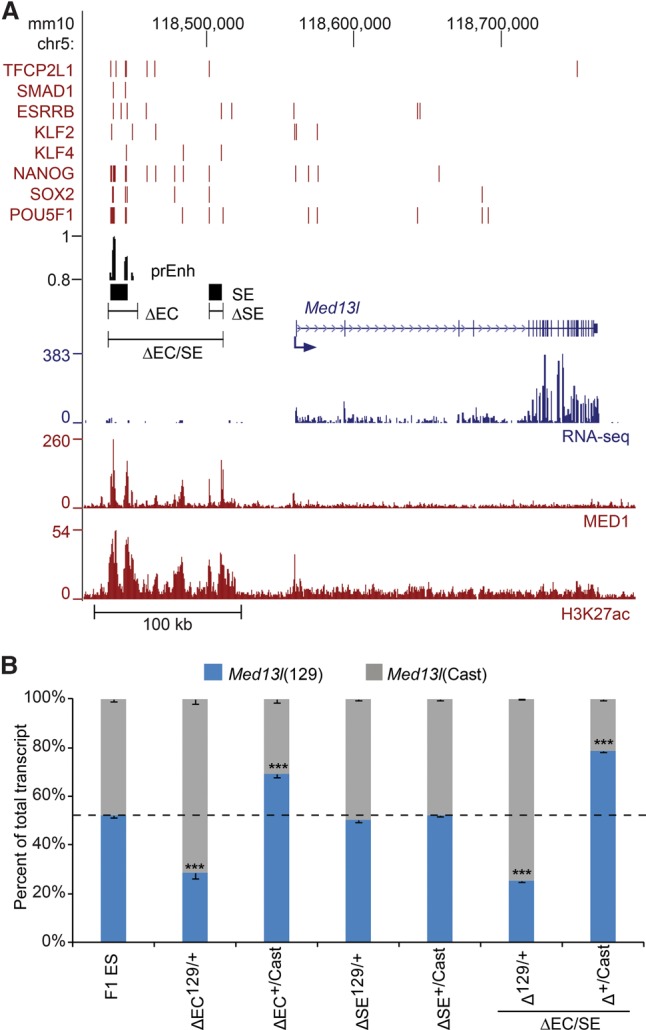
The Med13l locus contains a required enhancer cluster and a dispensable super-enhancer. (A) Schematic representation of Med13l locus. Transcription factor-bound regions (red bars), MED1 and H3K27ac ChIP-seq and RNA-seq data obtained from the CODEX database are shown. Predicted enhancers (prEnh) and called super-enhancers (SEs) are shown in black. The deleted regions (ΔEC and ΔSE) are shown with a line that links the 5′ and 3′ gRNA targets. All data are displayed on the mm10 assembly of the UCSC Genome Browser. (B) Deletion of ΔEC but not ΔSE significantly affects the expression of the linked Med13l allele. Allele-specific primers detect 129 or Cast RNA in RT-qPCR from F1 ES, Δ129/+, and Δ+/Cast clones. Expression for each allele is shown relative to the total. Error bars represent SEM. Significant differences from the F1 ES values are indicated: (***) P < 0.001.
To better understand the transcriptional mechanisms regulating Med13l, we carried out additional deletions within the upstream interaction domain for the Med13l promoter. We found that deletion of EC(Med13l) reduced transcription of Med13l by 41% in cis, whereas deletion of the predicted super enhancer 60 kb upstream of Med13l had no effect on Med13l transcription (Fig. 4B). To rule out any potential redundancy between the two predicted super-enhancers, we deleted the entire region containing both the EC and the super-enhancer, as well as the intervening region (ΔEC/SEs) (Fig. 4). We found that this deletion had an effect on Med13l transcript levels that was similar to deletion of EC(Med13l) alone, indicating that the second predicted super-enhancer does not contribute to transcription of Med13l in ES cells. This indicates that not all predicted super-enhancers are active in their endogenous context, a finding similar to what we have observed at the Sox2 locus where the enhancers within the super-enhancer flanking the Sox2 gene were not required for Sox2 transcription in ES cells (Zhou et al. 2014), although selected parts of this super-enhancer have been shown to be involved in Sox2 regulation in neural tissues (Ferri et al. 2004; Iwafuchi-Doi et al. 2011).
Robust enhancers separate from super-enhancers
As we found that deletion of some predicted super-enhancers had little (Macf1, Etl4) (Table 1) or no effect (the super-enhancer 60 kb upstream of Med13l) (Fig. 4) on the expression of proximal genes, we considered the possibility that the super-enhancer prediction model may not accurately describe the distal regulatory element repertoire required to maintain pluripotency in ES cells. We first compared our enhancer predictions and regions bound by multiple pluripotency-associated transcription factors (MTLs ≥ 5) to predicted super-enhancers (Whyte et al. 2013). We found that the majority of the super-enhancer set (88%) overlaps our predicted enhancers or MTLs ≥ 5 regions (Fig. 5A). The remaining 28 super-enhancers which do not overlap an MTL ≥ 5 or predicted enhancer may not represent active distal regulatory elements. A representative of this group is the super-enhancer located 60 kb upstream of the Med13l promoter which, when deleted, does not have any effect on Med13l expression (Fig. 4). In addition, 64% (18/28) of the super-enhancers which do not overlap an MTL ≥ 5 or predicted enhancer likely represent promoter elements, as they overlap a gene promoter (TSS ± 2 kb). We also noted that, although the super-enhancers were mostly contained within the set of our predicted enhancers and MTL ≥ 5 regions, 87% of the predicted enhancers and 81% of the MTL ≥ 5 regions were ignored by the super-enhancer predictions. This finding indicates that the super-enhancer predictions ignore a large proportion of potentially functional regulatory regions in ES cells.
Figure 5.
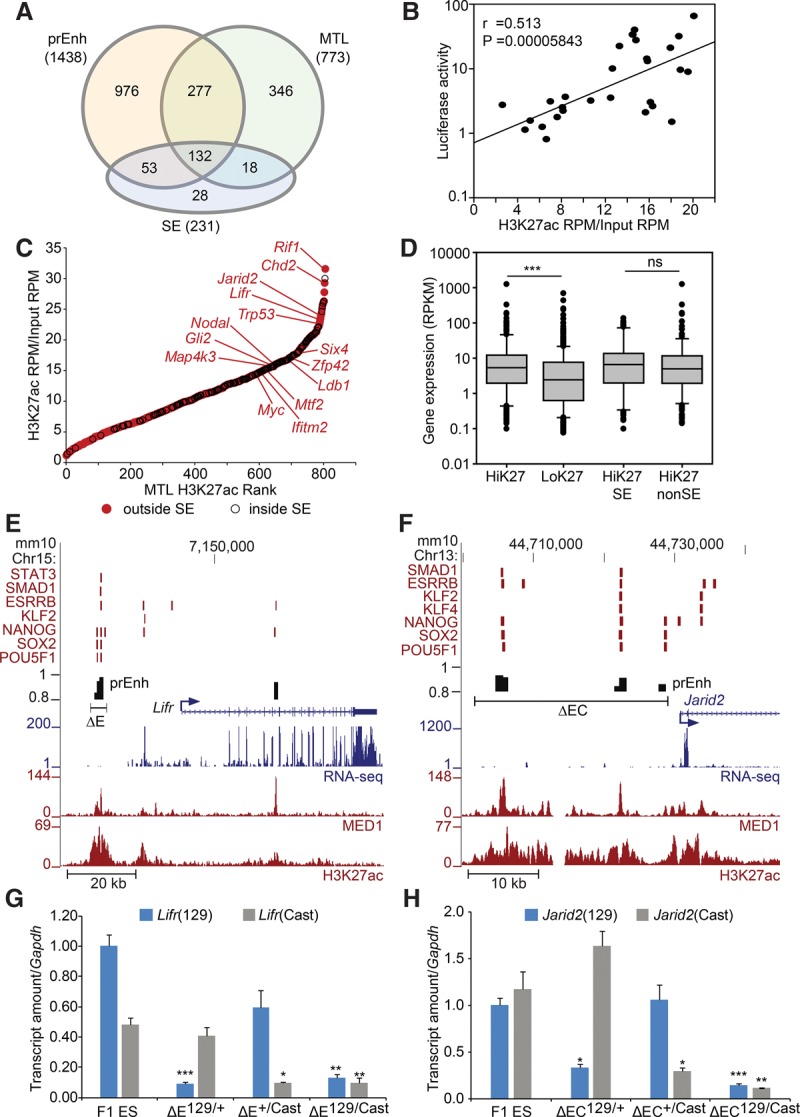
Robust enhancers separate from super-enhancers. (A) Venn diagram describing the overlap between predicted enhancers (prEnh), multiple transcription factor-bound loci (MTLs ≥ 5) and super-enhancers (SEs). (B) The significant correlation between enhancer activities in a luciferase reporter assay and the H3K27ac ChIP-seq signal at these enhancer regions. Pearson correlation coefficient (r) and significance level (P) are shown. (RPM) Reads per million. (C) MTLs outside and inside of super-enhancers were ranked according to the intensity of the H3K27ac signal within a region ±1 kb of the MTL midpoint. Genes predicted to be regulated by the indicated MTL regions located outside of super-enhancers (red) are shown. (D) MTLs with high H3K27ac (HiK27) are associated with significantly higher ([***] P < 0.001) expression of their target genes than MTLs with low H3K27ac (LoK27). There is no significant difference (ns) between the expression of associated genes for MTL with high H3K27ac found inside (HiK27SE) or outside of super-enhancer (HiK27nonSE) regions. (E,F) Schematic representation of the Lifr and Jarid2 loci. Transcription factor bound regions (red bars), MED1 and H3K27ac ChIP-seq and RNA-seq data obtained from the CODEX database are shown. Predicted enhancers (prEnh) are shown in black. The deleted regions (ΔE and ΔEC) are shown with a line that links the 5′ and 3′ gRNA targets. All data are displayed on the mm10 assembly of the UCSC Genome Browser. (G,H) Deletion of the Lifr enhancer (ΔE) or the Jarid2 enhancer cluster (ΔEC) significantly affects the expression of the linked allele. Allele-specific primers detect 129 or Cast RNA in RT-qPCR from F1 ES, Δ129/+, and Δ+/Cast and Δ129/Cast clones. Expression is shown relative to the F1 ES 129 value. Error bars represent SEM. Significant differences from the F1 ES values are indicated: (*) P < 0.05, (**) P < 0.01, (***) P < 0.001.
In other cell types, super-enhancers have been predicted based on the magnitude of the H3K27ac ChIP signal (Chapuy et al. 2013; Hnisz et al. 2013; Khan and Zhang 2016). H3K27ac has been suggested as an active enhancer feature (Creyghton et al. 2010); however, correlation between the magnitude of the H3K27ac ChIP signal at specific regions and enhancer activity has not been tested. To investigate correlation between enhancer activity and ChIP-seq signals for features often used to predict enhancer regions (H3K27ac, EP300, and MED1), we cloned predicted enhancer regions and investigated their enhancer activity in a luciferase reporter assay. We found that the best correlation to enhancer activity was indeed the magnitude of the H3K27ac ChIP-seq signal (H3K27ac RPM/input) at the cloned enhancer region (Pearson correlation coefficient r = 0.513) (Fig. 5B). The magnitude of the MED1 or EP300 ChIP-seq signal showed comparatively lower correlation to enhancer activity (Pearson correlation coefficient r = 0.405 and r = 0.329, respectively) (Supplemental Fig. S7). Based on this, we ranked individual MTL ≥ 5 regions according to the magnitude of the H3K27ac ChIP-seq signal in the 2 kb surrounding the MTL midpoint and separated these MTLs into two groups: those found inside super-enhancers and those found outside of super-enhancers (Fig. 5C; Supplemental Table S3). Surprisingly, we found that individual MTL ≥ 5 regions found outside of super-enhancers displayed a similar range in magnitude of the H3K27ac signal as did the ones within super-enhancers. In addition, some of the individual MTLs with the highest H3K27ac signal were regions outside of super-enhancers. As we also found correlation between the H3K27ac ChIP-seq signal magnitude and enhancer activity; this finding suggested that many regions outside of super-enhancers have similar, or higher, regulatory activity than super-enhancers.
To further investigate regulatory activity within the set of non-super-enhancer MTL ≥ 5 regions, we paired each MTL to the nearest TSS of an ES cell expressed gene (RPKM ≥ 0.075). Based on our enhancer luciferase data, we determined that regions with an H3K27ac ChIP-seq signal higher than 14-fold RPM enrichment over input were likely to have strong enhancer activity. We used this finding to separate MTL ≥ 5 regions into high and low H3K27ac regions (HiK27/LoK27). Consistent with our luciferase data, we found that HiK27 regions were associated with genes that were significantly more highly expressed in ES cells compared to LoK27 (Fig. 5D). We further subdivided the set of HiK27 regions into those found inside a super-enhancer (HiK27SE) and those outside a super-enhancer (HiK27nonSE) and found that there was no significant difference between gene expression levels for these groups. These observations indicate that the MTLs which are separate from super-enhancers are equally as likely to be associated with a highly expressed gene as the MTLs contained within super-enhancers (Supplemental Table S3).
Within the HiK27nonSE set, we identified several MTLs with predicted target genes important for ES cell and chromatin maintenance. Using GeneMANIA (Mostafavi et al. 2008), we identified overrepresented gene sets with functions in stem cell maintenance and differentiation (Rif1, Lifr, Nodal, Ldb1, Cnot2, Chd2, Tcf7l1, Rbpj, and Cfl1) and the Polycomb group (PcG) protein complex (Jarid2, Mtf2, Rbbp7, and Rybp), which is important for maintaining repressed and bivalent chromatin marks at genes associated with ES cell differentiation (Supplemental Table S4; Leeb and Wutz 2007; Pasini et al. 2007; Shen et al. 2008). We also identified highly expressed genes involved in signaling (Map4K3, Epha4, Epha2, and Tle4) and transcription (Trp53, Myc, Zfp42, Aff1, Arid5b, Six4, Rai1).
To test whether the HiK27nonSEs have significant regulatory activity, we chose two regions which contained both a predicted enhancer in our model and at least one MTL but did not overlap a predicted super-enhancer (Fig. 5E,F). One of these regions, a small region of <5 kb containing one MTL, lies upstream of the leukemia inhibitory factor receptor gene (Lifr), a gene involved in pluripotency maintenance (Hirai et al. 2011). The other region lies upstream of Jarid2 and is an extended EC containing three separate regions with predicted enhancer activity, two of which contain MTLs. In both cases, we found that the deletion caused a significant reduction in transcription of the target gene, with levels reduced by 90% or 88% for Lifr and Jarid2, respectively (Fig. 5G,H). This effect is comparable to the effects we saw for deletion of the two super-enhancers (Sall1 and Tet1) which had the most significant deletion-mediated effect on the expression of their target genes. Together, these data reveal the functional importance of the HiK27nonSE regions and indicate that the super-enhancer predictions ignore important regulatory elements with robust enhancer activity by focusing on linear clustering in the genome.
Coordinated regulation of paralogs in a gene cluster
In the case of the predicted enhancers surrounding Dppa5a, we found that multiple regions coordinately regulate two genes, Dppa5a and Ooep. Dppa5a and Ooep belong to a family of structurally related proteins that are characterized by an atypical KH domain (Pierre et al. 2007; Wang et al. 2012). To investigate the possibility that other clusters of related genes may be coordinately regulated, we looked for related genes linked to enhancers in the set of high H3K27ac MTL ≥ 5 and identified two sets of gene paralogs: Ifitm and Six; notably, these enhancers did not overlap a predicted super-enhancer (Whyte et al. 2013).
The mouse Ifitm gene cluster on Chromosome 7 contains five paralogs, three of which (Ifitm1, Ifitm2, and Ifitm3) are expressed in ES cells (Fig. 6A) and are involved in germ cell development (Tanaka et al. 2005; Lange et al. 2008). The Six family members are involved in embryonic development of multiple organs (Li et al. 2002; Xu et al. 2003; Konishi et al. 2006). In the mouse genome, the Six gene cluster on Chromosome 12 contains three paralogs, two of which (Six1, Six4) are expressed in ES cells (Fig. 6B). Similar to the phylogenetically related Dppa5a and Ooep genes, both the Ifitm and Six genes display evidence for their co-evolution, as their synteny has been maintained across several vertebrate species (Ozaki et al. 1999; Hickford et al. 2012; Zhang et al. 2012).
Figure 6.
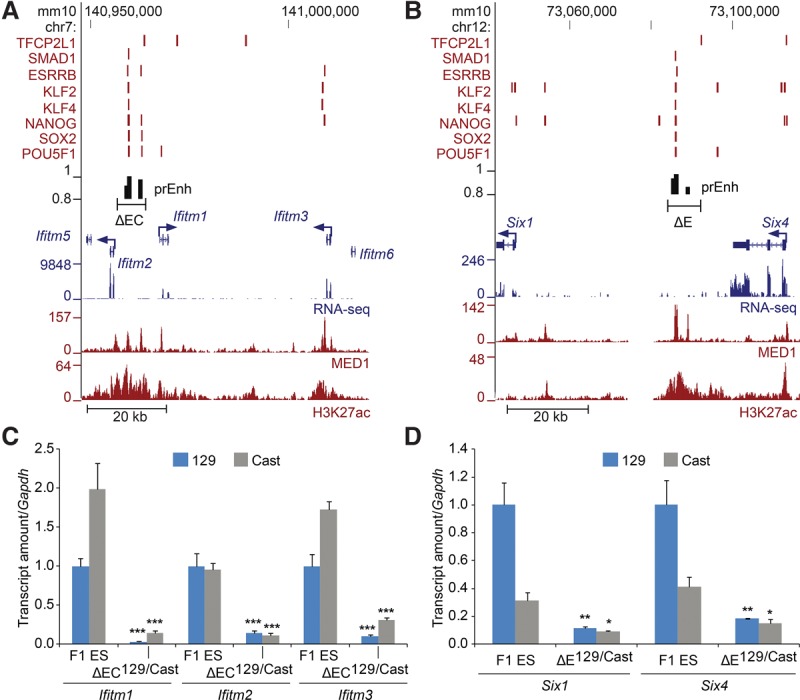
Coordinate control of paralogs in a gene cluster. (A,B) Schematic representation of the Ifitm and Six loci. Transcription factor-bound regions (red bars), MED1 and H3K27ac ChIP-seq and RNA-seq data obtained from the CODEX database are shown. Predicted enhancers (prEnh) are shown in black. The deleted regions (ΔEC and ΔE) are shown with a line that links the 5′ and 3′ gRNA targets. All data are displayed on the mm10 assembly of the UCSC Genome Browser. (C,D) Deletion of the Ifitm enhancer cluster (ΔEC) or the Six enhancer (ΔE) significantly affects transcription of the expressed genes in the cluster. Allele-specific primers detect 129 or Cast RNA in RT-qPCR from F1 ES and Δ129/Cast clones. Expression is shown relative to the F1 ES 129 value. Error bars represent SEM. Significant differences from the F1 ES values are indicated: (*) P < 0.05, (**) P < 0.01, (***) P < 0.001.
Both the Ifitm and Six gene clusters include at least one predicted enhancer containing an MTL; the Ifitm EC contains two MTLs separated by 2.6 kb, whereas the Six enhancer contains one MTL bound by seven transcription factors. To evaluate the potential regulatory roles of these regions on the genes that surround them, we deleted each region and evaluated the consequent changes in expression of the expressed genes within the gene cluster. Deleted clones containing a homozygous (Fig. 6C,D) or heterozygous (Supplemental Fig. S8) deletion revealed that indeed all the expressed genes in the gene cluster were regulated by the EC or enhancer. Furthermore, the reduction in expression was 59%–86% and 73%–90%, respectively, for the expressed genes within the Ifitm and Six gene clusters, revealing regulatory activity similar to the Lifr and Jarid2 non-super-enhancer distal regulatory regions we identified. Taken together, these data reveal that enhancers have regulatory activity which is as intense as the most active super-enhancers and furthermore, that regulatory control of multiple genes is not restricted to super-enhancer clusters.
Discussion
Algorithm-based enhancer prediction models such as ChromHMM, ROSE, MARGE, and super-enhancer predictions claim to identify enhancers controlling cell identity (Ernst and Kellis 2012; Loven et al. 2013; Whyte et al. 2013; Wang et al. 2016); however, the vast majority of these predictions remain functionally unexplored. This enhancer deletion study in ES cells revealed that, in some cases, transcriptional regulation of a single gene (Sall1, Tet1, Lifr, Jarid2) or gene cluster (Dppa5a/Ooep, Ifitm, and Six) was almost entirely dependent on the EC or isolated enhancer. This robust regulatory activity was found both for regions called as super-enhancers and for regions not called as super-enhancers in ES cells; however, all of the regions with higher regulatory activity (1) contained predicted enhancers from our model (Chen et al. 2012), (2) were bound by multiple transcription factors, and (3) displayed high H3K27ac for at least one of their MTL regions. We also identified several cases where over 60% of the transcript levels for the most affected target gene remained after EC deletion, indicating a wide range in the functionality of ECs and predicted super-enhancers.
Deletion of several enhancer regions revealed that they generally regulate the expression of one target gene in cis (11 of 15 cases); we did, however, find a few cases (four of 15) in which multiple genes were coregulated by common enhancers. This appeared to occur for clusters of related genes and was not a phenomenon restricted to super-enhancers. In the case of the super-enhancer surrounding Dppa5a, we found that multiple regions coordinately regulated both Dppa5a and Ooep. Dppa5a expression is an important marker of pluripotency which has been used to identify reprogrammed cells (Kim et al. 2005; Aoki et al. 2010; Lee et al. 2014). Although the prominent role of Ooep is in oocytes, it is also expressed in ES cells and coordinately regulated with Dppa5a during reprogramming (Tashiro et al. 2010; Tran et al. 2015). This coordinated regulation during reprogramming may be due to regulation of both genes by the same cluster of enhancers surrounding Dppa5a, characterized here by enhancer deletion analysis. Based on the coordinated regulation of Dppa5a and Ooep, whose expression products are structurally related proteins, we hypothesized that genes with common function or related origin may be similarly regulated by common enhancers; we identified two such clusters of genes: Ifitm and Six. Interestingly, these two enhancers were not in the set of regions previously identified as super-enhancers, indicating that control of gene clusters can be achieved by non-super-enhancer regions and even a single MTL region, as is the case for the enhancer within the Six locus.
In addition to the variable regulatory activity we observed for super-enhancers, we also found examples where single enhancers, or other regions not classified as super-enhancers, had regulatory activity that was as intense as a super-enhancer region; for example, the Lifr enhancer and the Sall1 super-enhancer have similar regulatory activity with respect to their target genes. Our enhancer deletion data, which revealed an equivalent regulatory role for enhancers compared to super-enhancers, are supported by recent computational analyses. Finucane et al. (2015) investigated links between classes of functional elements and the heritability of complex diseases and observed enrichment for SNPs located in enhancers but failed to find a significant difference between super-enhancers and enhancers. In addition, investigation into DHSs associated with changes in gene expression in hematopoietic cells at several differentiation stages revealed that super-enhancers were enriched in the set of DHSs linked to genes with dynamic expression levels across the differentiation process; however, super-enhancers accounted for only ∼30% of the identified regulatory regions predicted to drive the expression of this class of genes (Gonzalez et al. 2015). Our analysis also revealed that the super-enhancer prediction model in ES cells ignored 81% of the potentially active regulatory elements predicted by cobinding of five or more pluripotency-associated transcription factors. As we also found, through deletion analysis, that regions from this MTL group were indeed required for transcription of important genes in ES cells (Lifr, Jarid2, the Ifitm and Six gene clusters), we conclude that the super-enhancer prediction model ignores a large number of functional regulatory regions in ES cells and overemphasizes the importance of clustered enhancers compared to isolated enhancers.
Whereas our deletion data did not reveal increased regulatory activity of super-enhancers compared to enhancers, it did determine that these regions function in a partially redundant manner to control transcriptional output of their target genes. The dissection of two functional enhancer clusters determined that deletion of individual regions containing MTLs had a subtle effect on the one (Med13l) or two (Dppa5a/Ooep) genes they regulated. Had these regions been completely redundant enhancers, wild-type transcriptional output would have been maintained (Lam et al. 2015); therefore, the enhancers within the enhancer clusters that we studied acted in a partially redundant manner. Interestingly, we did not find a case where removal of one enhancer eliminated expression of the target gene. Similarly, individual deletion of three constituent enhancers of the Wap super-enhancer revealed their partially redundant role in regulating transcription of Wap (Shin et al. 2016). Furthermore, Hay et al. (2016) showed by deletions within the Hba super-enhancer that each constituent enhancer acts independently in an additive manner to regulate expression of Hba genes in vivo. In ES cells, deletion of Dppa5aEC-Up or Dppa5aEC-Dn alone caused only a 36% and 16% reduction, respectively, in the levels of Dppa5a; deletion of both regions caused a 99% reduction. Deletion of both enhancer regions has a greater effect than deletion of either region alone; this is contrary to synergistic action where both regions would together be required for high activity, and conversely, sole deletion of either element would greatly affect gene expression and produce a result more similar to the effect of deleting both elements together. In fact, for ECs studied here, the action of multiple enhancers was usually observed to be less than additive and therefore partially redundant. The one exception to this was the action of the EC(DppUp) region on Ooep. Loss of this region caused a 92% reduction in transcript levels for Ooep, and although the EC(DppDn) region was able to partially compensate for the loss of EC(DppUp) with respect to Dppa5a transcription, it has a more limited role in regulating Ooep. Functional redundancy of enhancers has been observed in other contexts; for example, in the Drosophila genome, they have been termed shadow enhancers and have been suggested to allow for evolutionary variation in expression levels or developmental patterns while maintaining critical expression of their target genes (Jeong et al. 2006; Hong et al. 2008; Frankel et al. 2010; Perry et al. 2010; Cannavo et al. 2016). In addition, redundant enhancers have been observed in mammalian genomes where they can function to coordinately maintain a critical threshold of expression and may in some cases buffer genetic variation across populations (Xiong et al. 2002; Werner et al. 2007; Corradin et al. 2014; Ruiz-Narvaez 2014; Lam et al. 2015). Based on our data, we propose that the ensemble of enhancers within a super-enhancer do not regulate higher transcription of their target genes compared to enhancers or act synergistically with each other but serve as partially redundant regulatory elements that allow for flexibility in cis-regulatory control that can fine tune transcriptional output of a target gene.
It is important to identify all regulatory regions active in a particular cell type and accurately assign the ensemble of enhancers to the gene or genes they regulate. As the super-enhancer prediction approach relies solely on genomic proximity for grouping elements and assigning them to a target gene, it is unlikely to account for the position variance in regulatory control possible for enhancer-type regulatory elements. Super-enhancers have been predicted by various algorithms which group together larger regions of relatively continuous H3K27ac signal or more discrete binding events such as enrichment of MED1 or transcription factor binding within a distance cutoff (Chapuy et al. 2013; Hnisz et al. 2013; Loven et al. 2013; Whyte et al. 2013). It is possible that by clustering enhancers simply by their position in the genome, separate enhancers required to regulate different genes could be grouped together. Conversely, enhancers which regulate the same gene or group of genes could be ignored as a regulatory cluster if they exceed the arbitrary distance cutoff employed. The Etl4 locus is a good example of this; the entire gene contains 11 MTL regions, three of which overlap the called super-enhancer (Supplemental Fig. S3). As we found that deletion of the three MTLs in the super-enhancer region only reduced transcription by 18%, it is possible that additional MTLs throughout the gene act in a redundant manner with these enhancers to activate transcription of Etl4. We propose that a more appropriate approach to predicting the ensemble of enhancers that coordinately regulate a specific gene or group of genes would first involve identifying individual enhancers using an integrative model (Chen et al. 2012; Ernst and Kellis 2012; Fernandez and Miranda-Saavedra 2012; Rajagopal et al. 2013), or the MTL approach (Chen et al. 2008; Yip et al. 2012), ranking their predicted strength using the magnitude of the H3K27ac signal and then assigning each enhancer to its target gene(s) based on either chromatin loop architecture data (Li et al. 2012; Hughes et al. 2014; Rao et al. 2014; Schoenfelder et al. 2015) or using a model that predicts enhancer-gene interactions (Corradin et al. 2014; Roy et al. 2016; Whalen et al. 2016). Regulatory predictions, however, must be followed by functional testing using an enhancer deletion approach to reveal the contribution each enhancer region makes to the regulation of a particular gene or group of genes.
Methods
Cas9-mediated deletion
Cas9-mediated deletions were carried out as previously described (Zhou et al. 2014; Moorthy and Mitchell 2016). Briefly, F1 mouse ES cells (M. musculus129 × M. castaneus, obtained from Barbara Panning) were cultured on 0.1% gelatin-coated plates in ES media (DMEM containing 15% FBS, 0.1 mM MEM nonessential amino-acids, 1 mM sodium pyruvate, 2 mM GlutaMAX, 0.1 mM 2-mercaptoethanol, 1000 U/mL LIF, 3 µM CHIR99021 [GSK3β inhibitor; Biovision], and 1 µM PD0325901 [MEK inhibitor; Invitrogen]), which maintains ES cells in a pluripotent state in the absence of a feeder layer (Mlynarczyk-Evans et al. 2006; Ying et al. 2008).
Cas9 targeting guides flanking predicted enhancer regions were selected (Supplemental Table S5). Only gRNAs predicted to have no off-target binding in the F1 mouse genome were chosen. Guide RNA plasmids were assembled using the protocol described by Mali et al. (2013). Briefly, two partially complementary 61-bp oligos were annealed and extended using Phusion polymerase (New England Biolabs). The resulting 100-bp fragment was assembled into an AflII-linearized gRNA empty vector (Addgene, ID#41824) using the Gibson assembly protocol (New England Biolabs). The sequence of the resulting guide plasmid was confirmed by sequencing.
F1 ES cells were transfected with 5 µg each of 5′ gRNA, 3′ gRNA, and pCas9_GFP (Addgene, ID#44719) (Ding et al. 2013) plasmids using the Neon Transfection System (Life Technologies). Forty-eight hours post-transfection, GFP-positive cells were collected and sorted on a BD FACSAria. Ten thousand to twenty thousand GFP positive cells were seeded on 10-cm gelatinized culture plates and grown for 5–6 d until large individual colonies formed. Colonies were picked and propagated for genotyping and gene expression analysis as previously described (Zhou et al. 2014; Moorthy and Mitchell 2016). Genotyping of enhancer deletions was done by qPCR with allele-specific primers. All deletions were confirmed by sequence analysis using primers 5′ of and 3′ from the gRNA target sites; SNPs within the amplified product confirmed the genotype of the deleted allele.
Allele-specific RNA-seq
Total RNA was isolated using TRIzol (Life Technologies), RNA was DNase I-treated, and sequencing libraries were prepared using the NEBNext mRNA Library Prep Reagent Set for Illumina and analyzed by multiplexed massively parallel sequencing (strand-specific paired-end 150 bp). Supplemental Table S6 contains a list of all clones analyzed by RNA-seq. Paired-end reads were mapped to the mouse genome using TopHat2 running Bowtie 2 (Langmead et al. 2009; Trapnell et al. 2009; Langmead and Salzberg 2012; Kim et al. 2013). To prevent allelic bias, mapping was carried out to the M. musculus129 or M. castaneus genome generated from the GRCm38/mm10 reference by SNP substitution using variant files provided by the Sanger Mouse Genomes Project (Keane et al. 2011). Mapped reads were split into 129, castaneus, or unknown using variant data to allow allele-specific quantification of transcripts. Only variant bases sequenced with Phred score > 20 (on standard 33 offset) were considered for allele calling. Transcript quantification and χ2 statistical analysis were done in SeqMonk (http://www.bioinformatics.babraham.ac.uk/projects/seqmonk/).
RNA isolation and gene expression analysis by RT-qPCR
Total RNA was purified from >85% confluent six-well plates using the RNeasy Plus Mini Kit (Qiagen), and an additional DNase I step was used to remove genomic DNA. RNA was reverse-transcribed with random primers using the high-capacity cDNA synthesis kit (Thermo Fisher Scientific).
Gene expression was monitored by qPCR using allele-specific primers that distinguish 129 from castaneus alleles (Supplemental Fig. S9). The standard curve method was used to calculate expression levels, with F1 ES cell genomic DNA used to generate the standard curves. In the case of Ifitm2 F1, genomic DNA produced nonspecific amplification products; F1 ES cell cDNA, which produced only the specific amplicon, was therefore used to generate the standard curve. Levels of Gapdh RNA were used to normalize expression values; primer sequences are shown in Supplemental Table S7. All samples were confirmed not to have DNA contamination by generating a reverse transcriptase negative sample and monitoring Gapdh amplification. Significant differences in gene expression between clones were determined by t-test.
Enhancer validation
Enhancers were predicted based on the method developed in Chen et al. (2012) with the following alteration: 1-kb regions were tiled by 700 bp across the genome, and predictions were made for each of these regions. Predictions above a probability of 0.8 were mapped to mm10 using liftOver (Supplemental Table S8). Activity of predicted enhancer candidates (primer sequences provided in Supplemental Table S9) was assayed using a dual luciferase reporter assay (Promega). The pGL4.23 vector was modified by replacing the Pmin promoter with a Pou5f1 promoter. The Pou5f1 promoter was amplified from mouse genomic DNA using the following primers: pPou5f1_F 5′-GCAGTGCCAACAGGCTTTGTGG-3′, pPou5f1_R 5′-CCATGGGGAAGGTGGGCACCCCGAGC-3′, and inserted into pJET1.2. The Pou5f1 promoter was removed from pJET1.2 with an XhoI/NcoI digest and inserted into pGL4.23 at the XhoI/NcoI sites after removal of the Pmin promoter by XhoI/NcoI digest. PCR-amplified enhancer candidates were inserted downstream from the firefly luciferase gene at the NotI site in the pGL4.23 vector and cotransfected with a Renilla luciferase encoding plasmid (pGL4.75) into F1 ES cells on 96-well plates. Luciferase activity (firefly/Renilla) was measured on the Fluoroskan Ascent FL plate reader. H3K27ac (GSE47949), MED1 (GSE22557), and EP300 (GSE28247) ChIP-seq data (Kagey et al. 2010; Handoko et al. 2011; Wamstad et al. 2012) for mouse ES cells were mapped using Bowtie (Langmead et al. 2009), and reads per million (RPM)/input for each factor was compared to luciferase activity data.
ES cell transcription factor ChIP-seq data for POU5F1(OCT4), SOX2, NANOG, KLF4, KLF2, ESRRB, SMAD1, STAT3, and TFCP2L1(TCFCP2L1) was obtained from the CODEX database (Sanchez-Castillo et al. 2014) and used to identify MTL regions. MTL ≥ 5 regions were obtained by identifying at least five unique factor ChIP-seq peak overlaps within 1 kb of the first peak. MTL regions were ranked by the intensity of the H3K27ac signal in the 2 kb surrounding the MTL midpoint. Gene expression data for F1 ES cells were obtained from our RNA-seq data by calculating RPKM (reads per kilobase per million) from all mapped reads; genes with an expression value of <0.075 RPKM were considered not expressed in ES cells.
Data access
The data from this study have been submitted to the NCBI Gene Expression Omnibus (GEO; http://www.ncbi.nlm.nih.gov/geo/) (Edgar et al. 2002) under accession number GSE79313.
Supplementary Material
Acknowledgments
We thank all the members of the Mitchell lab for helpful discussions and Chen Fan (Christina) Ji, Boris Dyakov, Hala Tamim El Jarkass, and Ghazal Haddad for their assistance in cloning gRNA and enhancer vectors. This work was supported by the Canadian Institutes of Health Research (111214), the Canada Foundation for Innovation, and the Ontario Ministry of Research and Innovation (operating and infrastructure grants held by J.A.M.). Studentship funding to support this work was provided by Connaught International Scholarships (G.S.), Ontario Trillium Scholarships (L.L.), and Ontario Graduate and Natural Sciences and Engineering Research Council of Canada Scholarships (V.M.S.).
Author contributions: J.A.M., S.D.M., and S.D. conceived and designed the experiments. S.D.M. conducted the CRISPR deletion and RT-qPCR analysis. S.D. and G.S. performed bioinformatics analysis. S.D., A.M., N.M.-G., and V.M.S. cloned and analyzed enhancer constructs in luciferase assays. L.L., V.S., and N.N.M. generated gRNA vectors and genotyped deleted clones. J.A.M., S.D.M., and S.D. wrote the manuscript. All authors participated in critical review of the manuscript and approved the final submitted version.
Footnotes
[Supplemental material is available for this article.]
Article published online before print. Article, supplemental material, and publication date are at http://www.genome.org/cgi/doi/10.1101/gr.210930.116.
References
- Aoki T, Ohnishi H, Oda Y, Tadokoro M, Sasao M, Kato H, Hattori K, Ohgushi H. 2010. Generation of induced pluripotent stem cells from human adipose-derived stem cells without c-MYC. Tissue Eng Part A 16: 2197–2206. [DOI] [PubMed] [Google Scholar]
- Arnold CD, Gerlach D, Stelzer C, Boryn LM, Rath M, Stark A. 2013. Genome-wide quantitative enhancer activity maps identified by STARR-seq. Science 339: 1074–1077. [DOI] [PubMed] [Google Scholar]
- Ballester B, Medina-Rivera A, Schmidt D, Gonzalez-Porta M, Carlucci M, Chen X, Chessman K, Faure AJ, Funnell AP, Goncalves A, et al. 2014. Multi-species, multi-transcription factor binding highlights conserved control of tissue-specific biological pathways. eLife 3: e02626. [DOI] [PMC free article] [PubMed] [Google Scholar]
- Butler JE, Kadonaga JT. 2002. The RNA polymerase II core promoter: a key component in the regulation of gene expression. Genes Dev 16: 2583–2592. [DOI] [PubMed] [Google Scholar]
- Cannavo E, Khoueiry P, Garfield DA, Geeleher P, Zichner T, Gustafson EH, Ciglar L, Korbel JO, Furlong EE. 2016. Shadow enhancers are pervasive features of developmental regulatory networks. Curr Biol 26: 38–51. [DOI] [PMC free article] [PubMed] [Google Scholar]
- Chapuy B, McKeown MR, Lin CY, Monti S, Roemer MG, Qi J, Rahl PB, Sun HH, Yeda KT, Doench JG, et al. 2013. Discovery and characterization of super-enhancer-associated dependencies in diffuse large B cell lymphoma. Cancer Cell 24: 777–790. [DOI] [PMC free article] [PubMed] [Google Scholar]
- Chen H, Lowrey CH, Stamatoyannopoulos G. 1997. Analysis of enhancer function of the HS-40 core sequence of the human α-globin cluster. Nucleic Acids Res 25: 2917–2922. [DOI] [PMC free article] [PubMed] [Google Scholar]
- Chen X, Xu H, Yuan P, Fang F, Huss M, Vega VB, Wong E, Orlov YL, Zhang W, Jiang J, et al. 2008. Integration of external signaling pathways with the core transcriptional network in embryonic stem cells. Cell 133: 1106–1117. [DOI] [PubMed] [Google Scholar]
- Chen CY, Morris Q, Mitchell JA. 2012. Enhancer identification in mouse embryonic stem cells using integrative modeling of chromatin and genomic features. BMC Genomics 13: 152. [DOI] [PMC free article] [PubMed] [Google Scholar]
- Corradin O, Saiakhova A, Akhtar-Zaidi B, Myeroff L, Willis J, Cowper-Sal lari R, Lupien M, Markowitz S, Scacheri PC. 2014. Combinatorial effects of multiple enhancer variants in linkage disequilibrium dictate levels of gene expression to confer susceptibility to common traits. Genome Res 24: 1–13. [DOI] [PMC free article] [PubMed] [Google Scholar]
- Creyghton MP, Cheng AW, Welstead GG, Kooistra T, Carey BW, Steine EJ, Hanna J, Lodato MA, Frampton GM, Sharp PA, et al. 2010. Histone H3K27ac separates active from poised enhancers and predicts developmental state. Proc Natl Acad Sci 107: 21931–21936. [DOI] [PMC free article] [PubMed] [Google Scholar]
- Ding Q, Regan SN, Xia Y, Oostrom LA, Cowan CA, Musunuru K. 2013. Enhanced efficiency of human pluripotent stem cell genome editing through replacing TALENs with CRISPRs. Cell Stem Cell 12: 393–394. [DOI] [PMC free article] [PubMed] [Google Scholar]
- Dixon JR, Selvaraj S, Yue F, Kim A, Li Y, Shen Y, Hu M, Liu JS, Ren B. 2012. Topological domains in mammalian genomes identified by analysis of chromatin interactions. Nature 485: 376–380. [DOI] [PMC free article] [PubMed] [Google Scholar]
- Dowen JM, Fan ZP, Hnisz D, Ren G, Abraham BJ, Zhang LN, Weintraub AS, Schuijers J, Lee TI, Zhao K, et al. 2014. Control of cell identity genes occurs in insulated neighborhoods in mammalian chromosomes. Cell 159: 374–387. [DOI] [PMC free article] [PubMed] [Google Scholar]
- Edgar R, Domrachev M, Lash AE. 2002. Gene Expression Omnibus: NCBI gene expression and hybridization array data repository. Nucleic Acids Res 30: 207–210. [DOI] [PMC free article] [PubMed] [Google Scholar]
- The ENCODE Project Consortium. 2012. An integrated encyclopedia of DNA elements in the human genome. Nature 489: 57–74. [DOI] [PMC free article] [PubMed] [Google Scholar]
- Ernst J, Kellis M. 2012. ChromHMM: automating chromatin-state discovery and characterization. Nat Methods 9: 215–216. [DOI] [PMC free article] [PubMed] [Google Scholar]
- Ernst J, Kheradpour P, Mikkelsen TS, Shoresh N, Ward LD, Epstein CB, Zhang X, Wang L, Issner R, Coyne M, et al. 2011. Mapping and analysis of chromatin state dynamics in nine human cell types. Nature 473: 43–49. [DOI] [PMC free article] [PubMed] [Google Scholar]
- Fernandez M, Miranda-Saavedra D. 2012. Genome-wide enhancer prediction from epigenetic signatures using genetic algorithm-optimized support vector machines. Nucleic Acids Res 40: e77. [DOI] [PMC free article] [PubMed] [Google Scholar]
- Ferri AL, Cavallaro M, Braida D, Di Cristofano A, Canta A, Vezzani A, Ottolenghi S, Pandolfi PP, Sala M, DeBiasi S, et al. 2004. Sox2 deficiency causes neurodegeneration and impaired neurogenesis in the adult mouse brain. Development 131: 3805–3819. [DOI] [PubMed] [Google Scholar]
- Finucane HK, Bulik-Sullivan B, Gusev A, Trynka G, Reshef Y, Loh PR, Anttila V, Xu H, Zang C, Farh K, et al. 2015. Partitioning heritability by functional annotation using genome-wide association summary statistics. Nat Genet 47: 1228–1235. [DOI] [PMC free article] [PubMed] [Google Scholar]
- Frankel N, Davis GK, Vargas D, Wang S, Payre F, Stern DL. 2010. Phenotypic robustness conferred by apparently redundant transcriptional enhancers. Nature 466: 490–493. [DOI] [PMC free article] [PubMed] [Google Scholar]
- Gonzalez AJ, Setty M, Leslie CS. 2015. Early enhancer establishment and regulatory locus complexity shape transcriptional programs in hematopoietic differentiation. Nat Genet 47: 1249–1259. [DOI] [PMC free article] [PubMed] [Google Scholar]
- Grosveld F, van Assendelft GB, Greaves DR, Kollias G. 1987. Position-independent, high-level expression of the human β-globin gene in transgenic mice. Cell 51: 975–985. [DOI] [PubMed] [Google Scholar]
- Hallikas O, Palin K, Sinjushina N, Rautiainen R, Partanen J, Ukkonen E, Taipale J. 2006. Genome-wide prediction of mammalian enhancers based on analysis of transcription-factor binding affinity. Cell 124: 47–59. [DOI] [PubMed] [Google Scholar]
- Handoko L, Xu H, Li G, Ngan CY, Chew E, Schnapp M, Lee CW, Ye C, Ping JL, Mulawadi F, et al. 2011. CTCF-mediated functional chromatin interactome in pluripotent cells. Nat Genet 43: 630–638. [DOI] [PMC free article] [PubMed] [Google Scholar]
- Hay D, Hughes JR, Babbs C, Davies JO, Graham BJ, Hanssen LL, Kassouf MT, Oudelaar AM, Sharpe JA, Suciu MC, et al. 2016. Genetic dissection of the α-globin super-enhancer in vivo. Nat Genet 48: 895–903. [DOI] [PMC free article] [PubMed] [Google Scholar]
- Heintzman ND, Stuart RK, Hon G, Fu Y, Ching CW, Hawkins RD, Barrera LO, Van Calcar S, Qu C, Ching KA, et al. 2007. Distinct and predictive chromatin signatures of transcriptional promoters and enhancers in the human genome. Nat Genet 39: 311–318. [DOI] [PubMed] [Google Scholar]
- Hickford D, Frankenberg S, Shaw G, Renfree MB. 2012. Evolution of vertebrate interferon inducible transmembrane proteins. BMC Genomics 13: 155. [DOI] [PMC free article] [PubMed] [Google Scholar]
- Higgs DR, Wood WG, Jarman AP, Sharpe J, Lida J, Pretorius IM, Ayyub H. 1990. A major positive regulatory region located far upstream of the human α-globin gene locus. Genes Dev 4: 1588–1601. [DOI] [PubMed] [Google Scholar]
- Hirai H, Karian P, Kikyo N. 2011. Regulation of embryonic stem cell self-renewal and pluripotency by leukaemia inhibitory factor. Biochem J 438: 11–23. [DOI] [PMC free article] [PubMed] [Google Scholar]
- Hnisz D, Abraham BJ, Lee TI, Lau A, Saint-Andre V, Sigova AA, Hoke HA, Young RA. 2013. Super-enhancers in the control of cell identity and disease. Cell 155: 934–947. [DOI] [PMC free article] [PubMed] [Google Scholar]
- Hnisz D, Schuijers J, Lin CY, Weintraub AS, Abraham BJ, Lee TI, Bradner JE, Young RA. 2015. Convergence of developmental and oncogenic signaling pathways at transcriptional super-enhancers. Mol Cell 58: 362–370. [DOI] [PMC free article] [PubMed] [Google Scholar]
- Hoffman MM, Buske OJ, Wang J, Weng Z, Bilmes JA, Noble WS. 2012. Unsupervised pattern discovery in human chromatin structure through genomic segmentation. Nat Methods 9: 473–476. [DOI] [PMC free article] [PubMed] [Google Scholar]
- Hong JW, Hendrix DA, Levine MS. 2008. Shadow enhancers as a source of evolutionary novelty. Science 321: 1314. [DOI] [PMC free article] [PubMed] [Google Scholar]
- Hsu F, Kent WJ, Clawson H, Kuhn RM, Diekhans M, Haussler D. 2006. The UCSC Known Genes. Bioinformatics 22: 1036–1046. [DOI] [PubMed] [Google Scholar]
- Huang J, Liu X, Li D, Shao Z, Cao H, Zhang Y, Trompouki E, Bowman TV, Zon LI, Yuan GC, et al. 2016. Dynamic control of enhancer repertoires drives lineage and stage-specific transcription during hematopoiesis. Dev Cell 36: 9–23. [DOI] [PMC free article] [PubMed] [Google Scholar]
- Hughes JR, Roberts N, McGowan S, Hay D, Giannoulatou E, Lynch M, De Gobbi M, Taylor S, Gibbons R, Higgs DR. 2014. Analysis of hundreds of cis-regulatory landscapes at high resolution in a single, high-throughput experiment. Nat Genet 46: 205–212. [DOI] [PubMed] [Google Scholar]
- Iwafuchi-Doi M, Yoshida Y, Onichtchouk D, Leichsenring M, Driever W, Takemoto T, Uchikawa M, Kamachi Y, Kondoh H. 2011. The Pou5f1/Pou3f-dependent but SoxB-independent regulation of conserved enhancer N2 initiates Sox2 expression during epiblast to neural plate stages in vertebrates. Dev Biol 352: 354–366. [DOI] [PubMed] [Google Scholar]
- Jeong Y, El-Jaick K, Roessler E, Muenke M, Epstein DJ. 2006. A functional screen for sonic hedgehog regulatory elements across a 1 Mb interval identifies long-range ventral forebrain enhancers. Development 133: 761–772. [DOI] [PubMed] [Google Scholar]
- Juven-Gershon T, Kadonaga JT. 2010. Regulation of gene expression via the core promoter and the basal transcriptional machinery. Dev Biol 339: 225–229. [DOI] [PMC free article] [PubMed] [Google Scholar]
- Kagey MH, Newman JJ, Bilodeau S, Zhan Y, Orlando DA, van Berkum NL, Ebmeier CC, Goossens J, Rahl PB, Levine SS, et al. 2010. Mediator and cohesin connect gene expression and chromatin architecture. Nature 467: 430–435. [DOI] [PMC free article] [PubMed] [Google Scholar]
- Keane TM, Goodstadt L, Danecek P, White MA, Wong K, Yalcin B, Heger A, Agam A, Slater G, Goodson M, et al. 2011. Mouse genomic variation and its effect on phenotypes and gene regulation. Nature 477: 289–294. [DOI] [PMC free article] [PubMed] [Google Scholar]
- Khan A, Zhang X. 2016. dbSUPER: a database of super-enhancers in mouse and human genome. Nucleic Acids Res 44: D164–D171. [DOI] [PMC free article] [PubMed] [Google Scholar]
- Kim SK, Suh MR, Yoon HS, Lee JB, Oh SK, Moon SY, Moon SH, Lee JY, Hwang JH, Cho WJ, et al. 2005. Identification of developmental pluripotency associated 5 expression in human pluripotent stem cells. Stem Cells 23: 458–462. [DOI] [PubMed] [Google Scholar]
- Kim D, Pertea G, Trapnell C, Pimentel H, Kelley R, Salzberg SL. 2013. TopHat2: accurate alignment of transcriptomes in the presence of insertions, deletions and gene fusions. Genome Biol 14: R36. [DOI] [PMC free article] [PubMed] [Google Scholar]
- Kioussis D, Vanin E, deLange T, Flavell RA, Grosveld FG. 1983. Β-globin gene inactivation by DNA translocation in γ β-thalassaemia. Nature 306: 662–666. [DOI] [PubMed] [Google Scholar]
- Konishi Y, Ikeda K, Iwakura Y, Kawakami K. 2006. Six1 and Six4 promote survival of sensory neurons during early trigeminal gangliogenesis. Brain Res 1116: 93–102. [DOI] [PubMed] [Google Scholar]
- Kwasnieski JC, Fiore C, Chaudhari HG, Cohen BA. 2014. High-throughput functional testing of ENCODE segmentation predictions. Genome Res 24: 1595–1602. [DOI] [PMC free article] [PubMed] [Google Scholar]
- Lam DD, de Souza FS, Nasif S, Yamashita M, Lopez-Leal R, Otero-Corchon V, Meece K, Sampath H, Mercer AJ, Wardlaw SL, et al. 2015. Partially redundant enhancers cooperatively maintain mammalian Pomc expression above a critical functional threshold. PLoS Genet 11: e1004935. [DOI] [PMC free article] [PubMed] [Google Scholar]
- Lange UC, Adams DJ, Lee C, Barton S, Schneider R, Bradley A, Surani MA. 2008. Normal germ line establishment in mice carrying a deletion of the Ifitm/Fragilis gene family cluster. Mol Cell Biol 28: 4688–4696. [DOI] [PMC free article] [PubMed] [Google Scholar]
- Langmead B, Salzberg SL. 2012. Fast gapped-read alignment with Bowtie 2. Nat Methods 9: 357–359. [DOI] [PMC free article] [PubMed] [Google Scholar]
- Langmead B, Trapnell C, Pop M, Salzberg SL. 2009. Ultrafast and memory-efficient alignment of short DNA sequences to the human genome. Genome Biol 10: R25. [DOI] [PMC free article] [PubMed] [Google Scholar]
- Lee DS, Shin JY, Tonge PD, Puri MC, Lee S, Park H, Lee WC, Hussein SM, Bleazard T, Yun JY, et al. 2014. An epigenomic roadmap to induced pluripotency reveals DNA methylation as a reprogramming modulator. Nat Commun 5: 5619. [DOI] [PMC free article] [PubMed] [Google Scholar]
- Leeb M, Wutz A. 2007. Ring1B is crucial for the regulation of developmental control genes and PRC1 proteins but not X inactivation in embryonic cells. J Cell Biol 178: 219–229. [DOI] [PMC free article] [PubMed] [Google Scholar]
- Lettice LA, Heaney SJ, Purdie LA, Li L, de Beer P, Oostra BA, Goode D, Elgar G, Hill RE, de Graaff E. 2003. A long-range Shh enhancer regulates expression in the developing limb and fin and is associated with preaxial polydactyly. Hum Mol Genet 12: 1725–1735. [DOI] [PubMed] [Google Scholar]
- Li X, Perissi V, Liu F, Rose DW, Rosenfeld MG. 2002. Tissue-specific regulation of retinal and pituitary precursor cell proliferation. Science 297: 1180–1183. [DOI] [PubMed] [Google Scholar]
- Li G, Ruan X, Auerbach RK, Sandhu KS, Zheng M, Wang P, Poh HM, Goh Y, Lim J, Zhang J, et al. 2012. Extensive promoter-centered chromatin interactions provide a topological basis for transcription regulation. Cell 148: 84–98. [DOI] [PMC free article] [PubMed] [Google Scholar]
- Li Y, Rivera CM, Ishii H, Jin F, Selvaraj S, Lee AY, Dixon JR, Ren B. 2014. CRISPR reveals a distal super-enhancer required for Sox2 expression in mouse embryonic stem cells. PLoS One 9: e114485. [DOI] [PMC free article] [PubMed] [Google Scholar]
- Loven J, Hoke HA, Lin CY, Lau A, Orlando DA, Vakoc CR, Bradner JE, Lee TI, Young RA. 2013. Selective inhibition of tumor oncogenes by disruption of super-enhancers. Cell 153: 320–334. [DOI] [PMC free article] [PubMed] [Google Scholar]
- Mali P, Yang L, Esvelt KM, Aach J, Guell M, DiCarlo JE, Norville JE, Church GM. 2013. RNA-guided human genome engineering via Cas9. Science 339: 823–826. [DOI] [PMC free article] [PubMed] [Google Scholar]
- Mansour MR, Abraham BJ, Anders L, Berezovskaya A, Gutierrez A, Durbin AD, Etchin J, Lawton L, Sallan SE, Silverman LB, et al. 2014. Oncogene regulation. An oncogenic super-enhancer formed through somatic mutation of a noncoding intergenic element. Science 346: 1373–1377. [DOI] [PMC free article] [PubMed] [Google Scholar]
- Maurano MT, Humbert R, Rynes E, Thurman RE, Haugen E, Wang H, Reynolds AP, Sandstrom R, Qu H, Brody J, et al. 2012. Systematic localization of common disease-associated variation in regulatory DNA. Science 337: 1190–1195. [DOI] [PMC free article] [PubMed] [Google Scholar]
- Melnikov A, Murugan A, Zhang X, Tesileanu T, Wang L, Rogov P, Feizi S, Gnirke A, Callan CG Jr, Kinney JB, et al. 2012. Systematic dissection and optimization of inducible enhancers in human cells using a massively parallel reporter assay. Nat Biotechnol 30: 271–277. [DOI] [PMC free article] [PubMed] [Google Scholar]
- Mitchell JA, Clay I, Umlauf D, Chen CY, Moir CA, Eskiw CH, Schoenfelder S, Chakalova L, Nagano T, Fraser P. 2012. Nuclear RNA sequencing of the mouse erythroid cell transcriptome. PLoS One 7: e49274. [DOI] [PMC free article] [PubMed] [Google Scholar]
- Mlynarczyk-Evans S, Royce-Tolland M, Alexander MK, Andersen AA, Kalantry S, Gribnau J, Panning B. 2006. X chromosomes alternate between two states prior to random X-inactivation. PLoS Biol 4: e159. [DOI] [PMC free article] [PubMed] [Google Scholar]
- Moorthy SD, Mitchell JA. 2016. Generating CRISPR/Cas9 mediated monoallelic deletions to study enhancer function in mouse embryonic stem cells. J Vis Exp e53552. [DOI] [PMC free article] [PubMed] [Google Scholar]
- Mostafavi S, Ray D, Warde-Farley D, Grouios C, Morris Q. 2008. GeneMANIA: a real-time multiple association network integration algorithm for predicting gene function. Genome Biol 9Suppl 1: S4. [DOI] [PMC free article] [PubMed] [Google Scholar]
- Murtha M, Tokcaer-Keskin Z, Tang Z, Strino F, Chen X, Wang Y, Xi X, Basilico C, Brown S, Bonneau R, et al. 2014. FIREWACh: high-throughput functional detection of transcriptional regulatory modules in mammalian cells. Nat Methods 11: 559–565. [DOI] [PMC free article] [PubMed] [Google Scholar]
- Ozaki H, Yamada K, Kobayashi M, Asakawa S, Minoshima S, Shimizu N, Kajitani M, Kawakami K. 1999. Structure and chromosome mapping of the human SIX4 and murine Six4 genes. Cytogenet Cell Genet 87: 108–112. [DOI] [PubMed] [Google Scholar]
- Parker SC, Stitzel ML, Taylor DL, Orozco JM, Erdos MR, Akiyama JA, van Bueren KL, Chines PS, Narisu N, Black BL, et al. 2013. Chromatin stretch enhancer states drive cell-specific gene regulation and harbor human disease risk variants. Proc Natl Acad Sci 110: 17921–17926. [DOI] [PMC free article] [PubMed] [Google Scholar]
- Pasini D, Bracken AP, Hansen JB, Capillo M, Helin K. 2007. The Polycomb group protein Suz12 is required for embryonic stem cell differentiation. Mol Cell Biol 27: 3769–3779. [DOI] [PMC free article] [PubMed] [Google Scholar]
- Pennacchio LA, Ahituv N, Moses AM, Prabhakar S, Nobrega MA, Shoukry M, Minovitsky S, Dubchak I, Holt A, Lewis KD, et al. 2006. In vivo enhancer analysis of human conserved non-coding sequences. Nature 444: 499–502. [DOI] [PubMed] [Google Scholar]
- Perry MW, Boettiger AN, Bothma JP, Levine M. 2010. Shadow enhancers foster robustness of Drosophila gastrulation. Curr Biol 20: 1562–1567. [DOI] [PMC free article] [PubMed] [Google Scholar]
- Pierre A, Gautier M, Callebaut I, Bontoux M, Jeanpierre E, Pontarotti P, Monget P. 2007. Atypical structure and phylogenomic evolution of the new eutherian oocyte- and embryo-expressed KHDC1/DPPA5/ECAT1/OOEP gene family. Genomics 90: 583–594. [DOI] [PubMed] [Google Scholar]
- Pott S, Lieb JD. 2014. What are super-enhancers? Nat Genet 47: 8–12. [DOI] [PubMed] [Google Scholar]
- Rajagopal N, Xie W, Li Y, Wagner U, Wang W, Stamatoyannopoulos J, Ernst J, Kellis M, Ren B. 2013. RFECS: a random-forest based algorithm for enhancer identification from chromatin state. PLoS Comput Biol 9: e1002968. [DOI] [PMC free article] [PubMed] [Google Scholar]
- Rao SS, Huntley MH, Durand NC, Stamenova EK, Bochkov ID, Robinson JT, Sanborn AL, Machol I, Omer AD, Lander ES, et al. 2014. A 3D map of the human genome at kilobase resolution reveals principles of chromatin looping. Cell 159: 1665–1680. [DOI] [PMC free article] [PubMed] [Google Scholar]
- Roy S, Siahpirani AF, Chasman D, Knaack S, Ay F, Stewart R, Wilson M, Sridharan R. 2016. A predictive modeling approach for cell line-specific long-range regulatory interactions. Nucleic Acids Res 44: 1977–1978. [DOI] [PMC free article] [PubMed] [Google Scholar]
- Ruiz-Narvaez EA. 2014. Redundant enhancers and causal variants in the TCF7L2 gene. Eur J Hum Genet 22: 1243–1246. [DOI] [PMC free article] [PubMed] [Google Scholar]
- Sanchez-Castillo M, Ruau D, Wilkinson AC, Ng FS, Hannah R, Diamanti E, Lombard P, Wilson NK, Gottgens B. 2014. CODEX: a next-generation sequencing experiment database for the haematopoietic and embryonic stem cell communities. Nucleic Acids Res 43: D1117–D1123. [DOI] [PMC free article] [PubMed] [Google Scholar]
- Schaub MA, Boyle AP, Kundaje A, Batzoglou S, Snyder M. 2012. Linking disease associations with regulatory information in the human genome. Genome Res 22: 1748–1759. [DOI] [PMC free article] [PubMed] [Google Scholar]
- Schoenfelder S, Furlan-Magaril M, Mifsud B, Tavares-Cadete F, Sugar R, Javierre BM, Nagano T, Katsman Y, Sakthidevi M, Wingett SW, et al. 2015. The pluripotent regulatory circuitry connecting promoters to their long-range interacting elements. Genome Res 25: 582–597. [DOI] [PMC free article] [PubMed] [Google Scholar]
- Shen X, Liu Y, Hsu YJ, Fujiwara Y, Kim J, Mao X, Yuan GC, Orkin SH. 2008. EZH1 mediates methylation on histone H3 lysine 27 and complements EZH2 in maintaining stem cell identity and executing pluripotency. Mol Cell 32: 491–502. [DOI] [PMC free article] [PubMed] [Google Scholar]
- Shin HY, Willi M, Yoo KH, Zeng X, Wang C, Metser G, Hennighausen L. 2016. Hierarchy within the mammary STAT5-driven Wap super-enhancer. Nat Genet 48: 904–911. [DOI] [PMC free article] [PubMed] [Google Scholar]
- Tanaka SS, Yamaguchi YL, Tsoi B, Lickert H, Tam PP. 2005. IFITM/Mil/fragilis family proteins IFITM1 and IFITM3 play distinct roles in mouse primordial germ cell homing and repulsion. Dev Cell 9: 745–756. [DOI] [PubMed] [Google Scholar]
- Tashiro F, Kanai-Azuma M, Miyazaki S, Kato M, Tanaka T, Toyoda S, Yamato E, Kawakami H, Miyazaki T, Miyazaki J. 2010. Maternal-effect gene Ces5/Ooep/Moep19/Floped is essential for oocyte cytoplasmic lattice formation and embryonic development at the maternal-zygotic stage transition. Genes Cells 15: 813–828. [DOI] [PubMed] [Google Scholar]
- Tran KA, Jackson SA, Olufs ZP, Zaidan NZ, Leng N, Kendziorski C, Roy S, Sridharan R. 2015. Collaborative rewiring of the pluripotency network by chromatin and signalling modulating pathways. Nat Commun 6: 6188. [DOI] [PMC free article] [PubMed] [Google Scholar]
- Trapnell C, Pachter L, Salzberg SL. 2009. TopHat: discovering splice junctions with RNA-Seq. Bioinformatics 25: 1105–1111. [DOI] [PMC free article] [PubMed] [Google Scholar]
- Tuan DY, Solomon WB, London IM, Lee DP. 1989. An erythroid-specific, developmental-stage-independent enhancer far upstream of the human “β-like globin” genes. Proc Natl Acad Sci 86: 2554–2558. [DOI] [PMC free article] [PubMed] [Google Scholar]
- Visel A, Blow MJ, Li Z, Zhang T, Akiyama JA, Holt A, Plajzer-Frick I, Shoukry M, Wright C, Chen F, et al. 2009. ChIP-seq accurately predicts tissue-specific activity of enhancers. Nature 457: 854–858. [DOI] [PMC free article] [PubMed] [Google Scholar]
- Wamstad JA, Alexander JM, Truty RM, Shrikumar A, Li F, Eilertson KE, Ding H, Wylie JN, Pico AR, Capra JA, et al. 2012. Dynamic and coordinated epigenetic regulation of developmental transitions in the cardiac lineage. Cell 151: 206–220. [DOI] [PMC free article] [PubMed] [Google Scholar]
- Wang J, Xu M, Zhu K, Li L, Liu X. 2012. The N-terminus of FILIA forms an atypical KH domain with a unique extension involved in interaction with RNA. PLoS One 7: e30209. [DOI] [PMC free article] [PubMed] [Google Scholar]
- Wang S, Zang C, Xiao T, Fan J, Mei S, Qin Q, Wu Q, Li X, Xu K, He HH, et al. 2016. Modeling cis-regulation with a compendium of genome-wide histone H3K27ac profiles. Genome Res 26: 1417–1429. [DOI] [PMC free article] [PubMed] [Google Scholar]
- Werner T, Hammer A, Wahlbuhl M, Bosl MR, Wegner M. 2007. Multiple conserved regulatory elements with overlapping functions determine Sox10 expression in mouse embryogenesis. Nucleic Acids Res 35: 6526–6538. [DOI] [PMC free article] [PubMed] [Google Scholar]
- Whalen S, Truty RM, Pollard KS. 2016. Enhancer–promoter interactions are encoded by complex genomic signatures on looping chromatin. Nat Genet 48: 488–496. [DOI] [PMC free article] [PubMed] [Google Scholar]
- Whyte WA, Orlando DA, Hnisz D, Abraham BJ, Lin CY, Kagey MH, Rahl PB, Lee TI, Young RA. 2013. Master transcription factors and mediator establish super-enhancers at key cell identity genes. Cell 153: 307–319. [DOI] [PMC free article] [PubMed] [Google Scholar]
- Xiong N, Kang C, Raulet DH. 2002. Redundant and unique roles of two enhancer elements in the TCRγ locus in gene regulation and γδ T cell development. Immunity 16: 453–463. [DOI] [PubMed] [Google Scholar]
- Xu PX, Zheng W, Huang L, Maire P, Laclef C, Silvius D. 2003. Six1 is required for the early organogenesis of mammalian kidney. Development 130: 3085–3094. [DOI] [PMC free article] [PubMed] [Google Scholar]
- Ying QL, Wray J, Nichols J, Batlle-Morera L, Doble B, Woodgett J, Cohen P, Smith A. 2008. The ground state of embryonic stem cell self-renewal. Nature 453: 519–523. [DOI] [PMC free article] [PubMed] [Google Scholar]
- Yip KY, Cheng C, Bhardwaj N, Brown JB, Leng J, Kundaje A, Rozowsky J, Birney E, Bickel P, Snyder M, et al. 2012. Classification of human genomic regions based on experimentally determined binding sites of more than 100 transcription-related factors. Genome Biol 13: R48. [DOI] [PMC free article] [PubMed] [Google Scholar]
- Zhang Z, Liu J, Li M, Yang H, Zhang C. 2012. Evolutionary dynamics of the interferon-induced transmembrane gene family in vertebrates. PLoS One 7: e49265. [DOI] [PMC free article] [PubMed] [Google Scholar]
- Zhou HY, Katsman Y, Dhaliwal NK, Davidson S, Macpherson NN, Sakthidevi M, Collura F, Mitchell JA. 2014. A Sox2 distal enhancer cluster regulates embryonic stem cell differentiation potential. Genes Dev 28: 2699–2711. [DOI] [PMC free article] [PubMed] [Google Scholar]
Associated Data
This section collects any data citations, data availability statements, or supplementary materials included in this article.