Abstract
We are just beginning to understand how translational control affects tumour initiation and malignancy. Here we use an epidermis-specific, in vivo ribosome profiling strategy to investigate the translational landscape during the transition from normal homeostasis to malignancy. Using a mouse model of inducible SOX2, which is broadly expressed in oncogenic RAS-associated cancers, we show that despite widespread reductions in translation and protein synthesis, certain oncogenic mRNAs are spared. During tumour initiation, the translational apparatus is redirected towards unconventional upstream initiation sites, enhancing the translational efficiency of oncogenic mRNAs. An in vivo RNA interference screen of translational regulators revealed that depletion of conventional eIF2 complexes has adverse effects on normal but not oncogenic growth. Conversely, the alternative initiation factor eIF2A is essential for cancer progression, during which it mediates initiation at these upstream sites, differentially skewing translation and protein expression. Our findings unveil a role for the translation of 5′ untranslated regions in cancer, and expose new targets for therapeutic intervention.
Translational control is a key determinant of protein abundance, which in turn defines cellular states1. Its impact may intensify during the transition from homeostasis to malignancy, as revealed by the surprisingly low correlations between mRNA and protein levels in genome-wide human cancer databases2. Moreover, oncogenic drivers, such as mTOR, c-MYC and RAS, can influence the activity of eukaryotic initiation factors (eIFs) and ribosomal proteins3–6. Thus, by generating aberrant downstream networks of translational regulators, oncogenes might impose altered protein synthesis programs that become the driving force for tumour formation and malignant progression.
Here we test this hypothesis by focusing on squamous cell carcinomas (SCCs), which are among the most common and life-threatening cancers worldwide. In mice, the RAS–MAPK pathway is essential for benign tumours and SCCs7. Downstream of RASG12V–MAPK is SOX2, an essential transcription factor induced by SCC-initiating (stem) cells8–11. Notably, SOX2 is also recurrently amplified in human SCCs of the lung, head and neck, oesophagus and cervix12. Given its broad effect on these cancers, we used an established, inducible SOX2 mouse model to interrogate its effects on translational regulation of skin epidermis, at a time preceding overt phenotypic and proliferative changes associated with tumorigenesis. Our studies led us to an unexpected shift to unconventional translation that functions crucially in tumour initiation.
Translational landscapes
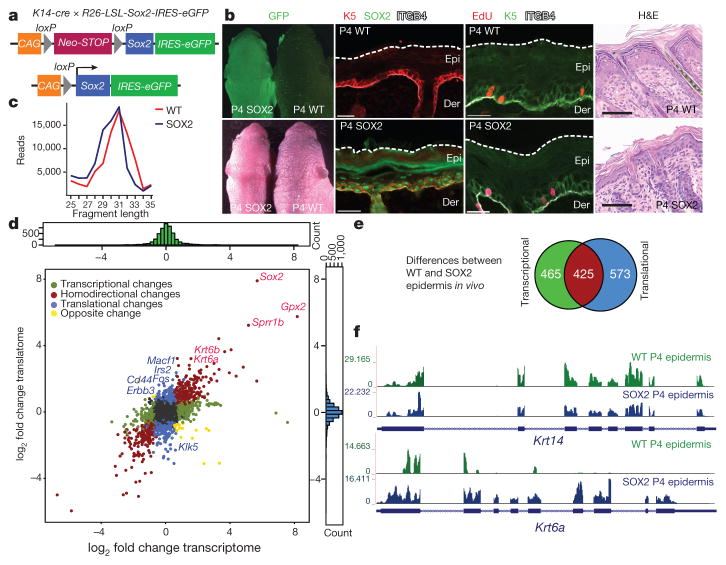
Embryonic epidermis is an excellent model for studying a rapidly growing tissue that relies on a fine-tuned balance between proliferation and differentiation13,14. To assess how SOX2 perturbs this balance, we crossed R26-LSL-Sox2-IRES-eGFPfl/fl and K14-cre+/wt mice15, yielding newborn litters with unaffected (green fluorescent protein (GFP)-negative; GFP−) or SOX2-expressing (GFP+) epidermal progenitors. We focused on postnatal days 0–4 (P0–P4) when SOX2+ epidermis was pre-phenotypic (Fig. 1a, b, Extended Data Fig. 1a).
Figure 1. The translational landscape of the epidermis during premalignant transformation.
a, Transgene and mating used to induce Sox2 in E15.5 embryonic skin epidermis. b, Representative P4 skin sections of littermates. Scale bars, 30 μm and 60 μm (haematoxylin and eosin (H&E) images). ITGB4 denotes epithelial marker β4-integrin. WT, wild type. c, Ribosome-protected fragment length (in nucleotides) in P4 epidermal samples from randomly selected 105 reads (n =3 per genotype). d, Transcriptional and translational changes comparing SOX2 with wild-type P4 epidermis. Colour-coded are genes with the adjusted P value < 0.05 (DESeq2; ref. 43; n = 3 per group for ribosome profiling; n =2 for RNA-seq). e, Venn diagram depicts total number of SOX2-dependent transcriptional and translational changes. f, Ribosome density profile on Krt14 and Krt6a transcripts in the epidermis (n = 3 per genotype).
To determine the effect of SOX2 on translation, we adopted a strategy previously used to map ribosome-protected mRNA sequences in yeast and cultured cell lines16–18. After treating freshly isolated skins with translation elongation inhibitor (cycloheximide), we prepared an epidermal suspension enriched for basal progenitors and then isolated and sequenced ribosome-protected mRNA fragments to generate a genome-wide in vivo epidermal translational landscape (Extended Data Fig. 1b). In parallel, we performed ribosome profiling on HRASG12V-transformed SCCs and primary keratinocytes, and we also mapped initiation sites using harringtonine, which blocks initiation during the first round of elongation18. Ribosome-protected fragment-length assays generated a 31-nucleotide peak (Fig. 1c). Across deep-sequencing replicates, our in vivo ribosomal profiling was highly reproducible (R2 values >0.9, Extended Data Fig. 1b, c).
By conducting matched transcriptional RNA sequencing (RNA-seq) and ribosome profiling, we contrasted genome-wide transcriptional and translational differences. As confirmed by immunofluorescence, some genes, such as Krt5 and Krt14, showed SOX2-independent translation, whereas others, such as Krt6, Krt16 and Sox2, displayed increased translation in SOX2+ epidermis19 (Fig. 1b, d–f). Notably, 573 translatome-only differences were found, which included mRNAs encoding proteins such as Cd44, Fos, Erbb3 and Irs2 that have well-known functions in tumorigenesis. By performing parallel, comparative mass spectrometry, we found that ribosome profiling correlated well with SOX2-induced protein differences (Spearman correlation coefficient (rs) =0.85, Extended Data Figs 2a, 10b).
Somatic stem cells and cancer-propagating cells have low protein synthesis rates, a feature implicated in driving stemness20,21. Therefore, we sought to determine whether SOX2 and HRASG12V also affected the cell-based rate of protein synthesis. We first used O-propargyl-puromycin (OPP) incorporation as a proxy for total protein synthesis20. OPP led to a robust increase in fluorescence, which could be largely blocked by prior cycloheximide treatment. On the basis of this assay, pre-malignant and SCC SOX2+ keratinocytes both showed lower protein synthesis rates than their wild-type counterparts (Fig. 2a, b).
Figure 2. Overall protein synthesis and translational efficiency are decreased in premalignant and SCC states.
a, b, O-propargyl-puromycin (OPP) incorporation was assessed 1 h after administration in vitro. Representative histograms are shown for unstained, cycloheximide/OPP-treated (CHX) or OPP-treated keratinocytes. Data are mean ±s.d. (WT n =11, SOX2 n =7, SCC n = 7 independent experiments). **P <0.01, ***P < 0.001, two-tailed Student’s t-test. MFI, mean fluorescence intensity. c, Differential translational efficiency (TE =RPKMribosome profiling/RPKMRNA-seq) SOX2 versus wild type. d, Pathway analysis of genes transcribed differentially or translated efficiently in SOX2 versus wild type.
To explore further how SOX2 functions in translational regulation, we next focused on translational efficiency by determining the reads per kilobase of transcript per million mapped reads (RPKM) of coding sequences (CDS) in ribosome profiling versus the RPKM in exons of RNA-seq (RPKMribosome profiling/RPKMRNA-seq) in wild-type and premalignant states. Overall, translational efficiency in SOX2+ epidermis was markedly lower than in wild-type epidermis (Fig. 2c). Translational efficiency was also reduced in cultured SOX2-transformed keratinocytes, indicating that this difference was intrinsic to SOX2 levels (Extended Data Fig. 2b). Moreover, the cells grew comparably in vivo, ruling out proliferation rates as the root of these differences (Extended Data Fig. 2c). We also found no differences in the expression of phospho-eIF4E-BP1 or NSUN2, which could have contributed to reduced translational efficiency21 (Extended Data Fig. 2d, e).
Reduced protein synthesis in pre-malignancy correlated well with reduced translational efficiency. Notably, however, a small cohort of mRNAs deviated from this trend. In particular, while increased transcripts were enriched for stress pathways, the cohort of efficiently translated mRNAs in SOX2+ epidermis displayed a notable association with cancer-related pathways (Fig. 2d, Extended Data Fig. 3). Thus, in the face of global translational reduction during the early stages of malignancy, a translationally controlled subset of cancer genes escaped this suppression by maintaining efficient translation.
Tumour-induced shifts in translation initiation
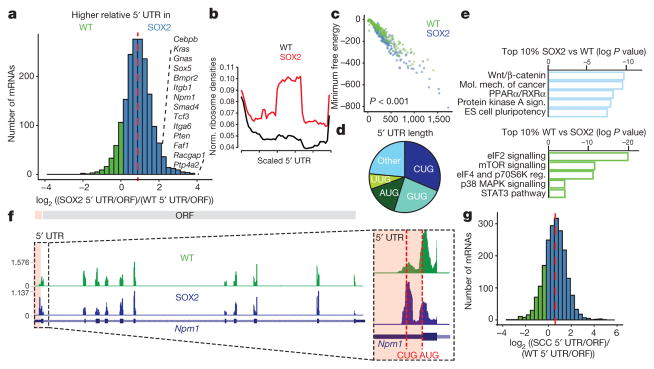
In addition to these differences in translational efficiency, there were also qualitative differences in the patterns of ribosomal occupancies. Oncogene-dependent differential skewing of ribosome occupancy was particularly evident within 5′ untranslated regions (UTRs). We identified distinct SOX2-induced patterns of translated upstream open reading frames (uORFs), reflected in their triplet periodicity22, that were 5′ of annotated CDS (Fig. 3a, b, Extended Data Figs 4, 5a). Quantification of 5′ UTR translation of 1,830 mRNAs revealed that uORF translation increased substantially in SOX2+ compared to wild-type epidermis (median ratio 1.84), as measured by the ratio of ribosome profiling reads within the 5′ UTR relative to reads within the annotated downstream CDS.
Figure 3. Translation is shifted towards upstream open reading frames in premalignant and SCC states.
a, Relative uORF translation in P4 epidermis. Histogram shows distribution of log2 fold changes in relative 5′ UTR translation (n = 3 per genotype). Red line, median. b, Metagene analysis of ribosome density for the 1,830 5′ UTRs quantified in a. Normalized ribosome densities denotes the ratio of ribosome profiling reads. c, Minimum free energy for the top 10% of wild-type and SOX2-regulated 5′UTRs (n = 183 per group, from 3 independent experiments, two-sided Wilcoxon test). d, Start codon usage of uORFs preferentially translated in SOX2+ epidermis. e, Pathway analysis for the top and bottom 10% of genes with differential uORF usage in SOX2+ versus wild type (n = 183 per group). ES cell, embryonic stem cell. f, Normalized ribosome densities in 5′ UTR and ORF of Npm1 in P4 epidermis (average of n =3 per genotype). g, Relative uORF translation in HrasG12V; Tgfbr2-null versus control keratinocytes in vitro. Red line, median.
Notably, some extensions in ribosomal coverage along 5′ UTRs in pre-malignant epidermis also generated peptide diversity (Extended Data Figs 4, 5). Previous studies underscored the difficulties in detecting uORF peptides by mass spectrometry23, and indeed, even when we specifically enriched for N-terminal fragments (terminal amine isotopic labelling of substrates, TAILS), we only detected 13 uORF peptides.
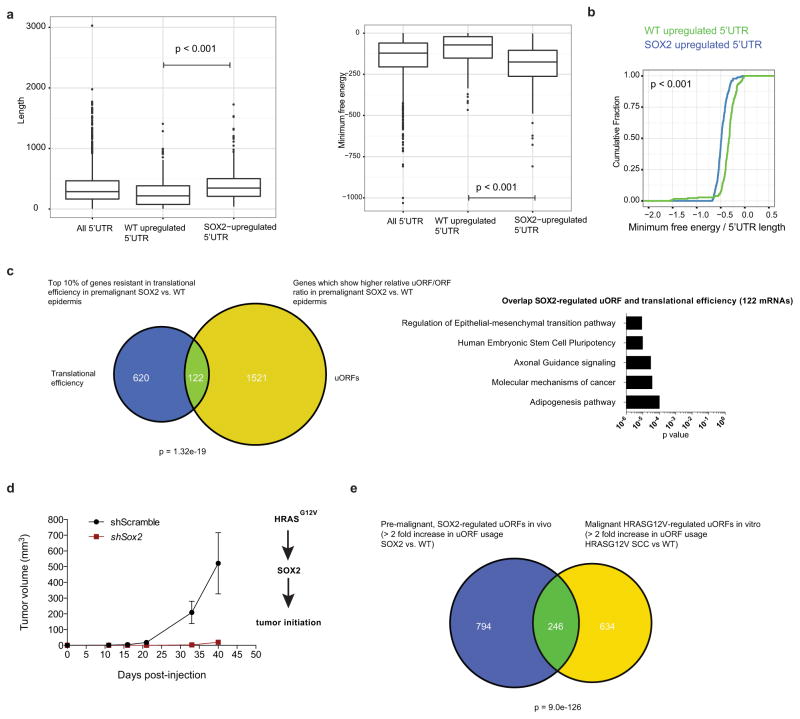
Independent of whether uORFs are translated into stable peptides or N-terminal extensions, or represent stalled or poised ribosomes, they still could serve an important regulatory role. Moreover, upon scrutinizing 5′ UTRs of the top 10% of efficiently translated uORFs in SOX2+ epidermis, we discovered a marked correlation between enhanced translation, increased length and decreased minimum free energy of 5′ UTRs (Extended Data Fig. 6a, b). When normalized for length, reduced folding energy still correlated with increased translation (Fig. 3c), indicating that SOX2-dependent re-direction towards uORF translation may target 5′ UTRs with increased secondary structure.
Pathway analysis revealed that highly translated uORFs in SOX2+ epidermis have downstream ORFs involved in mechanisms of cancer, stem-cell pluripotency and Wnt/β-catenin signalling. This contrasted with wild-type epidermis, where eIF2 signalling was the primary target of differential uORF usage (Fig. 3e). Additionally, significant overlap existed between mRNAs with high uORF translation and mRNAs refractory to oncogenic suppression of translational efficiency (Extended Data Fig. 6c). Many of these SOX2-induced, ribosome-protected uORFs within 5′ UTRs displayed CUG, rather than the conventional AUG initiation site of canonical ORFs (Fig. 3d). For instance, nucleophosmin (Npm1), which is frequently mutated or translocated in cancer24, exhibited increased ribosome occupancy in the 5′ upstream CUG uORF (Fig. 3f).
These findings suggest that even before visible signs of tumorigenesis, the translational initiation apparatus is redirected towards upstream ORFs of a cohort of cancer-related mRNAs. If this hypothesis is correct, then we should see differential uORF usage in established cancers. We therefore examined uORF usage in a tumour allograft model, in which oncogenic HRASG12V in combination with loss of TGFβ receptor II rapidly progresses in a SOX2-dependent manner into SCCs25 (Extended Data Fig. 6d). Indeed, when compared to keratinocytes from normal epidermis, SCC keratinocytes displayed an approximately 1.7-fold increase in uORF translation of mRNAs, similar to that seen with premalignant epidermis (Fig. 3g). Moreover, a notable overlap existed between uORFs regulated by SOX2 in vivo and HRASG12V in vitro (Extended Data Fig. 6e). Together, these findings underscore the existence of a mechanism to redirect the translational initiation machinery specifically in SCCs for the purpose of enhancing the relative 5′ UTR translational efficiency of the uORFs of certain cancer-related mRNAs.
In vivo RNAi screen exposes an eIF2 regulatory node
Recognition of upstream and conventional ORF start codons is thought to involve a similar set of initiation factors (eIFs) and ribosomal subunits26. Therefore, we posited that differential activity or abundance of either eIFs or ribosomal proteins might be responsible for SOX2-induced changes of the translational landscape.
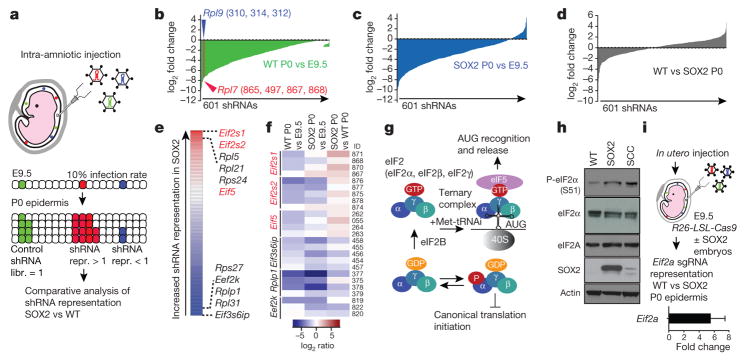
To find such regulatory nodes, we designed an RNA interference (RNAi)-based screen to determine whether knockdown of any of those genes exhibits a differential growth phenotype in SOX2 versus wild-type epidermis. To this end, we pooled 750 short hairpin RNA (shRNA)-containing lentiviruses targeting translation-related genes and then introduced this library in utero into the amniotic sacs of living embryonic day (E)9.5 embryos (Fig. 4a, Extended Data Fig. 7a). This technique selectively and efficiently transduces skin epidermal progenitors14. To prevent multi-infections and still ensure a coverage of more than 400 (cells/shRNA), we used a 10% infection rate on 27–49 embryos of each genotype and assessed shRNA representation in P0 epidermis.
Figure 4. An epidermal-specific in vivo RNAi screen identifies the eIF2 ternary complex as a regulatory node in premalignancy.
a, Schematic of the screening strategy, in which the lentivirus library was injected into the amniotic sacs of E9.5 wild-type and SOX2+ embryos. The library consisted of 715 shRNAs targeting 138 eukaryotic initiation factors and ribosomal proteins and, 35 non-targeting control shRNAs. 49 wild-type and 27 SOX2+ embryos were transduced. Total coverage: wild type, 782×; SOX2+, 432×. b–d, shRNA abundance ratios were calculated as the number of reads at P0 divided by the number of reads in the initial library (mean of n = 3, 601 shRNAs quantified above threshold). Numbers in parentheses denote the shRNA ID targeting a particular gene. e, Analysis of relative shRNA representation reveals Eif2s1, Eif2s2 and Eif5 shRNAs among the top hits with higher representation in SOX2+ versus wild-type epidermis using the RIGER algorithm. f, Heatmap showing examples of shRNAs with higher and lower relative representation in SOX2+ versus wild-type epidermis. g, Schematic of the eIF2 pathway that initiates canonical translation. h, Representative western blot from 3 independent experiments of keratinocytes in vitro. i, In vivo CRISPR/Cas9 strategy to knockout Eif2a in wild-type and SOX2+ epidermis by in utero injection of lentiviruses containing cre and single-guide RNAs (sgRNAs). Relative Eif2a sgRNA representation was analysed by quantitative PCR (n =4 per genotype). Data are mean ±s.d.
As expected, most cells containing ribosomal protein and Eif shRNAs were depleted in skins of both genotypes, with similar overall distribution of enriched and depleted shRNAs (Fig. 4b, c). However, by analysing differential shRNA representation, we began to unveil regulatory nodes downstream of SOX2 (Fig. 4d). As judged by the RIGER algorithm27, Eif2s1, Eif2s2 and Eif5 were among the top six genes in which the shRNAs were specifically enriched in SOX2+ epidermis (Fig. 4e, f, Extended Data Fig. 7b, c).
eIF2α (encoded by Eif2s1) and eIF2β (Eif2s2) are part of the eIF2 ternary complex, which initiates canonical translation together with methionine initiator-tRNA; eIF5 is required for recycling this complex to launch subsequent rounds of translation5,28 (Fig. 4g). On the basis of our screen, we posited that pre-malignant SOX2-expressing epidermal cells may be using a translational program independent of canonical eIF2-mediated translation initiation. Interestingly, both SOX2+ and HrasG12V;Tgfbr2-null SCCs displayed higher eIF2α-Ser51 phosphorylation (Fig. 4h), a modification also seen in the integrated stress response (ISR), where it diminishes eIF2 activity29.
eIF2A is an essential factor for tumour initiation
To understand how SCC translation is coordinated independently of eIF2, we first asked whether alternative initiation factors coordinate translation in the context of tumour formation. Four alternative initiation factors MCT1–DENR, eIF2D (also known as Lgtn or ligatin), eIF5B and eIF2A are known to deliver tRNAs to P sites of the ribosome30–34. Eif5b was not differentially depleted in our screen (Extended Data Fig. 7b), but Mct1-Denr, Eif2d and Eif2a shRNAs had not been included in our initial library. We focused on eIF2A as it is a crucial factor for uORF translation35, it has been implicated in leucine-tRNA recruitment34 and may be directly involved in initiating CUG (leucine) uORF start codons34,35, which showed the highest prevalence in SOX2+ epidermis18 (Fig. 3e).
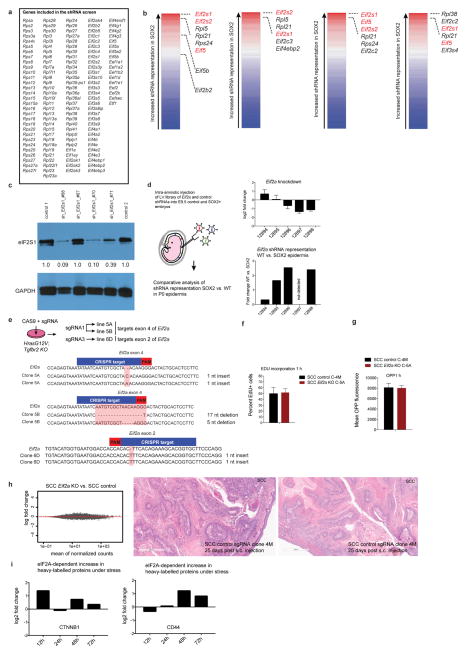
To test whether SOX2+ epidermis has enhanced dependency on eIF2A, we first performed an in vivo mini-screen with now available Eif2a shRNAs. Relative to 35 control shRNAs, Eif2a shRNAs were under-represented in SOX2+ epidermis, correlating to an extent with mRNA-knockdown efficiency (Extended Data Fig. 7d). Similar results were obtained by using in utero CRISPR/Cas9-mediated gene targeting to ablate Eif2a fully (Fig. 4i). Thus, whereas translation in wild-type epidermis depended on eIF2α, SOX2+ epidermis showed increased reliance on eIF2A.
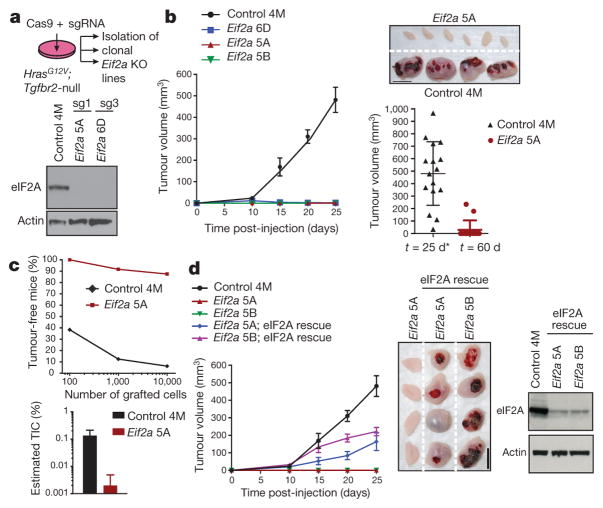
To test whether eIF2A is required for translation in SCCs, we used CRISPR/Cas9 to establish three independent Eif2a-null clones of HrasG12V;Tgfbr2-null SCCs25 (Fig. 5a, Extended Data Fig. 7e). In serum-rich media, Eif2a-ablation did not affect proliferation, total protein synthesis or the translational landscape of SCC cells (Extended Data Fig. 7f–h). However, whereas control SCCs formed tumours within 1–2 weeks of engraftment, Eif2a-null SCCs rarely developed tumours even after 2 months (Fig. 5b). Moreover, in limiting dilution assays, tumour-initiating SCC cells were roughly 100 times fewer in isogenic Eif2a-null versus control SCC lines (Fig. 5c). Importantly, after reintroducing eIF2A into our Eif2a-null lines, tumour formation was rescued (Fig. 5d), thereby establishing an essential and hitherto unappreciated role for eIF2A-mediated translation in tumour initiation.
Figure 5. eIF2A controls tumour formation.
a, HrasG12V;Tgfbr2-null SCC keratinocytes were infected with lentiviruses containing Cas9 and sgRNAs to establish Eif2a-knockout (KO) and non-targeting control lines. Western blot confirms Eif2a ablation by two different sgRNAs (sg1 and sg3). 4M denotes control clone; 5A, 5B and 6D denote Eif2a knockout clones. b, Eif2a ablation abrogates tumour growth. Plotted is mean tumour volume ± s.e.m. after subcutaneous injection of 105 cells (n =16 control, n = 14 knockout clone 5A, n = 12 clones 5B and 6D). Representative tumours 25 days after injection are shown. Asterisk denotes terminated owing to tumour size. Scale bar, 1 cm. c, Limiting dilution assay. Graphs show percentage of tumour-free mice 4 weeks after injection and estimated tumour-initiating cells (TIC) (n = 24 grafts per dilution and genotype). d, Re-introducing eIF2A by pCMV-Eif2a transformation rescues Eif2a-knockout defective tumour initiation. Western blot confirms eIF2A restoration. Data are mean ±s.e.m. (n =16 control, n = 14 clone 5A, n =12 clone 5B, n = 16 clone 5A; pCMV::Eif2a, n = 16 clone 5B; pCMV::Eif2a). Scale bar, 1 cm.
eIF2A, protein synthesis and SCC prognosis
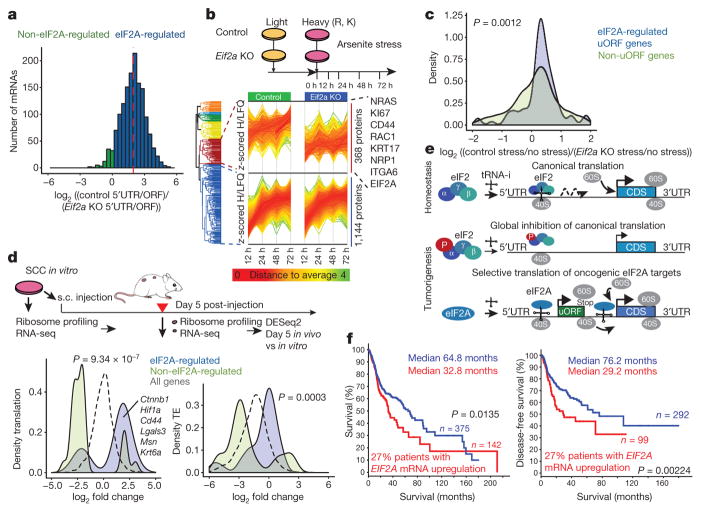
In performing ribosome profiling, we found a pronounced decline in the ratio of uORF to ORF translation in Eif2a-null compared with control SCC keratinocytes (Fig. 6a). Having established a direct role for eIF2A in mediating genome-wide translation from 5′ UTRs, we next monitored the consequences of eIF2A-dependent uORF usage on protein production. Since eIF2A loss had no appreciable effects on translation in rich media (Extended Data Fig. 7h), we added arsenite to phosphorylate and inhibit eIF2α, thus increasing eIF2A dependency. To track newly synthesized proteins in control and Eif2a-null SCCs, we used a pulsed SILAC (stable isotope labelling with amino acids in cell culture) approach, administering the eIF2α block concomitant with the switch from light (L)- to heavy (H)-labelled SILAC medium.
Figure 6. eIF2A promotes translation of select cancer genes and leads to poor prognosis in human SCC.
a, eIF2A controls genome-wide uORF translation. Histogram shows distribution of log2 fold changes in relative 5′ UTR translation of uORF genes in Eif2a-knockout compared with control SCCs. Red line, median. b, A pulsed SILAC strategy reveals eIF2A-dependent protein synthesis under 5 μM arsenite stress. A cluster of 368 of the quantified 2,045 proteins were selectively reduced in synthesis in Eif2a-knockout SCCs. c, eIF2A-targeted uORF genes show increased protein synthesis in 72 h pulsed SILAC in control versus Eif2a-knockout SCCs. Kernel density plot shows eIF2A-dependent change in heavy-labelled protein synthesis of eIF2A-targeted uORF and non-uORF genes under stress. P value, two-sample Kolmogorov–Smirnov test. d, eIF2A-targeted uORF cancer genes are preferentially translated in early tumorigenesis. SCCs were subjected to ribosome profiling and RNA-seq directly or after 5 days transplantation in vivo (n = 2). Kernel density plots show changes in translation and translational efficiency (TE) of tumours in vivo versus SCCs in vitro at day 5. eIF2A-targeted (n = 716) versus non-eIF2A-targeted uORF (n = 746) genes refer to changes in uORF usage in control versus Eif2a-null SCCs (a). P values, two-sample Kolmogorov–Smirnov test. s.c., subcutaneous. e, Model of the switch towards eIF2A-dependent translation during tumorigenesis. tRNA-i, initiator-tRNA. f, Kaplan–Meier analysis comparing overall (left) and disease-free (right) survival of TCGA patients with head and neck SCC, which were stratified according to EIF2A mRNA expression z-score >1.75 (27% of patients) versus the rest. Median survival and disease-free survival values are given.
Of 2,045 proteins detected by mass spectrometry, 368 showed an eIF2A-dependent, temporal increase in H-labelled peptides in SCCs (Fig. 6b, Extended Data Fig. 7i). This cohort included cancer- associated proteins such as NRAS, CD44, KRT17, Ki67, NRP1 and RAC1. Moreover, eIF2A-targeted uORF genes showed a significant eIF2A-dependent overall increase in H-labelled proteins when SCCs were cultured under stress (Fig. 6c). Thus, under conditions of eIF2α phosphorylation, eIF2A specifically augments protein synthesis of uORF-containing mRNAs.
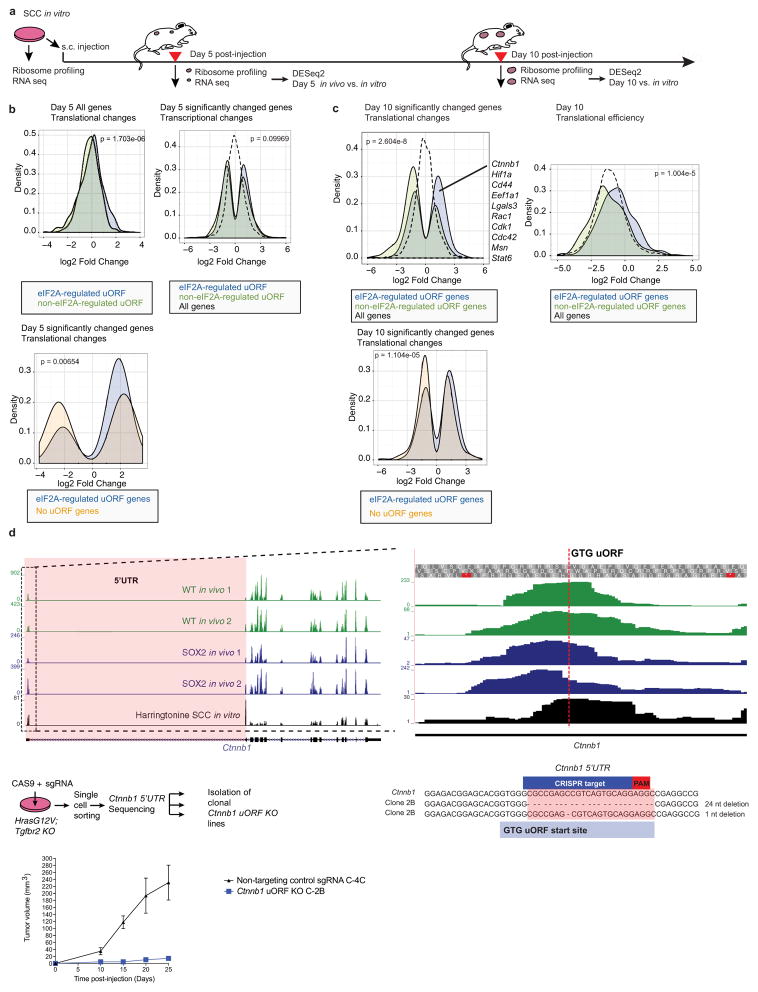
To address whether this principle pertains to early stages of tumorigenesis in vivo, we performed transplantation assays (Fig. 6d, Extended Data Fig. 8a–c). As early as day 5 after transplantation, SCC mRNAs containing eIF2A-targeted uORFs exhibited a marked increase in both translation and translational efficiency in the absence of appreciable transcriptional differences. These data suggest that during early tumorigenesis, cancer-associated transcripts that contain eIF2A-targeted uORFs selectively increase their translational efficiency. In agreement, mutations in the eIF2A-regulated uORF of Ctnnb1, a key oncogene for SCC progression, resulted in diminished tumorigenic potential (Extended Data Fig. 8d).
Analysis of The Cancer Genome Atlas (TCGA)36 revealed that the human EIF2A locus is amplified in 29% of patients with lung SCC, 15% of patients with head and neck SCC and 15% of patients with oesophageal carcinoma (Extended Data Fig. 9). Notably, although initiation factors are typically regulated post-translationally, higher EIF2A mRNA levels correlated significantly with shorter overall survival and shorter disease-free survival (Fig. 6f).
Discussion
Translational control allows a cell to orchestrate rapid changes in protein synthesis and tailor newly synthesized proteins to its specific needs, thereby ensuring that cellular resources are conserved37. Our studies not only add to evidence that suggests that eIF2α phosphorylation and inactivation may be induced during tumour formation38, but also further indicate that oncogenes can direct the translational machinery towards eIF2A-dependent uORF translation in tumorigenesis.
We found that whereas eIF2α phosphorylation globally reduces protein synthesis, translation is not inhibited on all mRNAs, but rather reprogrammed to translate selected eIF2A-dependent cancer-associated mRNAs efficiently. eIF2A competes, albeit very poorly, with eIF2α for delivery of the initiator tRNA to the 40S ribosomal subunit32,39,40, thus accentuating its relevance only when eIF2α is inhibited. Our findings support a model in which tumour initiation factors and/or cellular stressors38,41 lead to eIF2α inhibition early in tumorigenesis, freeing eIF2A of its competitive disadvantage and orchestrating its preferential translation of genes important for malignant progression.
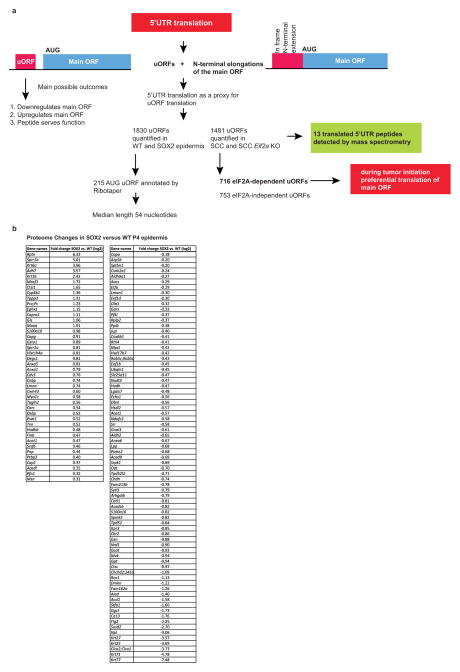
eIF2A could mediate tumorigenesis in several ways (Extended Data Fig. 10a). First, if a preferred 5′ upstream start codon is in-frame, eIF2A could generate an N-terminally extended protein, and as described for the Pten tumour suppressor42, this could yield a function distinct from its parent ORF. Second, as shown by our proteomics experiments, uORF translation can generate small peptides, which if bioactive, could directly impact cellular behaviour. Third, uORF translation could have a regulatory role by amplifying or diminishing translation of downstream ORFs. This becomes particularly important in stem cells and the early stages of tumorigenesis, where overall protein synthesis is suppressed20,21 and yet marked changes in protein production must occur. Indeed, we identified a subset of oncogenic mRNAs that contain eIF2A-targeted uORFs and which are preferentially translated at early stages of tumorigenesis.
In summary, we discovered that during tumour initiation, oncogene- induced changes in eukaryotic initiation factors profoundly impact the translational landscape. By introducing shifts in the translation of uORFs, they can render specific cohorts of cancer-related mRNAs refractory to global reductions in protein synthesis that often accompany a stem-like and/or cancerous state. Given the poor prognosis associated with EIF2A mRNA levels in human cancers, our findings form a foundation for future investigations into whether eIF2A-mediated translation and/or translational regulation by uORFs can be exploited for therapeutic interventions.
METHODS
Ribosome profiling
In vivo sample preparation: mouse skins of P4 mice were collected immediately after euthanization and placed in ice-cold PBS supplemented with 8 mg ml−1 cycloheximide (CHX, in dimethyl sulfoxide) for 5 min. This concentration of CHX has been shown to reduce potential CHX-related artefacts44 and ensures rapid inhibition of translation within the skin. Skins were then placed into 2 ml of dispase (Corning 354235) supplemented with 8 mg ml−1 CHX for 20 min at 37 °C. Epidermis was separated from dermis under a dissection scope using fine forceps. Epidermis was then placed immediately in 4 ml trypsin supplemented with 4 mg ml−1 CHX and incubated for 12 min at 37 °C. The resulting cell suspension, enriched for basal epidermal keratinocytes, was then filtered through a 40-μm cell strainer, spun down and resuspended in lysis buffer as reported previously45. Cells were lysed on ice for 10 min, centrifuged at 16,000g at 4 °C for 10 min and supernatant was flash-frozen in liquid nitrogen. RNA concentration was determined using the Quant-it Ribogreen assay kit (R11490, Thermo Fisher). In most experiments, three P4 mice were pooled per sample. A sample was taken for RNA-seq analysis for comparison to ribosome profiling and calculation of translational efficiency.
In vitro sample preparation: keratinocytes were treated with Harringtonine (Abcam, 141941) for 5 min (2 μg ml−1) to block initiation-specific translation, CHX (Sigma) for 1 min (100 μg ml−1) to block translational elongation or no drug, as indicated. Cell lysis was performed in the dish. A sample was taken for RNA-seq analysis.
In vivo tumour sample preparation: tumours were collected immediately after euthanization and placed in ice-cold PBS supplemented with 8 mg ml−1 CHX (in dimethyl sulfoxide) for 5 min. Tumours were broken up into small pieces using a scalpel and incubated for 20 min in 0.5% collagenase supplemented with 8mg ml−1 CHX (in dimethyl sulfoxide). Samples were spun down and resuspended 4 ml trypsin supplemented with 4 mg ml−1 CHX for 12 min at 37 °C. The resulting cell suspension was then filtered through a 40-μm cell strainer, spun down and resuspended in lysis buffer.
The ribosomal profiling technique was carried out as reported previously45, with a few modifications as described below. Lysates were treated with 2.5 U RNase I (Ambion) per microgram RNA. Ribosome-protected fragments were isolated using sephacryl S400 columns (GE Healthcare) in TE buffer. rRNAs were removed using the Ribo-zero magnetic kit (Illumina, MRZH11124). Finally, ribosome-protected fragments were amplified in 7–9 PCR cycles using Phusion polymerase (NEB). Resulting amplicons were run on an 8% acrylamide non-denaturing gel, excised and incubated in 300 mM NaCl, 10 mM Tris (pH 8) and 1 mM EDTA-containing buffer overnight at 20 °C. The ribosome-protected fragments library was then precipitated in 2 μl of glycogen and 700 μl isopropanol. Samples were analysed on a bioanalyzer before sequencing. Libraries were sequenced on HiSeq2500 and HiSeq4000 platforms.
For parallel RNA-seq, RNA was purified using Direct-zol RNA MiniPrep kit (Zymo Research) per manufacturer’s instructions. Quality of the RNA was determined using Agilent 2100 Bioanalyzer, with all samples passing the quality threshold of RNA integrity numbers (RIN) > 8. Library preparation using Illumina TrueSeq mRNA sample preparation kit was performed at the Weill Cornell Medical College Genomic Core facility, and cDNA was sequenced on Illumina HiSeq 2500. Reads were mapped to mm10 build of the mouse genome using TopHat2, and differential expression was determined using DESeq2.
Sequencing alignment and mapping
Sequencing reads were clipped and trimmed using fastx_clipper and fastx_trimmer from the Hannon laboratory. Fragments derived from rRNA were removed using Bowtie2 (ref. 46), aligning to the 45S preRNA sequence. The remaining non-ribosomal reads were then aligned to the mm10 mouse genome using TopHat2 (ref. 47).
Gene expression quantitation
For all analyses we used GRCm38.78 of the mouse genome transcript annotation from Ensembl. Sets of genes whose transcripts shared one or more exact exons were collapsed to ‘merged’ genes. Genomic coordinates occupied by more than one merged gene on the same strand were excluded from analysis. Within each merged gene, the remaining nucleotide positions were then divided into the following classes: ‘exon’ was the union of all positions across all transcripts belonging to the merged gene; for coding genes, ‘5′ UTR’ contained all positions that were uniquely labelled as 5′ UTR in all transcripts; ‘CDS’ contained all positions that were uniquely labelled as CDS in all transcripts; and ‘3′ UTR’ contained positions labelled as 3′ UTR in all transcripts.
The total number of mRNA fragments and ribosome footprints aligning to each class of positions was tabulated for each merged gene. Gene merging, position classification, and expression counting were performed using the cs script from the Plastid toolkit48.
These count data were then taken into DESeq2, an R package designed for the analysis of Illumina sequencing-based assays, which estimates and accounts for biological variability in a statistical test based on the negative binomial distribution43.
Ribosome occupancy was quantified for mRNAs with more than an average of 128 reads over all replicates. 5′ UTR translation was quantified for mRNAs with an average of more than 16 reads over all replicates. Throughout our study, we use 5′ UTR translation as a proxy for uORF translation. Relative 5′ UTR translation was calculated for each gene using the formula: relative 5′ UTR translation =counts in the 5′ UTR/counts in the CDS.
Translation efficiency (TE) was computed for each merged gene using the formula:
Only RNAs with more than 256 reads were included for translation efficiency calculations.
For metagene analysis, annotated 5′ UTR from the list of quantified uORFs, translated mRNAs were selected from the ENSEMBL database. 5′ UTRs were then scaled to equal number of windows and average signal was plotted. For start codon usage (Fig. 3d), the top 5% of SOX2-regulated uORFs from P4 epidermis were quantified.
eIF2A-regulated uORFs were defined as ratio of 5′ UTR translation in SCC control/5′ UTR translation in SCC Eif2a knockout >4 (n = 716). The remaining mRNAs with a ratio <4 were defined as non-eIF2A regulated (n =746).
All calculations were made in R, some graphs were plotted using ggplot2 in R. Gene lists were imported into the Ingenuity Pathway Analysis software (Ingenuity Systems), and analyses and graphic outputs of relative enrichment in functional gene categories were performed as recommended.
Western blotting
Total cell lysates were prepared using RIPA (20 mM Tris-HCl, pH 8.0, 150 mM NaCl, 1 mM EDTA, 1 mM EGTA, 1% Triton X-100, 0.5% deoxycorate, 0.1% SDS) supplemented with protease inhibitors (Complete mini, Roche) and Halt phosphatase inhibitor cocktail (Thermo Fisher, 1862495). The protein concentrations of clarified supernatants were measured by using BCA Protein Assay Kit (Thermo Scientific). Gel electrophoresis was performed using 4–12% NuPAGE Bis-Tris gradient gels (Life Technologies), transferred to nitro-cellulose membranes (GE Healthcare, 0.45 μm). Membranes were blocked for 90 min in 2% BSA in TBS with 0.1% Tween 20 (TBST). Membranes were then incubated with primary antibodies in the blocking buffer overnight at 4 °C. After washing with TBST, membranes were incubated with secondary antibodies in the blocking buffer at room temperature for 45 min. The membranes were washed in TBST, then incubated for 1 min with ECL western blotting detection reagent (GE Healthcare, RPN2209). Chemiluminescent protein bands were analysed using CL-X posure film (Thermo Scientific, 34091). The following primary antibodies were used: eIF2A (Proteintech, 11233-1-AP, 1:1,000), 4-E-BP1 (53H11, Cell Signaling, 1:1,000), p-4E-BP1 (236B4, Cell Signaling, 1:1,000), p-eIF2α (119A11, Cell Signaling, 1:1,000), eIF2α (D7D3, Cell Signaling, 1:1,000), β-actin (8H10D10, 1:1,000), GAPDH (14C10, Cell Signaling, 1:1,000), SOX2 (Abcam, 92494, 1:1,000).
Immunofluorescence immunohistochemistry and imaging
For immunofluorescence microscopy, skin was embedded in optimal cutting temperature compound (OCT) (VWR). Cryosections were cut at a thickness of 12 μm on a Leica cryostat and mounted on SuperFrost Plus slides (VWR). Sections were incubated in 2% paraformaldehyde for 10 min, washed and blocked for 1 h in blocking buffer (5% normal donkey serum, 1% BSA, 2% fish gelatin, 0.3% Triton X-100 in PBS). Slides were incubated at 4 °C overnight in a primary antibodies diluted in blocking buffer. The following primary antibodies were used: SOX2 (Abcam, 92494, 1:100), integrin β4 (ITGB4; rat, 1:100, BD Pharmingen), K5 (guinea-pig, 1:500, Fuchs laboratory), After washing with PBS, sections were treated for 1 h at room temperature with secondary antibodies conjugated with Alexa 488, Alexa 594, or Alexa 647 (Life Technologies). Slides were washed, counterstained with 4′6′-diamidino- 2-phenilindole (DAPI), and mounted in Prolong Gold (Life Technologies). Images were acquired with an Axio Observer Z1 epifluorescence microscope equipped with a Hamamatsu ORCA-ER camera (Hamamatsu Photonics), and with an ApoTome.2 (Carl Zeiss) slider that reduces the light scatter in the fluorescent samples, using a 20× objective, controlled by Zen software (Carl Zeiss). RGB images were assembled using Imaris. Panels were labelled in Adobe Illustrator CS5. For immunohistochemistry, samples were processed, embedded in paraffin, and sectioned at 4 μm. Immunohistochemistry was performed on a Bond Rx auto-stainer (Leica Biosystems) with heat-mediated antigen retrieval using standard protocols. Antibodies used were rabbit monoclonal primary antibodies for phospho-4E-BP-1. Bond Polymer Refine Detection (Leica Biosystems) was used according to manufacturer’s protocol. Sections were then counterstained with haematoxycilin, dehydrated and film coverslipped using a TissueTek-Prisma and Coverslipper (Sakura). Whole slide scanning (40×) was performed on an Aperio AT2 (Leica Biosystems).
Statistics
Data were analysed and statistics performed in Prism6 (GraphPad) and R. Significant differences between two groups were noted by asterisks or actual P values (*P <0.05; **P <0.01; ***P < 0.001). Replicates (n) in this study refer to biological replicates.
Analysis of human HNSCC patient data
We analysed the publicly available data-sets of the The Cancer Genome Atlas (TCGA; https://cancergenome.nih.gov/). The cBioPortal for Cancer Genomics developed and maintained by the Computational Biology Center at Memorial Sloan-Kettering Cancer Center was used to mine the publicly available TCGA dataset on HNSCC12.
Lentivirus production and transduction
Production of vesicular stomatitis virus (VSV-G) pseudotyped lentivirus was performed by calcium phosphate transfection of 293FT cells (Invitrogen) with pLKO.1 and helper plasmids pMD2.G and psPAX2 (Addgene plasmid 12259 and 12260). Viral supernatant was collected 46 h after transfection and filtered through a 0.45-μm filter. For lentiviral infections in culture, cells were plated in 6-well plate at 1.0 ×10⁵ cells per well and incubated with viruses in the presence of polybrene (20 mg ml−1) for 30 min, and then plates were spun at 1,100g for 30 min at 37 °C in a Thermo IEC CL40R centrifuge. Infected cells were selected with puromycin.
For in vivo lentiviral transduction, the same viral supernatant as above was filtered (0.45-μm filter) and concentrated by ultracentrifugation. Final viral particle was resuspended in viral resuspension buffer (20 mM Tris pH 8.0, 250 mM NaCl, 10 mM MgCl2, 5% sorbitol) and 0.5 μl was in utero injected into E9.5 embryos, as described before49. For knockdown experiments, we used clones from the Broad Institute’s Mission TRC mouse library. For shRNA screen, virus was diluted in order to obtain a 10% infection rate.
Sample preparation and pre-amplification of shRNA screen
shRNA library was injected in E9.5 embryos and skins were collected as P0 postnatal animals. To distinguish between SOX2 and wild type, P0 pups were assessed for GFP expression (SOX2+). After euthanization, back and head skin was collected and epidermal cells were isolated from P0 mouse skin using previously established procedures14. For t = 0, keratinocytes were infected in vitro in three independent experiments and gDNA was isolated 24 h later.
Cells from individual embryos were used for genomic DNA isolation with the DNeasy Blood & Tissue Kit (Qiagen). gDNAs from transduced embryos of independent experiments were pooled (3 independent experiments in wild type and SOX2, total coverage of >400×). Typically two litters were pooled and processed separately as independent experiments (n = 3). Total DNA was used as template in pre-amplification reaction with 25 cycles and Phusion High-Fidelity DNA Polymerase (NEB). Per embryo, 4 μg of DNA was amplified. PCR products were then run on an 8% TBE gel and a clean ~240-bp band was isolated using DNA resuspension buffer (300 mM NaCl, 10 mM Tris (pH 8) and 1 mM EDTA) and incubated overnight at 20 °C. Samples were tested using the Agilent bioanalyzer. Final samples were then sent for Illumina HiSeq 2500 sequencing.
Statistical analysis of relative shRNA abundance
For each genotype, pooled DNAs from three independent experiments were sequenced independently. Illumina reads were trimmed to the 21-nucleotide hairpin sequence using the fastx toolkit and aligned to the TRC 2 library with Bowtie using a maximum edit distance of 3. Only shRNAs that showed at t = 0 more than 150 reads over three independent experiments were included for further analysis, resulting in a total of 601 shRNAs. shRNA abundance was then normalized and representation of shRNAs was compared against a control library with 35 non-targeting shRNAs (ratio of shRNA to average behaviour of control library). Representation of shRNAs were then analysed using the RIGER algorithm27, which ranks shRNAs according to their differential effects between two classes of samples, then identifies the genes targeted by the shRNAs at the top of the list. Please also see Extended Data Fig. 7 for additional methods and metrics.
Mouse strains
Rosa26-CAG-loxP-stop-loxP-Sox2-IRES-eGFP (R26-LSL-Sox2-IRES-eGFP+/+) mice were donated by J. Que and were maintained in a B6/svev129 mixed background. K14-cre(tg) mice were maintained in a CD-1-ICR background. Nude mice (Nu/Nu) for tumour cell grafts were from Charles River. Rosa26-CAG-loxP-stop-loxP-Cas9 mice were obtained from The Jackson Laboratory50. For ribosome profiling studies, females and males were used; for tumour allografts, only females were used.
Mice were housed and cared for in an AAALAC-accredited facility, and all animal experiments were conducted in accordance with IACUC-approved protocols.
Sample sizes to ensure adequate power were chosen using Gpower software51. No animals were excluded from analysis. Randomization and blinding were not used in this study.
Tumour formation
For allograft transplantation, 1.0 × 10⁵ mouse primary tumour cells were subcutaneously injected with growth-factor reduced Matrigel (Corning, 356231) in nude female mice (6–8 weeks old). Tumour size was measured every 5 days and calculated using the formula V =π/6 ×length ×width2. For limit-dilution transplantation, 1.0 ×10²–1.0 ×10⁴ mouse SCC cells were subcutaneously injected with growth-factor reduced Matrigel (Corning, 356231) in nude mice and tumour formation was assessed 4 weeks after injection. Estimated percentage of tumour-initiating cells were analysed by ELDA extreme limiting dilution analysis52. The maximal tumour size allowed as per IACUC committee was 20 mm, or smaller if tumour necrosis or bleeding occurred.
In vitro cell culture experiments
Newborn, primary mouse epidermal keratinocytes from R26-Sox2-IRES-eGFPfl/+ and K14-cre; R26-Sox2-IRES-eGFPfl/+ were cultured on 3T3-S2 feeder layer in 0.05 mM Ca2+ E-media supplemented with 15% serum53. HrasG12V; Tgfbr2 knockout cell line was generated previously in the Fuchs laboratory25. Cell lines were cultured in E medium with 15% FBS and 50 mM CaCl2. Cell lines were not tested for mycoplasma infection.
CRISPR in HrasG12V; Tgfbr2 knockout SCC cells
Three sgRNAs against Eif2a were selected from the GeCKO library and cloned into a lenti-CRISPR v2 vector (v2 vector was a gift from F. Zhang, Addgene plasmid 52961)54. Non-targeting control sgRNA was used side-by-side with sgRNAs against target sites throughout the experiments to rule out phenotypic changes due to nonspecific editing. HrasG12V; Tgfbr2 knockout mice were infected and selected with puromycin (3 μg ml−1) to obtain stable Eif2a knockout pools. To obtain clonal cell lines, single-cell sorting into 96-well plates was performed. Genomic DNAs from single clones were isolated, from which the targeted Eif2a locus was PCR amplified and Sanger sequenced to confirm editing. Three frameshift mutations were selected (targeted by sg1 and sg3). Knockout was confirmed by western blot.
Sequences of the guides
Eif2a sg1: 5′-TATAATCAATGTCGCTAACA-3′; Eif2a sg2: 5′-TGTAAGGCTGCCACGTTGCC-3′; Eif2a sg3: 5′-ACCGTGCTTTC TGTGAAGTG-3′; non-targeting: 5′-GCGAGGTATTCGGCTCCGCG-3′; Ctnnb1 uORF: 5′-GGCCTCCTGCACTGACGGCT-3′.
Measurement of protein synthesis
For protein synthesis analysis, 104–105 cells were plated in 12-well plates. OPP (Jena Biosciences) was added for 1 h at a concentration of 50 μM. Cells were then removed from wells and washed with PBS. The cell suspension was fixed in 0.5 ml of 1% paraformaldehyde in PBS for 15 min on ice and permeabilized in PBS containing 0.1% saponin (Sigma) for 5 min at room temperature. At this point the azide–alkyne cycloaddition reaction (using Alexa Fluor 594 azide, Life Technologies) was allowed to proceed for 30 min in the dark at room temperature using the Click-iT Cell Reaction Buffer Kit (Life Technologies). Cells were then washed three times in PBS supplemented with 2% FBS, resuspended in PBS, and immediately analysed by flow cytometry. As additional negative control, translational elongation inhibitor 100 μg ml−1 CHX (Sigma) was added 30 min before OPP. OPP fluorescence signal was compared between different genotypes after subtracting fluorescence from control (no OPP) samples.
Quantification of total proteome and pulsed SILAC labelling
Protein was extracted from mouse epidermis tissue for total proteome profiling and from HrasG12V; Tgfbr2 or HrasG12V; Tgfbr2; Eif2a knockout cells pulsed with heavy arginine (R10) and lysine (K6) for 0, 12, 24, 48 and 72 h for pulsed SILAC to measure newly translated proteins. Cell pellets were disrupted in 8 M urea and passed through a 20-gauge needle for 10 cycles and placed in a bath sonicator on ice for 30 min. Fifty micrograms of protein for three replicates from each condition was processed in parallel as follows: cysteines were reduced with dithiothreitol (Sigma) before alkylation with iodoacetamide (Sigma). Proteins were digested with LysC (Wako Chemicals) followed by trypsin (Promega) and desalted with Empore C18 STaGETips (3M)55.
One microgram of total protein was injected for nano-LC–MS/MS analysis. For the total proteome analysis, peptides were separated using a 12 cm ×75μm C18 column (Nikkyo Technos) at a flow rate of 200 nl min−1, with a 5–40% gradient over 160 min (buffer A 0.1% formic acid, buffer B 0.1% formic acid in acetonitrile), and a Q-Exactive Plus (ThermoScientific) was operated in data-dependent mode with a top 20 method. For the pulse SILAC analysis, peptides were separated with an EasySpray 50 cm column (ThermoScientific) over a 3 h gradient, at a flow rate of 300 nl min−1 and analysed by an Orbitrap Lumos operated in ‘top speed’ mode, with HCD/ion trap MS/MS scans.
Mass spectrometry data were analysed using MaxQuant (version 1.5) and Perseus software (version 1.4), searching against a Uniprot Mus musculus database (downloaded July 2014), allowing oxidation of methionine and protein N-terminal acetylation, and filtering at a 1% false discovery rate at the peptide and protein level. Proteins were quantified using LFQ values for the total proteome analysis; proteins were deemed significantly changing by t-test, using a corrected FDR less than 5%. For the pulse SILAC analysis, LFQ values from the heavy channel were used for quantitation.
Identification of uORF peptides
To identify proteins expressed from the untranslated region, a peptidome enrichment from epidermis tissue and protein N-terminus enrichment from P4 epidermis and SCCs was conducted before LC–MS/MS analysis and searching against a 5′ UTR database. The database was generated by including all 5′ UTRs with an average of more than 16 reads over all P4 in vivo epidermis samples (3 wild type and 3 SOX2).
The peptidome was enriched by passing 100 μg of undigested protein through a 30 kDa molecular mass cut-off filter (Millipore). Flow-through was further enriched by C18 reversed Oasis phase solid phase extraction columns (Waters), eluting in 50% acetonitrile, 0.1% TFA. The enriched peptidome was either analysed directly, or tryptic digested as above, to cover both short and long uORF peptides.
Protein N-terminal peptides were enriched by the TAILS method56. In brief, after protein denaturation, free amines were blocked by dimethyl labelling, digested, and internal (neo-N-terminal unblocked) peptides were depleted by crosslinking to HPG-ALD polymer. Enriched N termini were analysed by an Orbitrap Lumos operated in top speed mode, with alternating CID/ion trap and HCD/Orbitrap MS/MS scans.
Data were searched with Proteome Discover 1.4 using the Mascot search engine. Spectra not matched to the mouse proteome database with at least medium confidence (Percolator, confidence >95%) were exported for search of the 5′ UTR database, using 6-frame translation, semitryptic constraints, and peptide N-terminal acetylation. Data from the TAILS experiment were searched with semi-ArgC constraints with lysine dimethylation as a stable modification and N-terminal dimethylation as a variable modification. High confidence (>99%) peptides within 5 p.p.m. accuracy were submitted to BLAST to confirm that they did not match a predicted protein or contaminant. Manual analysis of MS/MS matches confirmed 13 uORF peptide sequences (Extended Data Fig. 5).
Minimum free energy calculation
Ribosome footprint reads were counted relative to a consensus 5′ UTR sequence for each gene as annotated by plastid. These genomic coordinates were used to build a library of 5′ UTR sequences using bed-tools. These sequences were input for the RNAfold algorithm of the ViennaRNA Package57. The algorithm computes base pairing probabilities of nucleotides within an RNA sequence to determine a single thermodynamically favoured structure as well as its free energy. This library of structural data was used to evaluate genes with 5′ UTRs differentially regulated by SOX2.
RiboTaper analysis
The Ribotaper22 pipeline was used to predict translated regions in ribosome profiling data from SOX2 keratinocytes (sample number 16).
Data availability
The data that support the findings of this study have been deposited in the Gene Expression Omnibus (GEO) repository with the accession code GSE83332. All other data are available from the corresponding author(s) upon reasonable request.
Extended Data
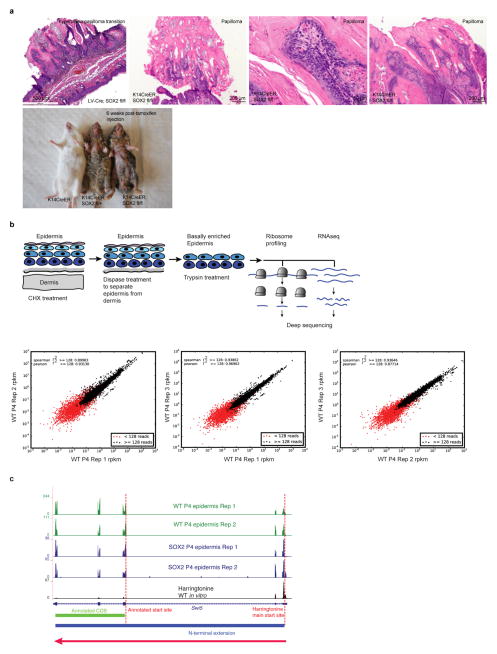
Extended Data Figure 1. Consequence of SOX2 expression in the epidermis and correlation between in vivo ribosome profiling experiments.
a, Papilloma formation induced by SOX2 overexpression in the skin. SOX2 expression in tamoxifen-inducible K14-creER; R26-Sox2-IRES-eGFPfl/fl mice results in hyperplasia and papilloma formation. Representative H&E sections are shown. Animals develop severe skin lesions in the ventral epidermis 6–8 weeks after tamoxifen injection and require euthanasia. b, Experimental strategy to perform in vivo epidermis-specific ribosome profiling. In vivo epidermis-specific ribosome profiling strategy results in highly reproducible quantifications. Plots show RPKM correlations between the 3 independent replicate experiments in wild-type P4 epidermis. Quantified in this study were mRNAs with >128 reads. c, N-terminal extension of the translated Swi5 mRNA in wild-type and SOX2 P4 epidermis in vivo. Tracks show ribosome profiling reads along the Swi5 mRNA for replicate samples of each genotype. The final track shows harringtonine-treated ribosome profiling reads of wild-type keratinocytes in vitro. Harringtonine blocks ribosomes at the translational start site and allows translation start site mapping18. Red arrow indicates direction of translation. Green bar marks the annotated CDS. Blue bar denotes the actual translated coding sequence based upon ribosomal profiling.
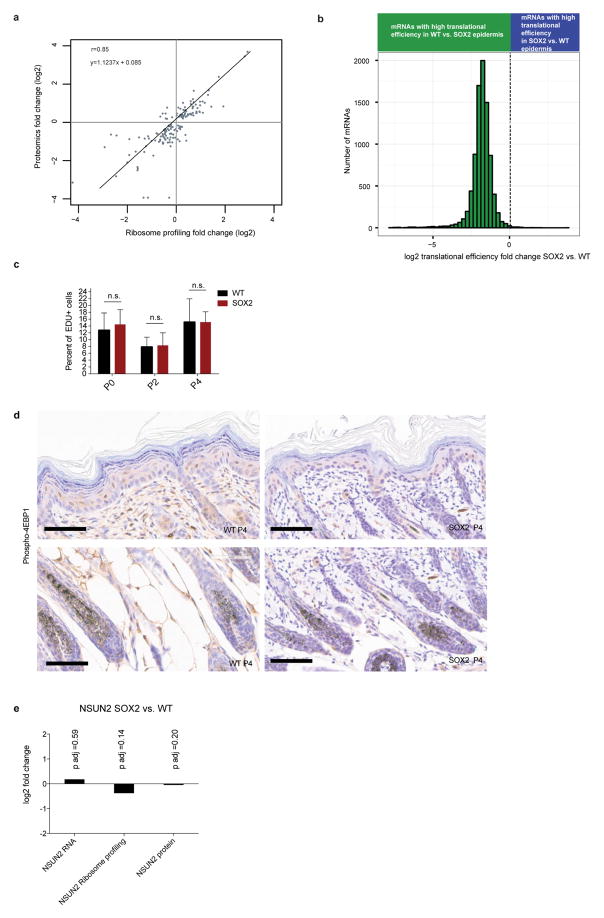
Extended Data Figure 2. Global translational efficiency is decreased upon SOX2 expression in keratinocytes in vitro.
a, Ribosome profiling data correlates with proteomics data. At a stage when proliferation and morphology were similar, freshly isolated, basally enriched keratinocytes from wild-type and SOX2-expressing P4 skins were subjected to in vivo ribosome profiling and to a label-free proteomics strategy. Plotted are proteomics fold changes compared to ribosome profiling fold changes. Comparisons are made in SOX2 versus wild-type samples for significantly changed proteins (false discovery rate (FDR) <0.05). b, Translational efficiency is markedly reduced in SOX2-expressing premalignant keratinocytes in vitro. Keratinocytes were isolated from R26-Sox2-IRES-eGFPfl/+ (WT) or K14-cre; R26-Sox2-IRES-eGFPfl/+ (SOX2+) P0 animals and cultured in vitro. Quantified were genes with more than 256 reads in RNA-seq data. Histogram shows distribution of differential translational efficiency (TE =RPKMribosome profiling/RPKMRNA-seq). Data are shown from 4 independent ribosome profiling experiments and 2 independent RNA-seq experiments. c, Wild-type and SOX2 keratinocytes have similar proliferation rates in vivo. Basal epidermal EdU incorporation in P0, P2 and P4 mice (n = 442/496, 385/449 and 903/841 cells from duplicate wild-type/SOX2 animals) 1 h after injection. Data are mean ±s.d. d, Phospho-4E-BP1 immunohistochemistry in the epidermis shows no difference in levels upon SOX2 induction. e, NSUN2 transcript, translation, and protein levels in SOX2 versus WT P4 epidermis.
Extended Data Figure 3. Translationally controlled genes show a shift towards cancer-related pathways.
Pathway analyses reveal a shift towards cancer-related pathways in mRNAs resistant to the SOX2-mediated global decrease in translational efficiency and in mRNAs with preferential uORF translation in premalignant SOX2+ P4 epidermis. Ingenuity pathway analysis (IPA) was used to analyse genes differentially regulated at four levels of control: transcriptional, translational, translational efficiency, and uORF/ORF ratio level. Included were the top 10% most upregulated and top 10% most downregulated genes at the levels of the transcriptome, translatome, and uORF usage. The translational efficiency list was restricted to the top and bottom-most 500 genes, corresponding to 6.6% of all genes. Total number of genes quantified: 4,725 transcriptome, 4,725 translatome, 7,605 translational efficiency, 1,830 uORFs.
Extended Data Figure 4. Translation from 5′ UTRs.
a, 5′ UTR translation of Myc in the P4 epidermis in vivo. As described previously, Myc mRNA contains several translated uORFs18. Right panels show higher magnification of the uORF start codons. b, 5′ UTR translation of Eif4g2 (encoding eIF4γ2) in the P4 epidermis in vivo. Harringtonine track shows main translation initiation site in the 5′ UTR. Right panels show higher magnification of the uORF start codons. c, 5′ UTR translation of Btg1 in the P4 epidermis in vivo. Harringtonine track shows main translation initiation site in the 5′ UTR. Right panels show higher magnification of the uORF start codons. d, Relative uORF translation in SOX2 versus wild-type keratinocytes using Harringtonine-treated samples. For each gene, the ratio of ribosome footprints in 5′ UTR of Harringtonine samples versus CHX-treated ORFs (for normalization) was calculated. Histogram shows distribution of log2 fold changes in relative 5′ UTR translation.
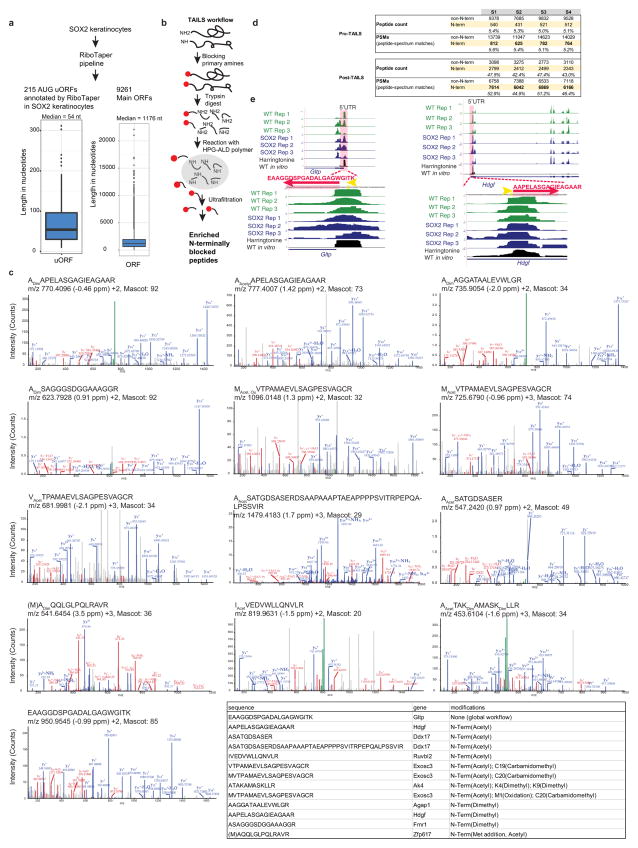
Extended Data Figure 5. Proteomic detection of 13 peptides produced from 5′ UTRs.
a, The RiboTaper analysis pipeline22 was used to annotate upstream ORFs computationally in an in vitro SOX2 keratinocyte sample. RiboTaper exploits the triplet periodicity of ribosomal footprints to predict bona fide translated regions. Boxplot shows the distribution of length of 215 uORFs which start with an AUG codon with a median length of 54 nucleotides. As a comparison, the right panel shows boxplot with the distribution of length of main ORFs predicted by RiboTaper. b, Schematic overview of the terminal amine isotopic labelling of substrates (TAILS) strategy to specifically enrich for N-terminal fragments. c, Overview of the pre- and post-TAILS peptide counts and peptide-spectrum matches. d, MS/MS spectra for identified uORF peptides. Representative MS/MS spectra for identified uORF peptides with monoisotopic (m/z), parent mass error (parts per million), charge state, and Mascot ion score. Matched y-ion fragments are shown in blue, b-ions in red, and unfragmented parents in green. Peptide N termini were identified as naturally N-terminally acetylated or unmodified. Owing to the protein-level primary amine blocking step in the TAILS workflow, naturally unmodified N termini and all lysines carry a dimethyl chemical modification. e, Ribosome profiling tracks showing translated uORF in P4 epidermis of the hepatoma-derived growth factor Hdgf and of the glycolipid transfer Gltp gene. Encoded peptides identified by high-resolution/high-mass-accuracy mass spectrometry using proteomics and peptidomics are shown. Red amino acids correspond to the identified peptides, yellow nucleotides mark potential initiation sites.
Extended Data Figure 6. SOX2-targeted 5′ UTRs are highly structured.
a, Genes with increased SOX2-regulated 5′ UTR translation also have longer 5′ UTRs and are more structured. The 10% of genes with the most increased 5′ UTR translation in SOX2 cells were evaluated relative to the 10% of genes with the largest decrease in 5′ UTR translation (error bars indicate range, n = 183 each, two-sided Wilcoxon test). b, Cumulative distribution plot showing length to structure comparison, an assessment for each gene’s 5′ UTR structure relative to its length. Analysis showing that SOX2-upregulated 5′ UTRs tend to have more favourable free energy at each length, suggesting that SOX2-regulated 5′ UTR secondary structures are more stable even when normalized for length (error bars indicate range, n = 183 each, two-sided Wilcoxon test). c, mRNAs showing preferential uORF translation in premalignant SOX2-expressing epidermis significantly overlap with mRNAs that are most resistant to the reduction in translational efficiency in premalignant SOX2 versus wild-type epidermis (hypergeometric test, P < 0.001). All mRNAs with a relative increase in the uORF/ORF ratio in SOX2 versus wild type were compared to the top 10% of mRNAs most resistant to reduction in translational efficiency in P4 SOX2 versus wild-type epidermis. Pathway analysis for the overlapping 122 genes (ingenuity pathway analysis) revealed epithelial–mesenchymal transition (EMT), stem-cell pluripotency, and axonal guidance as the top most enriched pathways. d, HrasG12V; Tgfbr2 knockout SCC tumour growth is dependent on SOX2 signalling. As shown in Fig. 4h, the HrasG12V; Tgfbr2 knockout is sufficient to upregulate SOX2 levels. Graph showing SCC tumour growth post-injection of 105 cells. Data are mean ±s.e.m. (n = 8 for each genotype). e, Overlap between uORF translation that occurs preferentially in premalignant SOX2-expressing P4 epidermis in vivo and uORF translation of malignant SOX2-expressing, HRAS-regulated SCC in vitro. Included were all mRNAs with twofold difference SOX2 versus wild-type P4 epidermis in vivo and twofold difference HrasG12V; Tgfbr2 knockout SCC versus wild-type keratinocytes in vitro. Hypergeometric test, P <0.001.
Extended Data Figure 7. An shRNA screen reveals regulatory nodes in premalignancy.
a, The 138 ribosomal genes and initiation factors targeted in our shRNA screen. b, Overview of the shRNA screen in wild-type versus premalignant SOX2-expressing epidermis from P0 mice. The RIGER algorithm27 was used with the following methods and metrics to convert hairpins to genes and to rank top hits. From left to the right: weighted sum, signal to noise (median); second best rank, signal to noise (median); weighted sum, signal to noise; weighted sum, fold change. c, Western blot shows knockdown efficiency of shRNAs targeting the top hit in our screen, Eif2s1. Note that the knockdown efficiency correlates well with the degree of shRNA depletion in the screen. d, Intra-amniotic injection of lentivirus library of Eif2a and 35 control shRNAs. This sub-library was injected into E9.5 embryos and representation of shRNAs was quantified in wild-type and SOX2 P0 skin. Top, knockdown efficiency; bottom, relative representation of Eif2a shRNAs (normalized against the control shRNA library) in wild-type versus SOX2 epidermis. e, DNA sequence of Eif2a knockout clonal cell lines used in our study. PAM region is highlighted in red, CRISPR target region in blue. f, g, Proliferation rates and overall protein synthesis rates are unchanged in Eif2a knockout cells under serum-rich conditions in vitro. SCC control and Eif2a knockout cells were quantified for EdU and OPP incorporation 1 h after administration. Data are mean ± s.d. of 4 independent experiments. h, The translational landscape is unchanged in Eif2a knockout cells under serum-rich conditions in vitro. SCC control and Eif2a knockout cells subjected to ribosome profiling and reads within the main ORFs were quantified and tested for differential expression using DESeq2. As opposed to 5′ UTR translation, no significant differences (adjusted P < 0.1 DESeq2) in ORF translation were found between SCC control and SCC Eif2a knockout cells (n = 2 SCC control, n =2 SCC Eif2a knockout). Right panels show two representative H&E sections of squamous cell carcinomas formed 25 days after subcutaneous injection of SCC cells. i, eIF2A-dependent changes of heavy-labelled peptides of CTNNB1 and CD44 under stress in pulsed SILAC. SCC control and SCC Eif2a knockout cells were grown in light-labelled medium and switched to heavy-labelled medium supplemented with 5 μM arsenite. Graphs show the relative difference between SCC control and SCC Eif2a knockout cells during the pulsed SILAC time course.
Extended Data Figure 8. mRNAs containing eIF2A-targeted uORFs are preferentially translated during tumorigenesis.
a–c, Genes that contain eIF2A-targeted uORFs maintain increased translation and translational efficiency of their downstream ORFs during early stages of tumorigenesis. HrasG12V; Tgfbr2 knockout SCCs were subcutaneously injected into nude mice. Day 5 or day 10 tumours were analysed by ribosome profiling and RNA-seq. Changes in transcription, translation and translational efficiency were assessed comparing in vivo against SCC in vitro data and represented as fold changes in Kernel density plots. Either only the significantly changed genes (DESeq2) or all genes were assessed. eIF2A-targeted versus non-eIF2A-targeted uORF genes refer to changes in uORF usage in SCC control versus SCC Eif2a knockout in Fig. 6a (n =2 SCC in vitro, n =2 SCC day 5, n = 2 SCC day 10, two-sample Kolmogorov–Smirnov test). d, Mutations in the eIF2A-regulated uORF of Ctnnb1, a key oncogene for SCC progression, diminishes its tumorigenic potential. Tracks show ribosome profiling reads in the 5′ UTR of Ctnnb1 and in the uORF GUG start codon. HrasG12V; Tgfbr2 knockout SCC keratinocytes were infected with either non-targeting control sgRNA or Ctnnb1 uORF sgRNAs. Clonal lines were sequenced and an uORF mutant clonal line was established. Data are mean ± s.e.m. following subcutaneous injection of 105 cells (n =8 control, n = 14 clone 2B).
Extended Data Figure 9. Human EIF2A is frequently amplified in human cancer.
a, Summary of cross-cancer alterations for EIF2A in human cancers12. 29% of patients with lung carcinoma and 15% of patients with head and neck SCCs show an amplification of the EIF2A locus. b, Summary of the clinical information accompanying TCGA patients with head and neck SCC.
Extended Data Figure 10. Overview of 5′ UTR translation and proteomics analyses.
a, Summary of different analyses of 5′ UTR translation in this study. b, Significantly changed proteins in SOX2 versus wild-type P4 epidermis in vivo (FDR <0.05).
Supplementary Material
Acknowledgments
We thank J. Que for the R26-Sox2-IRES-eGFP mice, D. Xu and the Cornell Genomics Facility for sequencing support, the Rockefeller Proteomics Facility for protein/peptide analyses, members of the Fuchs’ laboratory for discussions, and L. Polak and M. Sribour for their support with tumorigenesis studies. We thank E. Heller for bioinformatics support, L. Calviello for support with RiboTaper, and F. Garcia-Quiroz and M. Jovanovic for critical reading of the manuscript. The Rockefeller University Proteomics Resource Center acknowledges funding from the Leona M. and Harry B. Helmsley Charitable Trust and Sohn Conferences Foundation for mass spectrometer instrumentation. The results published here are in part based upon data generated by the TCGA Research Network (http://cancergenome.nih.gov/). A.S. was supported by the Human Frontier Science Program Organization (HFSP, LT000639-2013) and is currently supported by the People Programme (Marie Curie Actions) of the European Union’s Seventh Framework Programme FP7 under REA grant agreement no. 629861. S.N. is a Damon Runyon Fellow (DRG-2183-14). B.H. was supported by a Medical Scientist Training Program grant from the National Institute of General Medical Sciences of the National Institutes of Health under award number T32GM007739 to the Weill Cornell/Rockefeller/Sloan-Kettering Tri-Institutional MD-PhD Program. E.F. and J.S.W. are Investigators of the Howard Hughes Medical institute. This work was supported by grants to E.F. from the National Institutes of Health (R37-AR27883) and NYSTEM CO29559.
Footnotes
Supplementary Information is available in the online version of the paper.
Author Contributions A.S. and E.F. conceived the project, designed the experiments and wrote the manuscript. A.S. and B.H. performed the experiments, and collected and analysed data. J.G.D., E.H.R., J.S.W. and N.C.G. contributed to ribosome profiling data analysis. D.S. contributed to control shRNA library generation and established HrasG12V; Tgfbr2-null cell lines. S.N. contributed to OPP experiments. J.L. carried out in utero lentiviral injections. H.M. and B.D.D. performed proteomics experiments and analysed proteomics data. E.F. supervised the project. All authors discussed the results and edited the manuscript.
The authors declare no competing financial interests. Readers are welcome to comment on the online version of the paper.
Online Content Methods, along with any additional Extended Data display items and Source Data, are available in the online version of the paper; references unique to these sections appear only in the online paper.
References
- 1.Schwanhäusser B, et al. Global quantification of mammalian gene expression control. Nature. 2011;473:337–342. doi: 10.1038/nature10098. [DOI] [PubMed] [Google Scholar]
- 2.Zhang B, et al. Proteogenomic characterization of human colon and rectal cancer. Nature. 2014;513:382–387. doi: 10.1038/nature13438. [DOI] [PMC free article] [PubMed] [Google Scholar]
- 3.Mamane Y, Petroulakis E, LeBacquer O, Sonenberg N. mTOR, translation initiation and cancer. Oncogene. 2006;25:6416–6422. doi: 10.1038/sj.onc.1209888. [DOI] [PubMed] [Google Scholar]
- 4.Pelletier J, Graff J, Ruggero D, Sonenberg N. Targeting the eIF4F translation initiation complex: a critical nexus for cancer development. Cancer Res. 2015;75:250–263. doi: 10.1158/0008-5472.CAN-14-2789. [DOI] [PMC free article] [PubMed] [Google Scholar]
- 5.Sonenberg N, Hinnebusch AG. Regulation of translation initiation in eukaryotes: mechanisms and biological targets. Cell. 2009;136:731–745. doi: 10.1016/j.cell.2009.01.042. [DOI] [PMC free article] [PubMed] [Google Scholar]
- 6.Hsieh AC, et al. The translational landscape of mTOR signalling steers cancer initiation and metastasis. Nature. 2012;485:55–61. doi: 10.1038/nature10912. [DOI] [PMC free article] [PubMed] [Google Scholar]
- 7.Huang PY, Balmain A. Modeling cutaneous squamous carcinoma development in the mouse. Cold Spring Harb Perspect Med. 2014;4:a013623. doi: 10.1101/cshperspect.a013623. [DOI] [PMC free article] [PubMed] [Google Scholar]
- 8.Okubo T, Pevny LH, Hogan BLM. Sox2 is required for development of taste bud sensory cells. Genes Dev. 2006;20:2654–2659. doi: 10.1101/gad.1457106. [DOI] [PMC free article] [PubMed] [Google Scholar]
- 9.Que J, et al. Multiple dose-dependent roles for Sox2 in the patterning and differentiation of anterior foregut endoderm. Development. 2007;134:2521–2531. doi: 10.1242/dev.003855. [DOI] [PMC free article] [PubMed] [Google Scholar]
- 10.Boumahdi S, et al. SOX2 controls tumour initiation and cancer stem-cell functions in squamous-cell carcinoma. Nature. 2014;511:246–250. doi: 10.1038/nature13305. [DOI] [PubMed] [Google Scholar]
- 11.Rudin CM, et al. Comprehensive genomic analysis identifies SOX2 as a frequently amplified gene in small-cell lung cancer. Nat Genet. 2012;44:1111–1116. doi: 10.1038/ng.2405. [DOI] [PMC free article] [PubMed] [Google Scholar]
- 12.Gao J, et al. Integrative analysis of complex cancer genomics and clinical profiles using the cBioPortal. Sci Signal. 2013;6:pl1. doi: 10.1126/scisignal.2004088. [DOI] [PMC free article] [PubMed] [Google Scholar]
- 13.Beronja S, et al. RNAi screens in mice identify physiological regulators of oncogenic growth. Nature. 2013;501:185–190. doi: 10.1038/nature12464. [DOI] [PMC free article] [PubMed] [Google Scholar]
- 14.Beronja S, Livshits G, Williams S, Fuchs E. Rapid functional dissection of genetic networks via tissue-specific transduction and RNAi in mouse embryos. Nat Med. 2010;16:821–827. doi: 10.1038/nm.2167. [DOI] [PMC free article] [PubMed] [Google Scholar]
- 15.Liu K, et al. Sox2 cooperates with inflammation-mediated Stat3 activation in the malignant transformation of foregut basal progenitor cells. Cell Stem Cell. 2013;12:304–315. doi: 10.1016/j.stem.2013.01.007. [DOI] [PMC free article] [PubMed] [Google Scholar]
- 16.Ingolia NT, Ghaemmaghami S, Newman JRS, Weissman JS. Genome-wide analysis in vivo of translation with nucleotide resolution using ribosome profiling. Science. 2009;324:218–223. doi: 10.1126/science.1168978. [DOI] [PMC free article] [PubMed] [Google Scholar]
- 17.Brar GA, et al. High-resolution view of the yeast meiotic program revealed by ribosome profiling. Science. 2012;335:552–557. doi: 10.1126/science.1215110. [DOI] [PMC free article] [PubMed] [Google Scholar]
- 18.Ingolia NT, Lareau LF, Weissman JS. Ribosome profiling of mouse embryonic stem cells reveals the complexity and dynamics of mammalian proteomes. Cell. 2011;147:789–802. doi: 10.1016/j.cell.2011.10.002. [DOI] [PMC free article] [PubMed] [Google Scholar]
- 19.Tyner AL, Fuchs E. Evidence for posttranscriptional regulation of the keratins expressed during hyperproliferation and malignant transformation in human epidermis. J Cell Biol. 1986;103:1945–1955. doi: 10.1083/jcb.103.5.1945. [DOI] [PMC free article] [PubMed] [Google Scholar]
- 20.Signer RAJ, Magee JA, Salic A, Morrison SJ. Haematopoietic stem cells require a highly regulated protein synthesis rate. Nature. 2014;509:49–54. doi: 10.1038/nature13035. [DOI] [PMC free article] [PubMed] [Google Scholar]
- 21.Blanco S, et al. Stem cell function and stress response are controlled by protein synthesis. Nature. 2016;534:335–340. doi: 10.1038/nature18282. [DOI] [PMC free article] [PubMed] [Google Scholar]
- 22.Calviello L, et al. Detecting actively translated open reading frames in ribosome profiling data. Nat Methods. 2016;13:165–170. doi: 10.1038/nmeth.3688. [DOI] [PubMed] [Google Scholar]
- 23.Slavoff SA, et al. Peptidomic discovery of short open reading frame-encoded peptides in human cells. Nat Chem Biol. 2013;9:59–64. doi: 10.1038/nchembio.1120. [DOI] [PMC free article] [PubMed] [Google Scholar]
- 24.Falini B, et al. Translocations and mutations involving the nucleophosmin (NPM1) gene in lymphomas and leukemias. Haematologica. 2007;92:519–532. doi: 10.3324/haematol.11007. [DOI] [PubMed] [Google Scholar]
- 25.Yang H, et al. ETS family transcriptional regulators drive chromatin dynamics and malignancy in squamous cell carcinomas. eLife. 2015;4:e10870. doi: 10.7554/eLife.10870. [DOI] [PMC free article] [PubMed] [Google Scholar]
- 26.Morris DR, Geballe AP. Upstream open reading frames as regulators of mRNA translation. Mol Cell Biol. 2000;20:8635–8642. doi: 10.1128/mcb.20.23.8635-8642.2000. [DOI] [PMC free article] [PubMed] [Google Scholar]
- 27.Luo B, et al. Highly parallel identification of essential genes in cancer cells. Proc Natl Acad Sci USA. 2008;105:20380–20385. doi: 10.1073/pnas.0810485105. [DOI] [PMC free article] [PubMed] [Google Scholar]
- 28.Hinnebusch AG. The scanning mechanism of eukaryotic translation initiation. Annu Rev Biochem. 2014;83:779–812. doi: 10.1146/annurev-biochem-060713-035802. [DOI] [PubMed] [Google Scholar]
- 29.Harding HP, et al. Regulated translation initiation controls stress-induced gene expression in mammalian cells. Mol Cell. 2000;6:1099–1108. doi: 10.1016/s1097-2765(00)00108-8. [DOI] [PubMed] [Google Scholar]
- 30.Skabkin MA, et al. Activities of Ligatin and MCT-1/DENR in eukaryotic translation initiation and ribosomal recycling. Genes Dev. 2010;24:1787–1801. doi: 10.1101/gad.1957510. [DOI] [PMC free article] [PubMed] [Google Scholar]
- 31.Dmitriev SE, et al. GTP-independent tRNA delivery to the ribosomal P-site by a novel eukaryotic translation factor. J Biol Chem. 2010;285:26779–26787. doi: 10.1074/jbc.M110.119693. [DOI] [PMC free article] [PubMed] [Google Scholar]
- 32.Zoll WL, Horton LE, Komar AA, Hensold JO, Merrick WC. Characterization of mammalian eIF2A and identification of the yeast homolog. J Biol Chem. 2002;277:37079–37087. doi: 10.1074/jbc.M207109200. [DOI] [PubMed] [Google Scholar]
- 33.Terenin IM, Dmitriev SE, Andreev DE, Shatsky IN. Eukaryotic translation initiation machinery can operate in a bacterial-like mode without eIF2. Nat Struct Mol Biol. 2008;15:836–841. doi: 10.1038/nsmb.1445. [DOI] [PubMed] [Google Scholar]
- 34.Starck SR, et al. Leucine-tRNA initiates at CUG start codons for protein synthesis and presentation by MHC class I. Science. 2012;336:1719–1723. doi: 10.1126/science.1220270. [DOI] [PubMed] [Google Scholar]
- 35.Starck SR, et al. Translation from the 5′ untranslated region shapes the integrated stress response. Science. 2016;351:aad3867. doi: 10.1126/science.aad3867. [DOI] [PMC free article] [PubMed] [Google Scholar]
- 36.Cancer Genome Atlas Network. Comprehensive genomic characterization of head and neck squamous cell carcinomas. Nature. 2015;517:576–582. doi: 10.1038/nature14129. [DOI] [PMC free article] [PubMed] [Google Scholar]
- 37.Liu B, Qian SB. Translational reprogramming in cellular stress response. WIREs RNA. 2014;5:301–315. doi: 10.1002/wrna.1212. [DOI] [PMC free article] [PubMed] [Google Scholar]
- 38.Koromilas AE. Roles of the translation initiation factor eIF2α serine 51 phosphorylation in cancer formation and treatment. Biochim Biophys Acta. 2015;1849:871–880. doi: 10.1016/j.bbagrm.2014.12.007. [DOI] [PubMed] [Google Scholar]
- 39.Komar AA, et al. Novel characteristics of the biological properties of the yeast Saccharomyces cerevisiae eukaryotic initiation factor 2A. J Biol Chem. 2005;280:15601–15611. doi: 10.1074/jbc.M413728200. [DOI] [PubMed] [Google Scholar]
- 40.Reineke LC, Cao Y, Baus D, Hossain NM, Merrick WC. Insights into the role of yeast eIF2A in IRES-mediated translation. PLoS One. 2011;6:e24492. doi: 10.1371/journal.pone.0024492. [DOI] [PMC free article] [PubMed] [Google Scholar]
- 41.Holcik M. Could the eIF2α-independent translation be the achilles heel of cancer? Front Oncol. 2015;5:264. doi: 10.3389/fonc.2015.00264. [DOI] [PMC free article] [PubMed] [Google Scholar]
- 42.Liang H, et al. PTENα, a PTEN isoform translated through alternative initiation, regulates mitochondrial function and energy metabolism. Cell Metab. 2014;19:836–848. doi: 10.1016/j.cmet.2014.03.023. [DOI] [PMC free article] [PubMed] [Google Scholar]
- 43.Love MI, Huber W, Anders S. Moderated estimation of fold change and dispersion for RNA-seq data with DESeq2. Genome Biol. 2014;15:550. doi: 10.1186/s13059-014-0550-8. [DOI] [PMC free article] [PubMed] [Google Scholar]
- 44.Gerashchenko MV, Gladyshev VN. Translation inhibitors cause abnormalities in ribosome profiling experiments. Nucleic Acids Res. 2014;42:e134. doi: 10.1093/nar/gku671. [DOI] [PMC free article] [PubMed] [Google Scholar]
- 45.Ingolia NT, Brar GA, Rouskin S, McGeachy AM, Weissman JS. The ribosome profiling strategy for monitoring translation in vivo by deep sequencing of ribosome-protected mRNA fragments. Nat Protocols. 2012;7:1534–1550. doi: 10.1038/nprot.2012.086. [DOI] [PMC free article] [PubMed] [Google Scholar]
- 46.Langmead B, Salzberg SL. Fast gapped-read alignment with Bowtie 2. Nat Methods. 2012;9:357–359. doi: 10.1038/nmeth.1923. [DOI] [PMC free article] [PubMed] [Google Scholar]
- 47.Kim D, et al. TopHat2: accurate alignment of transcriptomes in the presence of insertions, deletions and gene fusions. Genome Biol. 2013;14:R36. doi: 10.1186/gb-2013-14-4-r36. [DOI] [PMC free article] [PubMed] [Google Scholar]
- 48.Dunn JG, Weissman JS. Plastid: nucleotide-resolution analysis of next-generation sequencing and genomics data. BMC Genomics. 2016;17:958. doi: 10.1186/s12864-016-3278-x. [DOI] [PMC free article] [PubMed] [Google Scholar]
- 49.Beronja S, Fuchs E. RNAi-mediated gene function analysis in skin. Methods Mol Biol. 2013;961:351–361. doi: 10.1007/978-1-62703-227-8_23. [DOI] [PMC free article] [PubMed] [Google Scholar]
- 50.Platt RJ, et al. CRISPR-Cas9 knockin mice for genome editing and cancer modeling. Cell. 2014;159:440–455. doi: 10.1016/j.cell.2014.09.014. [DOI] [PMC free article] [PubMed] [Google Scholar]
- 51.Faul F, Erdfelder E, Buchner A, Lang AG. Statistical power analyses using G*Power 3.1: tests for correlation and regression analyses. Behav Res Methods. 2009;41:1149–1160. doi: 10.3758/BRM.41.4.1149. [DOI] [PubMed] [Google Scholar]
- 52.Hu Y, Smyth GK. ELDA: extreme limiting dilution analysis for comparing depleted and enriched populations in stem cell and other assays. J Immunol Methods. 2009;347:70–78. doi: 10.1016/j.jim.2009.06.008. [DOI] [PubMed] [Google Scholar]
- 53.Blanpain C, Lowry WE, Geoghegan A, Polak L, Fuchs E. Self-renewal, multipotency, and the existence of two cell populations within an epithelial stem cell niche. Cell. 2004;118:635–648. doi: 10.1016/j.cell.2004.08.012. [DOI] [PubMed] [Google Scholar]
- 54.Sanjana NE, Shalem O, Zhang F. Improved vectors and genome-wide libraries for CRISPR screening. Nat Methods. 2014;11:783–784. doi: 10.1038/nmeth.3047. [DOI] [PMC free article] [PubMed] [Google Scholar]
- 55.Ishihama Y, Rappsilber J, Mann M. Modular stop and go extraction tips with stacked disks for parallel and multidimensional peptide fractionation in proteomics. J Proteome Res. 2006;5:988–994. doi: 10.1021/pr050385q. [DOI] [PubMed] [Google Scholar]
- 56.Kleifeld O, et al. Identifying and quantifying proteolytic events and the natural N terminome by terminal amine isotopic labeling of substrates. Nat Protocols. 2011;6:1578–1611. doi: 10.1038/nprot.2011.382. [DOI] [PubMed] [Google Scholar]
- 57.Hofacker IL. RNA secondary structure analysis using the Vienna RNA package. Curr Protoc Bioinformatics. 2009;Chapter 12(Unit12.2) doi: 10.1002/0471250953.bi1202s26. [DOI] [PubMed] [Google Scholar]
Associated Data
This section collects any data citations, data availability statements, or supplementary materials included in this article.
Supplementary Materials
Data Availability Statement
The data that support the findings of this study have been deposited in the Gene Expression Omnibus (GEO) repository with the accession code GSE83332. All other data are available from the corresponding author(s) upon reasonable request.


