ABSTRACT
Galactitol degradation by salmonellae remains underinvestigated, although this metabolic capability contributes to growth in animals (R. R. Chaudhuri et al., PLoS Genet 9:e1003456, 2013, https://doi.org/10.1371/journal.pgen.1003456). The genes responsible for this metabolic capability are part of a 9.6-kb gene cluster that spans from gatY to gatR (STM3253 to STM3262) and encodes a phosphotransferase system, four enzymes, and a transporter of the major facilitator superfamily. Genome comparison revealed the presence of this genetic determinant in nearly all Salmonella strains. The generation time of Salmonella enterica serovar Typhimurium strain ST4/74 was higher in minimal medium with galactitol than with glucose. Knockout of STM3254 and gatC resulted in a growth-deficient phenotype of S. Typhimurium, with galactitol as the sole carbon source. Partial deletion of gatR strongly reduced the lag phase of growth with galactitol, whereas strains overproducing GatR exhibited a near-zero growth phenotype. Luciferase reporter assays demonstrated strong induction of the gatY and gatZ promoters, which control all genes of this cluster except gatR, in the presence of galactitol but not glucose. Purified GatR bound to these two main gat gene cluster promoters as well as to its own promoter, demonstrating that this autoregulated repressor controls galactitol degradation. Surface plasmon resonance spectroscopy revealed distinct binding properties of GatR toward the three promoters, resulting in a model of differential gat gene expression. The cyclic AMP receptor protein (CRP) bound these promoters with similarly high affinities, and a mutant lacking crp showed severe growth attenuation, demonstrating that galactitol utilization is subject to catabolite repression. Here, we provide the first genetic characterization of galactitol degradation in Salmonella, revealing novel insights into the regulation of this dissimilatory pathway.
IMPORTANCE The knowledge of how pathogens adapt their metabolism to the compartments encountered in hosts is pivotal to our understanding of bacterial infections. Recent research revealed that enteropathogens have adapted specific metabolic pathways that contribute to their virulence properties, for example, by helping to overcome limitations in nutrient availability in the gut due to colonization resistance. The capability of Salmonella enterica serovar Typhimurium to degrade galactitol has already been demonstrated to play a role in vivo, but it has not been investigated so far on the genetic level. To our knowledge, this is the first molecular description of the galactitol degradation pathway of a pathogen.
KEYWORDS: galactitol utilization, Salmonella Typhimurium, regulation, metabolism, gene regulation
INTRODUCTION
Salmonella enterica serovar Typhimurium is a Gram-negative, facultative anaerobic microorganism that causes nontyphoidal gastroenteritis in humans and typhoid-like disease in mice (1). Specifically, it is a foodborne pathogen that invades its host following ingestion of contaminated food or water, eventually leading to salmonellosis (2). S. Typhimurium is also one of the most important model organisms for investigation of bacterial genetics and microbial pathogenicity. Because effector proteins are translocated by two type III secretion systems encoded by separate Salmonella pathogenicity islands (SPIs), Salmonella strains can invade epithelial cells and survive in macrophages within the so-called Salmonella-containing vacuoles (SCVs) (3–6). During infection, S. Typhimurium requires sufficient energy as well as carbon and nitrogen sources to proliferate, produce its virulence factors, and withstand the host immune response. However, the acquisition of nutrients is a major challenge for S. Typhimurium in the intestine because of the colonization resistance of the commensal microbiota, which confers a highly competitive host environment for substrate availability. To overcome these limitations, enteropathogens have developed specific metabolic capacities that include the utilization of ethanolamine, propanediol, or myo-inositol (7–13). These catabolic properties are considered critical to virulence; therefore, further characterization of the metabolic profile of S. Typhimurium is of interest.
More than 60 carbon sources can be utilized by S. Typhimurium. Among them are fructose, galactose, glucose, glycerol, meso-inositol, mannitol, mannose, and ribose (14), but a detailed characterization of the degradation pathway for some of these is still lacking. An example is galactitol (dulcitol), one of the three naturally occurring hexitols (the others are glucitol and mannitol) produced by many plants of genera such as Cordylanthus, Leptorhabdos, Melampyrum, and Digitalis. About one-half of Escherichia coli isolates ferment galactitol (15). The galactitol analogues l-fucitol and 2-desoxy-d-galactitol inhibit the growth of E. coli, but not that of S. Typhimurium, with this hexitol (16). Temperature-sensitive mutations that lead to constitutive expression of the gat operon have been isolated, and one was identified in gatR (17–19). As this mutation could be complemented by a gatR+ allele to yield an inducible phenotype, and because a truncated gatR resulted in constitutive expression of gat genes, GatR was proposed to act as a repressor (20). A prerequisite for galactitol dissimilation is the uptake by a phosphotransferase system (PTS) involving a specific enzyme II that phosphorylates galactitol and three enzymes that sequentially convert galactitol-1-phosphate to d-tagatose 6-phosphate by an NAD-linked dehydrogenase, phosphorylate this intermediate, and finally catalyze the production of dihydroxyacetone-phosphate (DHAP) and glyceraldehyde-phosphate (GAP) (21). For utilization of galactitol, S. Typhimurium contains a putative galactitol-specific PTS that enables galactitol uptake. This putative transport system is thought to be encoded by the gat gene cluster of 9.6-kb length encompassing 10 genes. Transposon insertion in this region yields a slightly attenuated growth phenotype in different hosts, such as chicken, mouse, pig, and calf (22).
The molecular genetics of galactitol degradation by a pathogen have not been investigated. Here, we demonstrate that the knockout of several genes in the S. Typhimurium gat gene cluster results in a growth-negative phenotype with galactitol as the sole carbon source. The activities of gat gene promoters under various growth conditions are quantified using luciferase or green fluorescent protein (GFP) as reporters. The interaction of the regulatory protein GatR is demonstrated by reporter assays, electrophoretic mobility shift assays (EMSAs), and surface plasmon resonance (SPR) spectroscopy, identifying GatR as a repressor of Salmonella galactitol utilization that also controls its own expression.
RESULTS
Growth properties of Salmonella strains in the presence of galactitol.
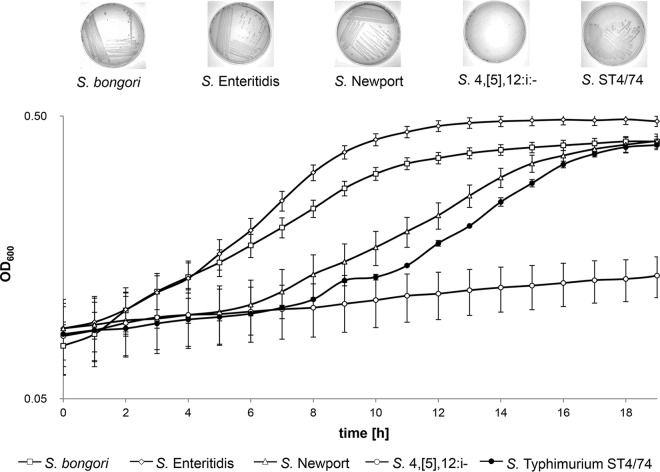
Salmonella bongori, S. enterica serovar Enteritidis, S. enterica serovar Newport, S. Typhimurium ST4/74, S. Typhimurium 14028S, and S. enterica serotype 4,[5],12:i:− strain CVM23701 were cultivated in microtiter plates containing minimal medium (MM) with 54.9 mM galactitol as the sole carbon and energy source (Fig. 1). While the latter two strains exhibited nearly zero growth, all other strains grew to an optical density at 600 nm (OD600) of approximately 0.45 to 0.5. The generation time of strain ST4/74 was 4.66 h. By comparison, strain ST4/74 reached a maximum OD600 of 0.7, with a shorter generation time of 1.94 h, when galactitol was exchanged for glucose (see Fig. S1 in the supplemental material). Growth of S. Newport and S. Typhimurium ST4/74 in MM-galactitol was characterized by extended lag phases of 6 and 8 h, respectively. No growth of S. Typhimurium 14028S and Salmonella 4,[5],12:i− (23) was observed on agar plates with galactitol-containing MM. Although strain ST4/74 grew equally at concentrations of 0.3% to 1.0% galactitol (data not shown), we used 1% for all further experiments. To investigate the genetic mechanisms underlying the capability of Salmonella strains to utilize galactitol, we deleted the gene cluster STM3779-STM3785, which is part of Salmonella pathogenicity island 3 (SPI-3) and harbors a gene that encodes a putative galactitol-specific IIc protein. As the deletion mutant still grew in galactitol, we reinvestigated the S. Typhimurium LT2 genome for a gene cluster responsible for utilization of this hexitol and identified STM3253-STM3262 as a candidate cluster because it carries a gene coding for a tagatose-1-phosphokinase.
FIG 1.
Growth curves of Salmonella strains in MM containing galactitol as the sole carbon source. S. Typhimurium ST4/74, S. bongori, S. Enteritidis, S. Newport, and S. enterica serotype 4,[5],12:i:− strain CVM23701 were grown overnight in LB medium. MM containing 1% galactitol was inoculated at 1:100 and incubated for 19 h at 37°C without shaking. OD600 was measured each hour. The insets document growth of these strains on agar plates with galactitol-containing MM.
The gene cluster STM3253 to STM3262 is responsible for galactitol utilization by S. enterica serovar Typhimurium.
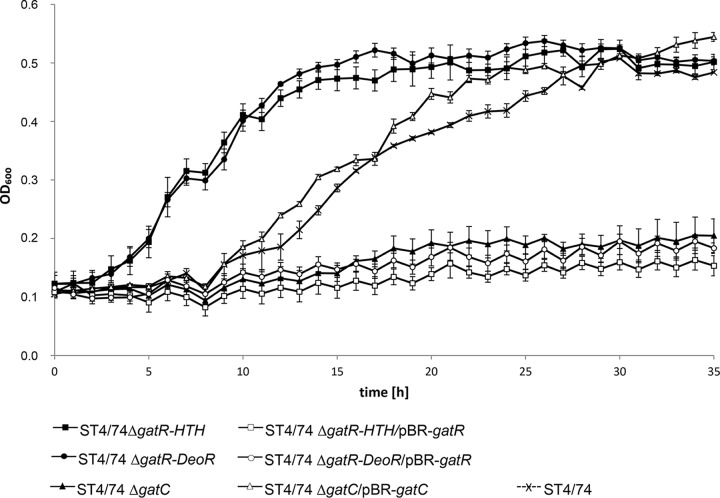
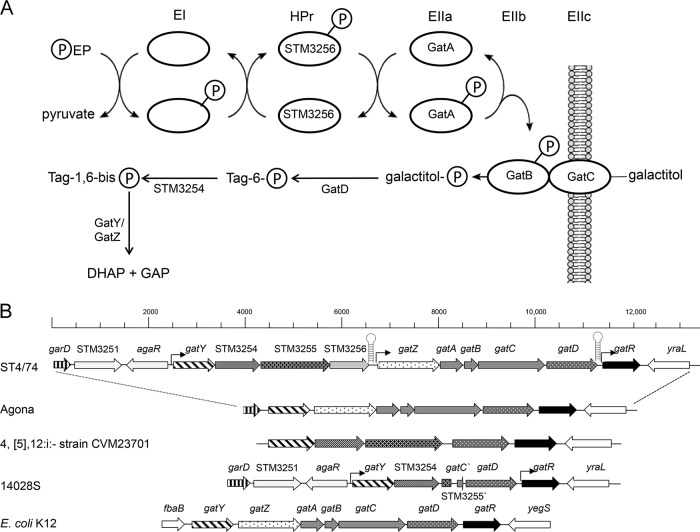
To test this prediction, we generated mutants of S. Typhimurium strain ST4/74 lacking STM3254, encoding a putative phosphofructokinase, gatC, coding for a putative galactitol-specific IIC component, and the regulatory gene gatR. The ST4/74 ΔgatC and ST4/74 ΔSTM3254 mutants showed zero growth in galactitol but reverted to a wild-type-like phenotype when transformed with plasmids pBR-gatC and pBAD-STM3254, respectively (Fig. 2). We also generated two partial deletion mutants lacking either the putative DNA-binding domain (ΔgatR-HTH) or the putative oligomerization domain (ΔgatR-DeoR) of GatR. Both mutants exhibited a reduced lag phase during growth with galactitol, whereas growth was inhibited when the gatR gene was provided in trans by pBR-gatR (Fig. 2). All strains investigated here were also grown in MM with glucose to confirm that attenuation specifically occurs in the presence of galactitol (Fig. S1). These data demonstrate that the gene cluster STM3253 to STM3262, which encodes a PTS and catabolic enzymes (Fig. 3A), is responsible for the utilization of galactitol by salmonellae.
FIG 2.
Growth of deletion mutants and effects of complementation. S. Typhimurium ST4/74 and its ST4/74 ΔgatR-HTH, ST4/74 ΔgatR-DeoR, and ST4/74 ΔgatC mutants were cultivated, and the OD600 was monitored as described in the legend to Fig. 1. The ST4/74 ΔgatC mutant did not grow with galactitol, and the presence of complementing plasmid pBR-gatC restored the growth behavior of the parental strain. ST4/74 ΔgatR-HTH and ST4/74 ΔgatR-DeoR mutants exhibited a reduced lag phase but did not grow when transfected with complementing plasmid pBR-gatR.
FIG 3.
Galactitol operon of S. Typhimurium. (A) Scheme of the galactitol-specific PTS system. GatA, galactitol-specific IIA component; GatB, galactitol-specific IIB component; GatC, galactitol-specific IIC component; GatD, NAD-dependent galactitol-1-phosphate dehydrogenase; GatY/GatZ, tagatose-1,6-bisphosphate aldolase subunits; STM3254, putative phosphofructokinase; STM3255, putative tagatose-specific EIIBC component; STM3256, phosphoryl transfer protein; HPr, histidine protein; EI, (unspecific) enzyme I. (B) Genomic architecture. The galactitol operon consists of 10 genes (gatY-gatR). garD encodes galactarate dehydratase, agaR encodes a transcriptional regulator, yraL encodes a methyltransferase, and yegS encodes a phosphatidylglycerol kinase. The (hypothetical) functions of the proteins encoded by the gat genes are listed above the symbols. Putative promoters are shown as arrows, and putative terminator regions are shown as hairpins.
Distribution of the gat genes in salmonellae and other bacteria.
Investigation of all available Salmonella genomes identified two distinct gat gene clusters. The first one is represented by genes STM3253 to STM3262 of S. Typhimurium strain ST4/74 (Fig. 3B) and was found in the genomes of a further 32 S. enterica serovars (see the supplemental material). It is flanked by agaR and yraL and carries three additional genes of hypothetical function in tagatose uptake and metabolization (STM3254 to STM3256) that are absent from the second cluster. The second gat gene cluster, which is flanked by garD and yraL, has a genetic organization resembling that of E. coli (Fig. 3B) and is found in the genomes of 30 S. enterica serovars, including S. Agona (see the supplemental material), and of the species S. bongori. The latter species and the two serovars, S. Enteritidis and S. Newport, showed growth similar to that of strain ST4/74 in MM with 1% galactitol (Fig. 1). In contrast, sequence analysis revealed that the genome of strain S. Typhimurium 14028S harbors gatY, STM3254, gatD, and gatR but only the first 682 bp of STM3255 and the last 121 bp of gatC, while the genes STM2356, gatZ (STM3257), gatA, and gatB are missing (Fig. 3B). The genome of S. enterica serotype 4,[5],12:i:− strain CVM23701 lacks STM3256, gatZ, gatA, gatB, and gatC. Thus, the reduced gat gene cluster in both strains sufficiently explains their growth on MM with galactitol (Fig. 1).
The GC content of the gene cluster STM3253 to STM3262 (50.23%) does not significantly differ from that of the whole genome (52.2%), a finding that suggests ancient acquisition of the Salmonella gat gene cluster by horizontal gene transfer.
Transcriptional activity of genes involved in the degradation of galactitol.
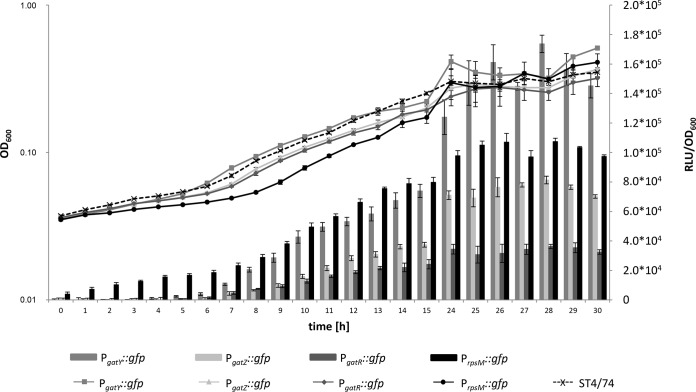
The promoter prediction program BPROM identified three putative promoters, PgatY, PgatZ, and PgatR, within the gene cluster STM3253-STM3262. To evaluate their activities, the promoters were chromosomally fused with the reporter gene gfp, and gene transcription was measured by fluorometry. During growth in MM with galactitol as the sole carbon source, all three strains exhibited a strong fluorescence signal. Promoter PgatY showed the highest transcriptional activity (maximal relative light units [RLU]/OD600 of 1.7 × 10⁵ versus 8.1 × 10⁴ for PgatZ and 3.6 × 10⁴ for PgatR) (Fig. 4). Fluorescence was detectable when the lag phase ended, and it stagnated and decreased when the culture reached the stationary phase. No light emission was observed when the three reporter strains were cultivated in medium lacking galactitol, indicating a specific growth response to the presence of this hexitol. As a control, we fused gfp with the promoter of the housekeeping gene rpsM (PrpsM::gfp) on the chromosome and found transcriptional activity between that of PgatY and PgatZ.
FIG 4.
Transcriptional activities of PgatY, PgatZ, PgatR, and PrpsM. Reporter strains ST4/74 PgatZ::gfp, ST4/74 PgatR::gfp, ST4/74 PgatY::gfp, and ST4/74 PrpsM::gfp were grown in MM with 1% galactitol. Fluorescence and OD600 were measured in parallel for 30 h. Average values from three independent measurements with three wells each are indicated (±standard deviations).
The promoters of gatZ, gatY, and gatR are negatively regulated by GatR.
To determine the function of the putative regulator GatR, we introduced plasmid pBAD-gatR into the ST4/74 PgatY::lux and ST4/74 PgatZ::lux reporter strains. Luminescence activities were then measured during growth in MM with galactitol in the presence of GatR overproduced by addition of arabinose at a 5-h postinoculation time point. Under this condition, ST4/74 continued to grow with galactitol, albeit at a reduced division rate. As controls, we used strains harboring the empty vector pBAD-Myc/His and pBAD-reiD, carrying a regulatory gene encoding ReiD, which plays a role in another dissimilatory pathway (24). Both ST4/74 PgatY::lux and ST4/74 PgatZ::lux strains showed reduced transcriptional activity in the presence of overproduced GatR (to 17% and 1%, respectively) but not upon overproduction of ReiD (Table 1). When arabinose was added immediately after inoculation, no growth of the strains in MM with galactitol was observed. These findings suggested that GatR has an inhibitory role in the galactitol utilization pathway.
TABLE 1.
Quantification of gat promoter activitiesa
| Genotype and promoter | Plasmid | Activity for ST4/74 grown in M9 with galactitolb |
P value | |
|---|---|---|---|---|
| RLU/OD600 | SD (%) | |||
| gatY | ||||
| PgatY::lux | pBAD | 1,559,216 | 11.29 | Reference |
| PgatY::lux | pBAD-gatR | 259,972 | 9.23 | 0.00012c |
| PgatY::lux | pBAD-reiD | 2,239,118 | 0.43 | 0.41 |
| gatZ | ||||
| PgatZ::lux | pBAD | 449,647 | 4.04 | Reference |
| PgatZ::lux | pBAD-gatR | 4,557 | 4.95 | 9.17 × 10⁻⁷c |
| PgatZ::lux | pBAD-reiD | 479,851 | 9.24 | 0.63 |
| gatR | ||||
| PgatR::lux | pBAD | 402,563 | 7.26 | Reference |
| PgatR::lux | pBAD-gatR | 27,506 | 7.72 | 3.77 × 10⁻⁶c |
| PgatR::lux | pBAD-reiD | 316,429 | 1.83 | 0.032 |
Samples were taken from the late exponential phase.
Luminescence of ST4/74 strains growing in M9 containing galactitol as the sole carbon source was measured in late exponential phase. Arabinose (0.02%) was added 5 h after inoculation. Data are averages from three independent experiments.
P value of <0.0005.
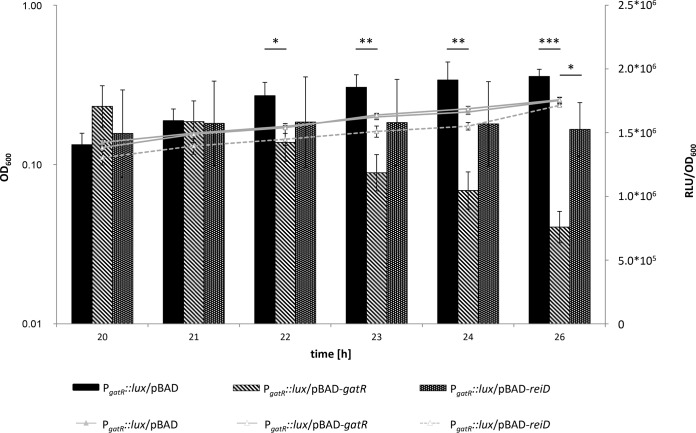
The expression of gatR in the ST4/74 PgatR::lux strain with pBAD-Myc/His (RLU/OD600 of 1.94 × 10⁶; standard deviation [SD], 3.35%) was strongly reduced in the presence of pBAD-gatR after addition of arabinose at 20 h (RLU/OD600 of 7.59 × 10⁵; SD, 6.37%) (Fig. 5), indicating that gatR is negatively regulated by its own product.
FIG 5.
Negative autoregulation of PgatR. Strain ST4/74 PgatR::lux was grown in MM containing 1% galactitol. Arabinose (0.02%) was added 20 h after inoculation. Fluorescence and OD600 were measured in parallel for 26 h. Average values from three independent measurements with three wells each are indicated, as are the standard deviations. *, P < 0.05; **, P < 0.005; ***, P < 0.0005.
Interaction of GatR with PgatR, PgatY, and PgatZ.
To assess the binding activity of GatR to its own promoter, complex formation of purified His-tagged GatR overproduced via pBAD-gatR (pBAD-Myc/His) was tested by EMSAs. Specific binding of GatR-His6 to PgatR was obtained regardless of the medium (LB medium or MM with galactitol) used for ST4/74 ΔaraA strain cultivation prior to protein isolation (Fig. S2A), thus not supporting the hypothesis that there is an inducer, possibly formed during galactitol utilization, that lowers the binding affinity of GatR. For quantitative binding of the PgatR fragment, a molar excess of at least 60 was required. We then investigated the binding of GatR-His6 isolated from bacteria grown in MM/galactitol to PgatY and PgatZ. While the binding affinity of GatR-His6 to PgatZ was similar to that of GatR to its own promoter, a much higher molar excess of approximately 400 was required for quantitative binding of PgatY (Fig. S2B). Again, GatR-His6 isolated from the strain grown in LB medium showed a similar binding affinity (data not shown). Fragments upstream of the remaining genes responsible for galactitol uptake and metabolization were also tested but were not bound by GatR (data not shown).
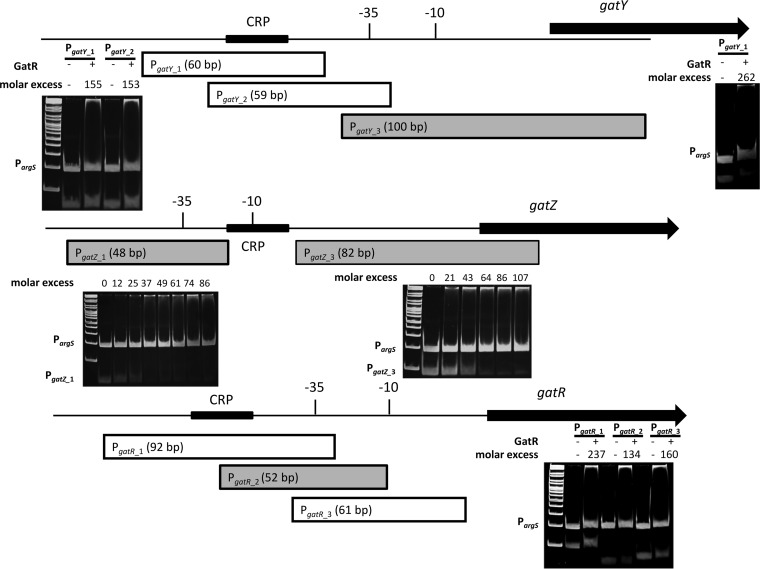
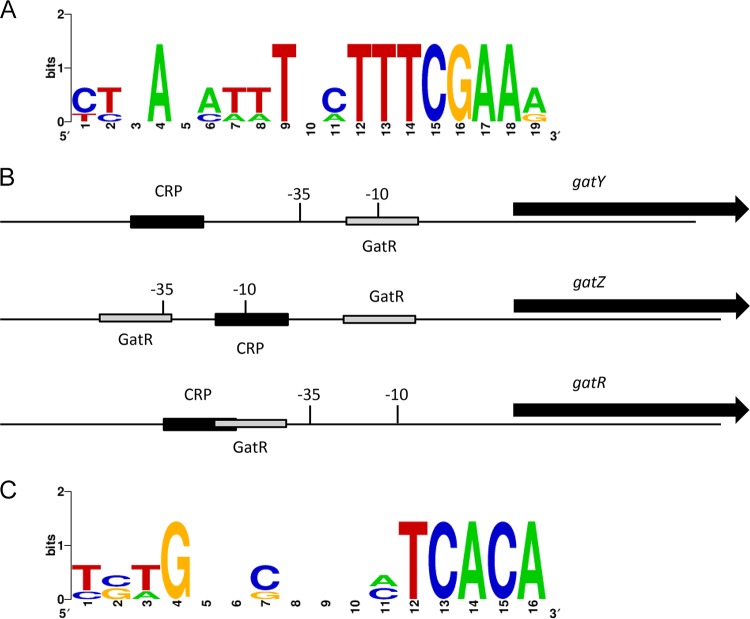
To narrow down the binding sites of GatR, the three promoter fragments were split into smaller fragments that were subjected to binding experiments. EMSAs demonstrated that GatR binds two distinct fragments amplified from the gatZ promoter, suggesting the presence of at least two GatR binding sites. In contrast, GatR bound only to one 100-bp and one 52-bp fragment of the promoters PgatY and PgatR, respectively (Fig. 6). Multiple-sequence alignment of these fragments enabled the identification of a putative consensus sequence of GatR binding within the gat gene cluster (Fig. 7A).
FIG 6.
Localization of GatR target sequences. (A) Overproduced GatR-His6 was purified from the ST4/74 ΔaraA strain cultivated in LB medium. The protein was incubated with the promoter fragment PgatX_X. EMSAs were then performed by separation of the DNA–GatR-His6 mixtures on 12% polyacrylamide gels. The putative −35 and −10 sequences are indicated. cAMP-CRP binding sites are depicted by black boxes. Gray promoter fragments were bound by GatR, and white ones were not. The molar excess of protein over DNA is given above the lanes. The promoter fragment of argS (50 ng) served as a negative control and as competitor DNA. The GeneRuler DNA ladder mix was used as a marker.
FIG 7.
Binding sites of cAMP-CRP and GatR. (A) Consensus binding sequence of GatR. Computational analysis of the fragments bound by the repressor identified a 19-bp region conserved in all promoters. (B) The promoter and coding regions of genes gatY, gatZ, and gatR are shown (not to scale). The putative −35 and −10 sequences are indicated. Black boxes represent cAMP-CRP binding sites, and gray boxes represent GatR binding sites as identified by prediction programs and EMSAs. (C) Sequence motif of proposed cAMP-CRP binding sites within the gat gene cluster.
CRP is required for activation of the galactitol-specific PTS.
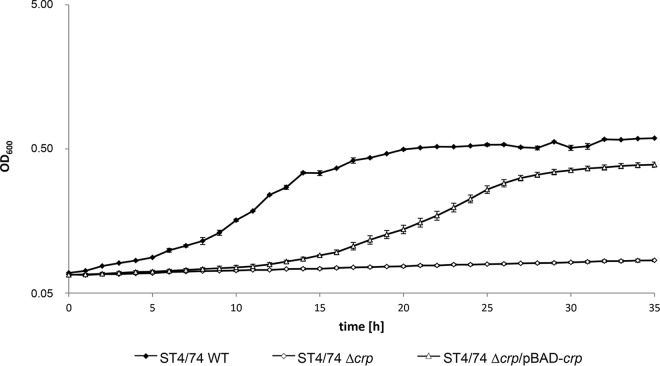
Bioinformatic analysis via virtual footprinting revealed the presence of putative binding sites for CRP within PgatY, PgatZ, and PgatR (Fig. 7B) due to their sequence similarity with the cyclic AMP (cAMP)-CRP consensus sequence 5′-TGTGA-N6-TCACA-3′, identified previously (25) (Fig. 7C). Deletion of crp resulted in zero growth of strain ST4/74 in MM containing galactitol as the sole carbon source (Fig. 8) but not in LB medium (Fig. S3), indicating that cAMP-CRP acts as an activator for this galactitol-specific PTS. When the deletion mutant was transformed with plasmid pBAD-crp, the growth phenotype of the parental strain ST4/74 was partially restored.
FIG 8.
Involvement of CRP in the growth of ST4/74 with galactitol. Growth curves of ST4/74, ST4/74 Δcrp, and ST4/74 Δcrp/pBAD-crp strains in MM with galactitol.
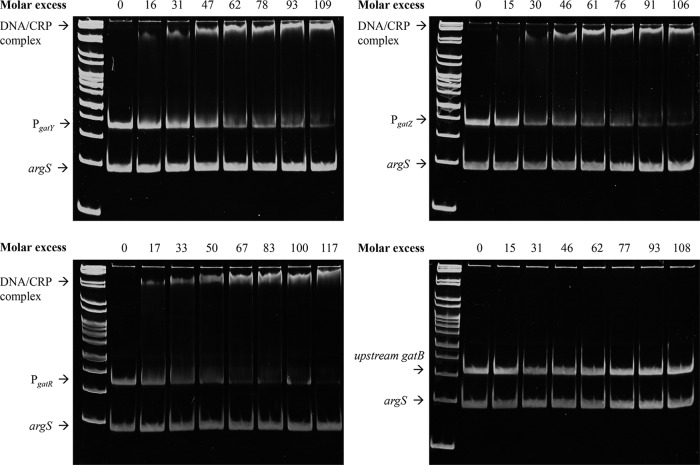
To demonstrate the interaction of CRP with gat promoters by EMSA, CRP-His6 was purified, mixed with 25 mM cAMP, and added in increasing concentrations to the 300-bp fragments located upstream of gatY, gatZ, gatR, and gatB. Fragments and DNA-protein complexes were then separated by gels at 8°C. Motility retardation of all fragments except gatB, which served as a negative control, revealed specific binding of cAMP-CRP-His6 to PgatY, PgatZ, and PgatR (Fig. 9). A molar excess of approximately 100 was sufficient for nearly quantitative cAMP-CRP-His6 binding to these three promoter fragments. Compared to GatR, cAMP-CRP-His6 bound most strongly to PgatY, with lower affinities to PgatR and PgatZ. These data showed that cAMP-CRP binds to the promoters of gatY, gatZ, and gatR, confirming that the expression of galactitol degradation is subject to catabolite repression.
FIG 9.
CRP binding activities toward promoter fragments of gatY, gatZ, gatR, and a fragment upstream of gatB that served as a negative control. For details of EMSAs, see the legend to Fig. 6.
Quantification of GatR-DNA and CRP-DNA binding.
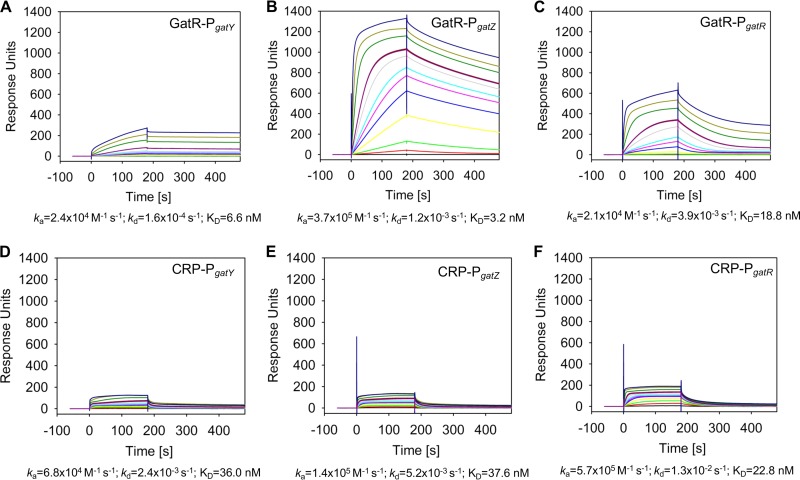
The interactions of GatR and cAMP-CRP with the promoters of gatY (PgatY), gatZ (PgatZ), and gatR (PgatR) were then quantified by SPR analysis. The DNA fragments were captured onto an SPR sensor chip, and different concentrations of GatR and CRP (with 20 μM cAMP) were injected over the surface. All sensorgrams revealed high-affinity binding of GatR to the three promoters (Fig. 10A to C). As a nonspecific control, GatR was also tested against the unrelated pcf promoter region of Photorhabdus luminescens. Lack of interaction (data not shown) demonstrated the specificity of GatR-DNA binding. GatR showed not only the highest affinity for PgatZ (PgatZ, 3.2 nM; PgatY, 6.6 nM; PgatR, 18.8 nM) but also the highest maximal response (Rmax) to this promoter (approximately 1,300 response units [RU] versus 300 to PgatY and 700 to PgatR). Since the Rmax for a 1:1 interaction (e.g., one molecule of GatR binds one DNA fragment) would correspond to ∼150 RU, we conclude that GatR binds as a higher oligomer to PgatZ but not to PgatY and PgatR and/or that there are multiple binding sites for GatR within the gatZ promoter region but only one each within the other two promoter regions. Binding of GatR to PgatY showed slow on/slow off kinetics (absorption rate constant [ka], 2.4 × 10⁴ M−1 s−1; dissociation rate constant [Kd], 1.6 × 10⁻⁴ s−1), whereas the dissociation rates of the other two interactions were approximately 10-fold higher (PgatZ ka, 3.7 × 10⁵ M−1 s−1; PgatZ Kd, 1.2 × 10⁻³ s−1; PgatR ka, 2.1 × 10⁴ M−1 s−1; PgatR Kd, 3.9 × 10⁻³ s−1).
FIG 10.
Quantification of GatR and CRP DNA binding using SPR spectroscopy. The biotin-labeled DNA fragments PgatY (A and D), PgatZ (B and E), and PgatR (C and F) were captured onto a streptavidin-coated sensor chip, and purified GatR (A, B, and C) or cAMP-CRP (D, E, and F) was passed over the chip at a flow rate of 30 μl/min at 25°C (in concentrations of 0, 0.5, 2.5, 5, 10, 15, 20, 25, 50 [two times], 125, 250, and 500 nM for GatR and 0, 1, 5, 10, 20, 30, 50, 100 [two times], 250, 500, and 1,000 nM for CRP) using a contact (association) time of 180 s, followed by a 300-s dissociation phase. The increase of the RU correlates with the rising GatR or CRP concentration. Below the sensorgrams, quantification of the binding kinetics assuming 1:1 binding are indicated as association (ka) and dissociation (Kd) rates, as are overall affinities (KD).
cAMP-CRP also bound all three promoter regions with high affinity, namely, PgatY (36.0 nM), PgatZ (37.6 nM), and PgatR (22.8 nM) (Fig. 10D to F). Although it is known that cAMP-CRP does not follow a simple 1:1 binding mechanism (26) as presumed here, we conclude that the molecular binding mechanism of cAMP-CRP is the same at all three promoters, as evidenced by the similar Rmax values, association rates, and dissociation rates.
DISCUSSION
The full spectrum of metabolic capacities used by pathogens during proliferation under changing environments in vitro and in vivo is still unknown. Moreover, many of these pathways still lack genetic characterization, as exemplified by the gene cluster responsible for galactitol dissimilation. The capability to utilize the four related carbohydrates galactitol, d-tagatose, d-galactosamine, and N-acetyl-galactosamine has been identified in many pathogenic and nonpathogenic strains of enteric bacteria. N-acetylgalactosamine is a main component of mucin (27), and d-tagatose is a degradation product of galactosamine and N-acetylgalactosamine. These four carbohydrates are transported into the cell by PTSs and are degraded by homologous or identical enzymes by metabolic pathways sharing the intermediate tagatose-1,6-bisphosphate and its conversion to DHAP and GAP by a common aldolase (28, 29).
To examine whether the gat gene cluster is relevant for the colonization of food-producing animals, we analyzed the TraDIS data from Chaudhuri and coworkers (22). Colonization by the STM3254, STM3255, and gatR transposon mutants was markedly attenuated in all three food-producing animals. A knockout of gene gatY resulted in attenuation of growth during colonization of chickens and pigs (see Table S2 in the supplemental material). Thus, the capability to degrade galactitol contributes to the proliferation of S. enterica strains during infection of livestock. It remains unclear, however, why a knockout of gatR resulted in a growth-attenuated phenotype. Possible reasons are yet-unknown regulatory functions of this repressor or an untimely and inappropriate expression of gat genes that results in a growth disadvantage.
Galactitol utilization genes have not been identified in Bacillus subtilis or Listeria spp. but have been identified in Citrobacter rodentium; however, C. rodentium does not grow in galactitol, probably due to a phage insertion into gatD (30). The Salmonella gat gene cluster investigated here carries genes involved in both galactitol and tagatose utilization. The genes STM3254-STM3256 are missing from S. Agona as well as E. coli (Fig. 3B). As STM3254 is annotated as tagatose-1-phosphokinase, its deletion mutant in ST4/74 was tested here for growth in MM with 1% tagatose, and zero growth was observed, in contrast to the case for the LB control (data not shown). Therefore, this putative tagatose-1-phosphokinase indeed plays a role in both pathways and links tagatose with galactitol degradation in S. Typhimurium, as suggested previously (29). S. bongori and S. Enteritidis, which do not carry the genes STM3254-STM3257, also do not grow in MM with tagatose but grow faster in MM with galactitol than does strain ST4/74. Therefore, it can be concluded that the genes STM3254-STM3257 are required to utilize tagatose as a carbon source but also decelerate bacterial growth during degradation of galactitol.
In the presence of cAMP, the activator CRP recognizes the three promoters PgatY, PgatZ, and PgatR (Fig. 9). The number of CRP molecules required for DNA binding and the binding kinetics of CRP were similar for the three promoters. As EMSAs performed with GatR isolated from medium with and without galactitol revealed similar binding patterns, we exclude the presence of possible inducers of GatR, such as galactitol-phosphate, that might relax the repressor binding. Therefore, the expression patterns of gatY, gatZ, and gatR (Fig. 4) are mediated by the distinct binding properties of GatR rather than of CRP, and our experiments demonstrated that the differential regulation of genes involved in galactitol utilization is predominantly conferred by GatR. Therefore, this repressor, which belongs to the DeoR family of proteins and contains a helix-turn-helix (HTH) domain and a DeoR C-terminal sensor domain, was investigated here in more detail. Sequence comparison of all fragments that are bound by GatR revealed a 19-bp consensus sequence motif (Fig. 7A). SPR sensorgrams exhibiting individual patterns suggest that GatR interacts differently with its target sequences. This interaction does not follow a simple 1:1 stoichiometry (as presumed for the quantifications) but is more complex and mimics that described recently for the bacterial response regulator YpdB (31). The YpdB binding involves sequential and cooperative promoter interaction and rapid, successive promoter clearance, a pattern that may allow for pulsed target gene expression.
Promoter activity after overexpression of gatR was lowest for PgatZ (1% compared with the control), followed by PgatY (17%) and PgatR (54%) (Table 1). This is in accord with the higher affinity of GatR toward PgatZ than PgatY, as determined by SPR, and also with the higher molar excess required for quantitative binding of PgatY than is required for that of PgatZ (Fig. S2). These findings indicate a correlation between binding affinity and the transcriptional activity observed in the reporter strains and support the hypothesis that the molecular binding mechanisms of GatR differ between the individual gat promoters. This might be due to dissimilar numbers of GatR-binding sites within the three promoters or distinct numbers of GatR molecules required to occupy the DNA. EMSAs shown in Fig. 6 indeed demonstrate that GatR binds at least at two different locations in PgatZ. In line with its putative ability to form oligomers (see the SPR sensograms in Fig. 10), these data provide evidence for a mechanistic model in which GatR creates DNA-protein-DNA bridges within the gatZ promoter, thus stalling the RNA polymerase and inhibiting transcription. Such a regulatory mechanism is also known for the regulator H-NS (32). The strong repression of PgatZ may be a mechanism to prevent untimely expression of the gatZ-gatD operon in the presence of low galactitol concentrations or under conditions of varying substrate availability. With respect to the promoter PgatR, binding of GatR seems to interfere with superior binding of cAMP-CRP due to an overlap between the two binding sites (Fig. 7B), a finding that may explain the weak inhibition of PgatR after GatR overexpression. Such a constellation was also observed for AgaR and the promoter of agaZ in the N-acetylgalactosamine metabolism (33).
Taken together, we provide experimental evidence for a regulatory antagonism between CRP and GatR in which both proteins play a pivotal role in the control of gat gene expression. However, the environmental circumstances under which galactitol utilization provides a selection advantage for S. enterica serovars remain to be elucidated.
MATERIALS AND METHODS
Bacterial strains, plasmids, and growth conditions.
The bacterial strains and plasmids used in this study are listed in Table 2. S. Typhimurium and Escherichia coli cultures were grown in Luria-Bertani (LB) broth (10 g/liter tryptone, 5 g/liter yeast extract, 5 g/liter NaCl) or in minimal medium (MM) consisting of M9 medium supplemented with 2 mM MgSO4, 0.1 mM CaCl2, and 54.9 mM (1%, wt/vol) galactitol or 55.5 mM (1%, wt/vol) glucose. If necessary, the media were supplemented with one of the following antibiotics: ampicillin (150 μg/ml), kanamycin (50 μg/ml), nalidixic acid (20 μg/ml), chloramphenicol (20 μg/ml), tetracycline (12 μg/ml), or streptomycin (50 μg/ml). For solid media, 1.5% (wt/vol) agar was added. For all growth experiments, bacterial strains were first grown in LB medium overnight at 37°C and inoculated 1:100 in the appropriate liquid growth medium for specific experimental applications. Growth curves were obtained from bacterial cultures incubated at 37°C with or without agitation in 250-ml bulb flasks containing 50 ml of medium. The optical density at 600 nm (OD600) was measured at appropriate time intervals as indicated.
TABLE 2.
Strains and plasmids used in this study
| Strain or plasmid | Description and/or relevant feature(s) | Reference and/or source |
|---|---|---|
| E. coli | ||
| DH5α | deoR endA1 gyrA96 hsdR17(rK− mK+) recA1 relA1 supE44 λ thi-1 Δ(lacZYA-argF)U169 | |
| S17.1 λ-pir | λ-pir lysogen of S17.1 [Tpr Smr thi pro hsdR(rK− mK+) recA RP4::2-Tc::Mu-Km::Tn7] | |
| S. Typhimurium | ||
| ST4/74 | Nalr | Mark Stevens |
| ST4/74 ΔSTM3254 | Nonpolar STM3254 deletion mutant | This study |
| ST4/74 ΔgatR-HTH | Nonpolar gatR-HTH deletion mutant (deletion of putative DNA-binding domain) | This study |
| ST4/74 ΔgatR-DeoR | Nonpolar gatR-DeoR deletion mutant (deletion of putative substrate-binding domain) | This study |
| ST4/74 ΔgatC | Nonpolar gatC deletion mutant | This study |
| ST4/74 Δcrp | Nonpolar crp deletion mutant | This study |
| ST4/74 PgatR::lux | Chromosomal fusion of luxCDABE to the promoter of gatR obtained with pUTs-PgatR::lux constructs via homologous recombination | This study |
| ST4/74 PgatY::lux | Like ST4/74 PgatR::lux but with the promoter of gatY | This study |
| ST4/74 PgatZ::lux | Like ST4/74 PgatR::lux but with the promoter of gatZ (STM3257) | This study |
| ST4/74 PgatR::gfp | Chromosomal fusion of gfp to the promoter of gatR obtained with pUTs-PgatR::gfp constructs via homologous recombination | This study |
| ST4/74 PgatY::gfp | Like ST4/74 PgatR::gfp but with the promoter of gatY | This study |
| ST4/74 PgatZ::gfp | Like ST4/74 PgatR::gfp but with the promoter of gatZ | This study |
| Plasmids | ||
| pKD4 | Kanr, pir dependent, FRT sites | CGSC, Yale (34) |
| pKD46 | λ-Red helper plasmid, Ampr | CGSC, Yale (34) |
| pCP20 | FLP recombinase plasmid, Cmr Ampr | CGSC, Yale (34) |
| pBR322 | Ampr Tetr | Fermentas |
| pBR-STM3254 | STM3254 cloned via PstI and PvuI into pBR322 for complementation | This study |
| pBR-gatC | Like pBR-STM3254 but with gatC | This study |
| pBR-gatR | Gene gatR with putative promoter region cloned via ScaI and PstI into pBR322 for complementation | This study |
| pUTs-lux (Cm) | Cmr; transposase-negative derivative of pUT mini-Tn5 luxCDABE Km2; suicide plasmid in pir-negative strains | 35 |
| pUTs-gfp (Cm) | Like pUTs-lux (Cm) but with gfp | Mandy Starke |
| pUTs-Pxx::gfp | pUTs-gfp with ca. 300 bp upstream of gatY, gatR, gatZ, or rpsM cloned via KpnI and NotI | This study |
| pUTs-Pxx::lux | pUTs-lux with ca. 300 bp upstream of gatY, gatR, or gatZ cloned via SacI and XmaI | This study |
| pBAD-Myc/His | Ampr | Invitrogen, Carlsbad, CA |
| pBAD-gatR | Like pBAD-Myc/His but for GatR overproduction, cloned via XhoI and HindIII | This study |
| pBAD-HisA(Tetr) | Derivative of pBAD/HisA, Tetr instead of Ampr | 36 |
| pBAD-crp | Like pBAD-HisA(Tetr) but for CRP-His6 overproduction | This study |
Standard procedures.
DNA manipulations and isolation of chromosomal or plasmid DNA were performed according to standard protocols (37) and by following the manufacturers' instructions. GeneRuler DNA ladder mix (Fermentas, St. Leon-Rot, Germany) was used as a marker for DNA analysis. Plasmid DNA was transformed via electroporation by a Bio-Rad Gene Pulser II as recommended by the manufacturer and as described previously (38). PCRs were carried out with Taq polymerase (Fermentas). Chromosomal DNA, plasmid DNA, or an aliquot of a single colony resuspended in 100 μl H2O was used as the template for PCR. Oligonucleotides used in this study are listed in Table S1 in the supplemental material. S. Typhimurium ST4/74 gene numbers refer to the LT2 annotation (GenBank accession number NC_003197). The NCBI homepage was used to determine the distribution of S. Typhimurium open reading frames in the genomes of Gram-negative species. Promoter sequences located upstream of the identified genes were predicted by BPROM (39), domain functions by NCBI's CDD (40) and SMART (41), and CRP binding sites by Virtual Footprint (42). Multiple-sequence alignments were computed using ClustalΩ (43), and sequence conservation was graphically represented as a sequence logo (44).
Generation of deletion mutants and complementing plasmids.
In-frame deletion mutants of STM3254, gatC (STM3260), gatR-HTH, and gatR-DeoR were constructed by the one-step method based on the phage λ Red recombinase (34). Briefly, PCR products comprising the kanamycin resistance (Kanr) cassette of plasmid pKD4, including the flanking FLP recombination target (FRT) sites, were generated using pairs of 70-nucleotide primers that included 20-nucleotide priming sequences for pKD4 as the template DNA. Homology extensions of 50 bp overlapped 18 nucleotides of the target gene 5′ end and 36 nucleotides of the 3′ end (45). Fragment DNA (500 to 1000 ng) was transferred into S. Typhimurium strain ST4/74 cells harboring plasmid pKD46. Allelic replacement of the target gene by the Kanr cassette was controlled by PCR, and nonpolar deletion mutants were obtained upon transformation of pCP20. Gene deletions were verified by DNA sequencing.
To complement single-gene deletions, the coding sequences of STM3254, gatC, and gatR (STM3262) were amplified from chromosomal DNA of strain ST4/74 using the primers listed in Table S1. PCR products were digested as indicated in Table 2 and ligated with T4 DNA ligase (Gibco, Hudson, NY) into vector pBR322 to generate pBR-STM3254, pBR-gatC, and pBR-gatR. Constructions were verified by restriction analysis and sequencing.
Cloning of putative promoters into pUTs-gfp and pUTs-lux.
Putative promoter regions spanning approximately 300 bp upstream of the start codons of gatY (STM3253), gatZ (STM3257), gatR (STM3262), and argS (STM1909) were amplified from chromosomal DNA of S. Typhimurium 4/74 by PCR using the primers listed in Table S1. The fragments were then cloned via SacI and XmaI (Fermentas) upstream of the promoterless luxCDABE genes into the multiple-cloning site of pUTs-lux(Cmr). For cloning putative promoters into the suicide vector pUTs-gfp(Cmr), NotI and KpnI (Fermentas) were used. After transformation of E. coli S17.1 cells, plasmids containing the correct transcriptional lux-gfp fusions were verified by PCR. Subsequently, the plasmids were transferred into ST4/74 via conjugation. Strains with chromosomal insertions were selected and validated as described above.
Quantification of promoter activity.
Bioluminescence and fluorescence measurements were performed in 96-well plates. Briefly, the cells were grown in MM containing either 27.8 mM glucose or 55.6 mM (1%) galactitol at 37°C for 24 h without agitation. The optical density at 600 nm and the bioluminescence/fluorescence, measured as relative light units (RLU), were recorded in a Wallac Victor3 1420 multilabel counter (PerkinElmer Life Sciences, Turku, Finland).
Overproduction of GatR-His6 and CRP-His6.
Gene gatR without its stop codon was cloned into plasmid pBAD-Myc/His (Ampr) using the restriction sites XhoI and HindIII, thereby introducing a C-terminal 6×His tag for protein purification. pBAD-gatR was transformed into the ST4/74 ΔaraA strain, and the expected clone was verified by sequencing. The same method was used for cloning the gene crp into the vector pBAD/His (Tetr). Overnight cultures of these strains were diluted 1:100 in 100 ml LB or M9-galactitol medium supplemented with 150 μg/ml of ampicillin or 12 μg/ml of tetracycline and incubated for 3 h at 37°C under shaking at 180 rpm. Heterologous expression of gatR and crp was then induced by adding 0.2% arabinose. After incubation for 4 or 12 h at 37°C under 180-rpm shaking, the cells were harvested by centrifugation at 4°C (30 min, 7,500 rpm) and resuspended in 5 to 10 ml of lysis buffer (50 mM NaH2PO4, 300 mM NaCl, 10 mM imidazole, pH 8.0) containing 0.5 mM protease inhibitor (Pefabloc SC; Sigma-Aldrich), 125 to 250 μg lysozyme, and 12.5 to 25 U DNase I. The cells were subsequently lysed by three passages through a French press (SLM Aminco Instruments, Rochester, NY), and residual cell debris was removed by centrifugation at 4°C (2 cycles of 30 min each at 9,000 rpm). The supernatant was sterile filtered, and 24 μl was mixed with 6 μl of 5× Laemmli buffer. The mixture was subjected to SDS-PAGE to verify GatR-His6 and CRP-His6 overproduction. Separated proteins were stained with Coomassie blue (37). GatR and CRP were isolated with a HisTrap HP column using an ÄKTA purifier 10 system (GE Healthcare). The protein concentration was determined using RotiQuant solution (Carl Roth GmbH, Karlsruhe, Germany) based on the method of Bradford (46), and the purity of eluted fractions was analyzed by separation on 12% SDS-polyacrylamide gels.
Electrophoretic mobility shift assays with purified GatR-His6 and CRP-His6.
Fragments representing parts of putative promoter regions of gatY, STM3254, STM3255, STM3256, gatZ, gatA, gatB, gatC, gatD, gatR, and argS were amplified as described above (for oligonucleotides, see Table S1), and 100 ng of DNA was mixed with increasing amounts of purified GatR-His6 in binding buffer (1× Tris-borate-EDTA). As a control, 100 ng of competitor DNA (argS) was added. The total volume was 20 μl. After incubation for 45 min at room temperature, the samples were loaded with 4 μl of 6× loading dye (Fermentas) on 12% polyacrylamide gels and separated at 120 V for 3 h at 4°C in the same buffer precooled to 4°C. DNA was stained in GelRed (Biotium, Hayward, CA) and visualized by UV irradiation. For EMSAs with CRP-His6, the binding buffer, the polyacrylamide gel, and the PAGE running buffer all contained 25 mM cAMP.
Preparation of biotinylated dsDNA fragments.
BIOT-dsDNA fragments were obtained by annealing single-stranded DNA (ssDNA) oligonucleotides or via PCR. BIOT-PgatY, BIOT-PgatZ, and BIOT-PgatR were amplified by PCR using the respective biotinylated DNA oligonucleotides (MWG Biotech, Eurofins Genomics, Ebersberg, Germany) and chromosomal DNA from ST4/74 as the template. To assemble the additional control promoter region PpcfA from Photorhabdus luminescens (47), oligonucleotides P4568-btn_fw and P4568_rev were incubated for 5 min at 100°C, mixed, and cooled for annealing. Biotin-labeled double-stranded DNA (dsDNA) fragments were then immobilized to sensor chips with streptavidin.
SPR spectroscopy and CFCA.
Surface plasmon resonance (SPR) spectroscopy and calibration-free concentration analysis (CFCA) assays were performed in a Biacore T200 (GE Healthcare, Munich, Germany) using Xantec SAD500-L carboxymethyl dextran sensor chips precoated with streptavidin (XanTec Bioanalytics GmbH, Düsseldorf, Germany). All experiments were carried out at 25°C with HBS-EP+ buffer (10 mM HEPES, pH 7.4, 150 mM NaCl, 3 mM EDTA, 0.05% [vol/vol] detergent P20) as described previously (31). Data were analyzed with Biacore T200 evaluation software 2.0 (GE Healthcare) and TraceDrawer software 1.5 (Ridgeview Diagnostics AB, Uppsala, Sweden) using the 1:1 binding algorithm.
CFCA was performed using a 1,000 nM solution of purified GatR (calculated from Lowry-based protein determination), which was diluted stepwise 1:2, 1:5, 1:10, 1:20, and 1:40. Each protein dilution sample was injected twice, once at a flow rate of 5 μl/min and again at 100 μl/min. The initial binding rate (dR/dt) was measured at two different flow rates dependent on the diffusion constant of the protein. The diffusion coefficient of GatR was calculated using the Biacore diffusion constant calculator and converter web tool (https://www.biacore.com), assuming a globular-shaped protein. The diffusion coefficient (D) of GatR was estimated as 1.014 × 10⁻¹⁰ m2/s. The initial rates for those dilutions that differed by a factor of at least 1.5 were considered for calculation of the active GatR concentration that actually interacts with the ligand. This active protein concentration (determined to be 450 nM [or 45% of the total protein concentration]) was then used for calculation of the binding kinetic constants and steady-state affinity. Subjecting CRP and 20 μM cAMP to CFCA analysis resulted in initial rates differing by only <1.5 at all dilutions tested; therefore, 100% active protein was assumed for quantification of SPR sensorgrams.
Supplementary Material
ACKNOWLEDGMENTS
This study was supported by a grant from the ZIEL-Institute for Food and Health within the Ph.D. graduate program in microbe-host interaction.
Josephine Maaz, Lisa Kreutzer, and Katja Fritschle are acknowledged for their technical assistance and Martin Haslbeck is acknowledged for his support in protein purification. SPR analyses were performed in the bioanalytics core facility of the LMU Biocenter, Munich, Germany.
Footnotes
Supplemental material for this article may be found at https://doi.org/10.1128/JB.00595-16.
REFERENCES
- 1.Tsolis RM, Adams LG, Ficht TA, Baumler AJ. 1999. Contribution of Salmonella typhimurium virulence factors to diarrheal disease in calves. Infect Immun 67:4879–4885. [DOI] [PMC free article] [PubMed] [Google Scholar]
- 2.Agbaje M, Begum RH, Oyekunle MA, Ojo OE, Adenubi OT. 2011. Evolution of Salmonella nomenclature: a critical note. Folia Microbiol (Praha) 56:497–503. doi: 10.1007/s12223-011-0075-4. [DOI] [PubMed] [Google Scholar]
- 3.Dougan G, John V, Palmer S, Mastroeni P. 2011. Immunity to salmonellosis. Immunol Rev 240:196–210. doi: 10.1111/j.1600-065X.2010.00999.x. [DOI] [PubMed] [Google Scholar]
- 4.Haraga A, Ohlson MB, Miller SI. 2008. Salmonellae interplay with host cells. Nat Rev Microbiol 6:53–66. doi: 10.1038/nrmicro1788. [DOI] [PubMed] [Google Scholar]
- 5.Waterman SR, Holden DW. 2003. Functions and effectors of the Salmonella pathogenicity island 2 type III secretion system. Cell Microbiol 5:501–511. doi: 10.1046/j.1462-5822.2003.00294.x. [DOI] [PubMed] [Google Scholar]
- 6.Patel JC, Galan JE. 2005. Manipulation of the host actin cytoskeleton by Salmonella–all in the name of entry. Curr Opin Microbiol 8:10–15. doi: 10.1016/j.mib.2004.09.001. [DOI] [PubMed] [Google Scholar]
- 7.Winter SE, Thiennimitr P, Winter MG, Butler BP, Huseby DL, Crawford RW, Russell JM, Bevins CL, Adams LG, Tsolis RM, Roth JR, Bäumler AJ. 2010. Gut inflammation provides a respiratory electron acceptor for Salmonella. Nature 467:426–429. doi: 10.1038/nature09415. [DOI] [PMC free article] [PubMed] [Google Scholar]
- 8.Thiennimitr P, Winter SE, Winter MG, Xavier MN, Tolstikov V, Huseby DL, Sterzenbach T, Tsolis RM, Roth JR, Bäumler AJ. 2011. Intestinal inflammation allows Salmonella to use ethanolamine to compete with the microbiota. Proc Natl Acad Sci U S A 108:17480–17485. doi: 10.1073/pnas.1107857108. [DOI] [PMC free article] [PubMed] [Google Scholar]
- 9.Srikumar S, Fuchs TM. 2011. Ethanolamine utilization contributes to proliferation of Salmonella enterica serovar Typhimurium in food and in nematodes. Appl Environ Microbiol 77:281–290. doi: 10.1128/AEM.01403-10. [DOI] [PMC free article] [PubMed] [Google Scholar]
- 10.Kröger C, Fuchs TM. 2009. Characterization of the myo-inositol utilization island of Salmonella enterica serovar Typhimurium. J Bacteriol 191:545–554. doi: 10.1128/JB.01253-08. [DOI] [PMC free article] [PubMed] [Google Scholar]
- 11.Staib L, Fuchs TM. 2014. From food to cell: nutrient exploitation strategies of enteropathogens. Microbiology 160:1020–1039. doi: 10.1099/mic.0.078105-0. [DOI] [PubMed] [Google Scholar]
- 12.Fuchs TM, Eisenreich W, Heesemann J, Goebel W. 2012. Metabolic adaptation of human pathogenic and related nonpathogenic bacteria to extra- and intracellular habitats. FEMS Microbiol Rev 36:435–462. doi: 10.1111/j.1574-6976.2011.00301.x. [DOI] [PubMed] [Google Scholar]
- 13.Staib L, Fuchs TM. 2015. Regulation of fucose and 1,2-propanediol utilization by Salmonella enterica serovar Typhimurium. Front Microbiol 6:1116. [DOI] [PMC free article] [PubMed] [Google Scholar]
- 14.Gutnick D, Calvo JM, Klopotowski T, Ames BN. 1969. Compounds which serve as the sole source of carbon or nitrogen for Salmonella typhimurium LT-2. J Bacteriol 100:215–219. [DOI] [PMC free article] [PubMed] [Google Scholar]
- 15.Lin ECC. 1996. Dissimilatory pathways for sugars, polyols, and carboxylates, p 391–407. In Neidhardt FC, Curtiss R III, Ingraham JL, Lin ECC, Low KB, Magasanik B, Reznikoff WS, Riley M, Schaechter M, Umbarger HE (ed), Escherichia coli and Salmonella: cellular and molecular biology, 2nd ed, vol 1 ASM Press, Washington, DC. [Google Scholar]
- 16.Delidakis CE, Jones-Mortimer MC, Kornberg HL. 1982. A mutant inducible for galactitol utilization in Escherichia coli K12. J Gen Microbiol 128:601–604. [DOI] [PubMed] [Google Scholar]
- 17.Lengeler J. 1977. Analysis of mutations affecting the dissmilation of galactitol (dulcitol) in Escherichia coli K 12. Mol Gen Genet 152:83–91. doi: 10.1007/BF00264944. [DOI] [PubMed] [Google Scholar]
- 18.Lengeler J, Steinberger H. 1978. Analysis of regulatory mechanisms controlling the activity of the hexitol transport systems in Escherichia coli K12. Mol Gen Genet 167:75–82. [DOI] [PubMed] [Google Scholar]
- 19.Lengeler J, Steinberger H. 1978. Analysis of the regulatory mechanisms controlling the synthesis of the hexitol transport systems in Escherichia coli K12. Mol Gen Genet 164:163–169. doi: 10.1007/BF00267381. [DOI] [PubMed] [Google Scholar]
- 20.Nobelmann B, Lengeler JW. 1996. Molecular analysis of the gat genes from Escherichia coli and of their roles in galactitol transport and metabolism. J Bacteriol 178:6790–6795. doi: 10.1128/jb.178.23.6790-6795.1996. [DOI] [PMC free article] [PubMed] [Google Scholar]
- 21.Wolff JB, Kaplan NO. 1956. Hexitol metabolism in Escherichia coli. J Bacteriol 71:557–564. [DOI] [PMC free article] [PubMed] [Google Scholar]
- 22.Chaudhuri RR, Morgan E, Peters SE, Pleasance SJ, Hudson DL, Davies HM, Wang J, van Diemen PM, Buckley AM, Bowen AJ, Pullinger GD, Turner DJ, Langridge GC, Turner AK, Parkhill J, Charles IG, Maskell DJ, Stevens MP. 2013. Comprehensive assignment of roles for Salmonella typhimurium genes in intestinal colonization of food-producing animals. PLoS Genet 9:e1003456. doi: 10.1371/journal.pgen.1003456. [DOI] [PMC free article] [PubMed] [Google Scholar]
- 23.Soyer Y, Moreno Switt A, Davis MA, Maurer J, McDonough PL, Schoonmaker-Bopp DJ, Dumas NB, Root T, Warnick LD, Grohn YT, Wiedmann M. 2009. Salmonella enterica serotype 4,5,12:i:−, an emerging Salmonella serotype that represents multiple distinct clones. J Clin Microbiol 47:3546–3556. doi: 10.1128/JCM.00546-09. [DOI] [PMC free article] [PubMed] [Google Scholar]
- 24.Rothhardt JE, Kröger C, Broadley SP, Fuchs TM. 2014. The orphan regulator ReiD of Salmonella enterica is essential for myo-inositol utilization. Mol Microbiol 94:700–712. doi: 10.1111/mmi.12788. [DOI] [PubMed] [Google Scholar]
- 25.Shimada T, Fujita N, Yamamoto K, Ishihama A. 2011. Novel roles of cAMP receptor protein (CRP) in regulation of transport and metabolism of carbon sources. PLoS One 6:e20081. doi: 10.1371/journal.pone.0020081. [DOI] [PMC free article] [PubMed] [Google Scholar]
- 26.Lawson CL, Swigon D, Murakami KS, Darst SA, Berman HM, Ebright RH. 2004. Catabolite activator protein: DNA binding and transcription activation. Curr Opin Struct Biol 14:10–20. doi: 10.1016/j.sbi.2004.01.012. [DOI] [PMC free article] [PubMed] [Google Scholar]
- 27.Robbe C, Capon C, Coddeville B, Michalski JC. 2004. Structural diversity and specific distribution of O-glycans in normal human mucins along the intestinal tract. Biochem J 384:307–316. doi: 10.1042/BJ20040605. [DOI] [PMC free article] [PubMed] [Google Scholar]
- 28.Brinkkotter A, Kloss H, Alpert C, Lengeler JW. 2000. Pathways for the utilization of N-acetyl-galactosamine and galactosamine in Escherichia coli. Mol Microbiol 37:125–135. doi: 10.1046/j.1365-2958.2000.01969.x. [DOI] [PubMed] [Google Scholar]
- 29.Shakeri-Garakani A, Brinkkotter A, Schmid K, Turgut S, Lengeler JW. 2004. The genes and enzymes for the catabolism of galactitol, D-tagatose, and related carbohydrates in Klebsiella oxytoca M5a1 and other enteric bacteria display convergent evolution. Mol Genet Genomics 271:717–728. [DOI] [PubMed] [Google Scholar]
- 30.Petty NK, Feltwell T, Pickard D, Clare S, Toribio AL, Fookes M, Roberts K, Monson R, Nair S, Kingsley RA, Bulgin R, Wiles S, Goulding D, Keane T, Corton C, Lennard N, Harris D, Willey D, Rance R, Yu L, Choudhary JS, Churcher C, Quail MA, Parkhill J, Frankel G, Dougan G, Salmond GP, Thomson NR. 2011. Citrobacter rodentium is an unstable pathogen showing evidence of significant genomic flux. PLoS Pathog 7:e1002018. doi: 10.1371/journal.ppat.1002018. [DOI] [PMC free article] [PubMed] [Google Scholar]
- 31.Behr S, Heermann R, Jung K. 2016. Insights into the DNA-binding mechanism of a LytTR-type transcription regulator. Biosci Rep 36:e00326. [DOI] [PMC free article] [PubMed] [Google Scholar]
- 32.Stoebel DM, Free A, Dorman CJ. 2008. Anti-silencing: overcoming H-NS-mediated repression of transcription in Gram-negative enteric bacteria. Microbiology 154:2533–2545. doi: 10.1099/mic.0.2008/020693-0. [DOI] [PubMed] [Google Scholar]
- 33.Ray WK, Larson TJ. 2004. Application of AgaR repressor and dominant repressor variants for verification of a gene cluster involved in N-acetylgalactosamine metabolism in Escherichia coli K-12. Mol Microbiol 51:813–826. [DOI] [PubMed] [Google Scholar]
- 34.Datsenko KA, Wanner BL. 2000. One-step inactivation of chromosomal genes in Escherichia coli K-12 using PCR products. Proc Natl Acad Sci U S A 97:6640–6645. doi: 10.1073/pnas.120163297. [DOI] [PMC free article] [PubMed] [Google Scholar]
- 35.Starke M, Fuchs TM. 2014. YmoA negatively controls the expression of insecticidal genes in Yersinia enterocolitica. Mol Microbiol 92:287–301. doi: 10.1111/mmi.12554. [DOI] [PubMed] [Google Scholar]
- 36.Starke M, Richter M, Fuchs TM. 2013. The insecticidal toxin genes of Yersinia enterocolitica are activated by the thermolabile LTTR-like regulator TcaR2 at low temperatures. Mol Microbiol 89:596–611. [DOI] [PubMed] [Google Scholar]
- 37.Sambrook J, Russell DW. 2001. Molecular cloning: a laboratory manual, 3rd ed. Cold Spring Harbor Laboratory Press, Cold Spring Harbor, NY. [Google Scholar]
- 38.Klumpp J, Fuchs TM. 2007. Identification of novel genes in genomic islands that contribute to Salmonella typhimurium replication in macrophages. Microbiology 153:1207–1220. doi: 10.1099/mic.0.2006/004747-0. [DOI] [PubMed] [Google Scholar]
- 39.Solovyev V, Salamov A. 2011 Automatic annotation of microbial genomes and metagenomic sequences, p 61–78. In Li RW. (ed), Metagenomics and its applications in agriculture, biomedicine and environmental studies. Nova Science Publishers, Hauppauge, NY. [Google Scholar]
- 40.Marchler-Bauer A, Lu S, Anderson JB, Chitsaz F, Derbyshire MK, DeWeese-Scott C, Fong JH, Geer LY, Geer RC, Gonzales NR, Gwadz M, Hurwitz DI, Jackson JD, Ke Z, Lanczycki CJ, Lu F, Marchler GH, Mullokandov M, Omelchenko MV, Robertson CL, Song JS, Thanki N, Yamashita RA, Zhang D, Zhang N, Zheng C, Bryant SH. 2011. CDD: a Conserved Domain Database for the functional annotation of proteins. Nucleic Acids Res 39:D225–D229. doi: 10.1093/nar/gkq1189. [DOI] [PMC free article] [PubMed] [Google Scholar]
- 41.Letunic I, Doerks T, Bork P. 2015. SMART: recent updates, new developments and status in 2015. Nucleic Acids Res 43:D257–D260. doi: 10.1093/nar/gku949. [DOI] [PMC free article] [PubMed] [Google Scholar]
- 42.Münch R, Hiller K, Grote A, Scheer M, Klein J, Schobert M, Jahn D. 2005. Virtual Footprint and PRODORIC: an integrative framework for regulon prediction in prokaryotes. Bioinformatics 21:4187–4189. doi: 10.1093/bioinformatics/bti635. [DOI] [PubMed] [Google Scholar]
- 43.Li W, Cowley A, Uludag M, Gur T, McWilliam H, Squizzato S, Park YM, Buso N, Lopez R. 2015. The EMBL-EBI bioinformatics web and programmatic tools framework. Nucleic Acids Res 43:W580–W584. doi: 10.1093/nar/gkv279. [DOI] [PMC free article] [PubMed] [Google Scholar]
- 44.Crooks GE, Hon G, Chandonia JM, Brenner SE. 2004. WebLogo: a sequence logo generator. Genome Res 14:1188–1190. doi: 10.1101/gr.849004. [DOI] [PMC free article] [PubMed] [Google Scholar]
- 45.Link AJ, Phillips D, Church GM. 1997. Methods for generating precise deletions and insertions in the genome of wild-type Escherichia coli: application to open reading frame characterization. J Bacteriol 179:6228–6237. doi: 10.1128/jb.179.20.6228-6237.1997. [DOI] [PMC free article] [PubMed] [Google Scholar]
- 46.Bradford MM. 1976. A rapid and sensitive method for the quantitation of microgram quantities of protein utilizing the principle of protein-dye binding. Anal Biochem 72:248–254. doi: 10.1016/0003-2697(76)90527-3. [DOI] [PubMed] [Google Scholar]
- 47.Brachmann AO, Brameyer S, Kresovic D, Hitkova I, Kopp Y, Manske C, Schubert K, Bode HB, Heermann R. 2013. Pyrones as bacterial signaling molecules. Nat Chem Biol 9:573–578. doi: 10.1038/nchembio.1295. [DOI] [PubMed] [Google Scholar]
Associated Data
This section collects any data citations, data availability statements, or supplementary materials included in this article.


