

Summary
Pathogenic Vibrio cholerae remains a major human health concern. V. cholerae has a characteristic curved rod morphology, with a longer outer face and a shorter inner face. Previously, the mechanism and function of this curvature were unknown. Here we identify and characterize CrvA, the first curvature determinant in V. cholerae. CrvA self-assembles into filaments at the inner face of cell curvature. Unlike traditional cytoskeletons, CrvA localizes to the periplasm, and thus could be considered a periskeletal element. To quantify how curvature forms, we developed QuASAR (Quantitative Analysis of Sacculus Architecture Remodeling), which measures subcellular peptidoglycan dynamics. QuASAR reveals that CrvA asymmetrically patterns peptidoglycan insertion rather than removal, causing more material insertion into the outer face than the inner face. Furthermore, crvA is quorum regulated and CrvA-dependent curvature increases at high cell density. Finally, we demonstrate that CrvA promotes motility in hydrogels and confers an advantage in host colonization and pathogenesis.
Keywords: cell shape, bacterial cytoskeleton, periskeleton, pathogenesis, peptidoglycan, fluorescent D-amino acids, quantitative cell biology
Etoc blurb
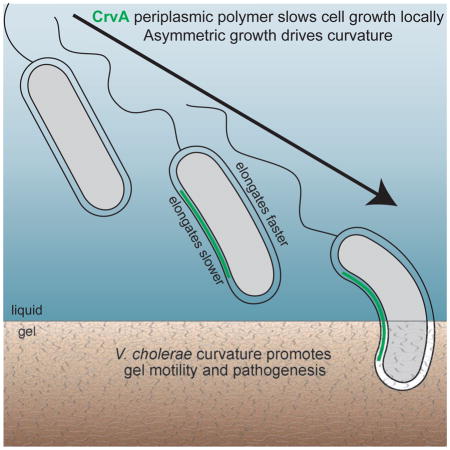
A periplasmic polymer slows cell growth on one side of the pathogenic bacterium Vibrio cholera giving it it a curved shape that promotes host colonization and pathogenesis
Introduction
Vibrio cholerae is the causative agent of the epidemic diarrheal disease cholera. The World Health Organization attributes millions of cases and hundreds of thousands of deaths to cholera annually in the currently ongoing global pandemic (Ali et al., 2012). All known V. cholerae isolates are curved rods (Garrity et al., 1989), suggesting that this morphology confers an important selective advantage (Young, 2006). However, the mechanism underlying V. cholerae’s curvature, and the benefits conferred by this shape, have remained mysterious since its discovery (Koch, 1884; Pacini, 1854).
Little is known about the benefits conferred by vibrioid morphology. Curvature helps C. crescentus adhere to proximal surfaces when dividing under flow (Persat et al., 2014). This benefit requires a polar holdfast that is absent from V. cholerae, suggesting that its curvature serves a different function. The helical morphology of the pathogens Campylobacter jejuni and Helicobacter pylori promotes gel motility and host colonization, although it is unclear if this benefit would apply to vibrioid cells. Regardless, the physiological benefits of curvature in V. cholerae cannot be rigorously tested until its curvature determinants are identified and interrogated.
Bacterial cell shape determinants must ultimately interact with the shape-defining cell wall (Höltje, 1998). The cell wall, or sacculus, lies outside of the cytoplasmic membrane and forms a mesh of glycan strands cross-linked by peptide bonds (Vollmer and Bertsche, 2008). This material, termed peptidoglycan (PG), is assembled and maintained by PG-remodeling enzymes (Scheffers and Pinho, 2005). Sacculi retain their asymmetrical shape in the absence of all other cellular components, demonstrating the key role of the cell wall in shape determination (Weidel et al., 1960). Cells must therefore pattern biosynthesis and degradation of PG in order to achieve a given shape, particularly an asymmetric shape such as vibrioid curvature.
One way that bacteria can modulate the shape of the cell wall is through PG-modifying enzymes. For example, the penicillin-binding proteins (PBPs) generate rod shape through a range of enzymatic activities (Denome et al., 1999). In C. jejuni and H. pylori, peptidases generate helicity by biochemically remodeling the PG (Frirdich et al., 2012; Sycuro et al., 2010). However, none of these proteins localizes asymmetrically, so it is unclear how they break symmetry to promote helical morphology.
To achieve asymmetrical shapes, cell wall changes are often spatially patterned by cytoskeletal elements that bridge the size scale between proteins and bacterial cells (Gitai, 2005). Polymerization enables proteins to break symmetry, establishing the long axis in a rod-shaped cell or the concave face of a curved cell. In many rod-shaped cells, MreB filaments rotate around the long axis of the cell and orchestrate insertion of new PG into the growing cell wall (van Teeffelen et al., 2011). In C. crescentus, a basic rod shape is bent into a vibrioid morphology by the intermediate filament (IF)-like protein crescentin (CreS) (Ausmees et al., 2003). CreS filaments are bound to the membrane along the inner curvature of the cell, but they are found in the cytoplasm, and it is not clear how they pattern the periplasmic cell wall. Furthermore, biochemical analyses indicate that CreS has no effect on cell wall composition (Cabeen et al., 2009). The mechanisms by which cytoskeletal elements establish cell shapes have remained elusive, in large part due to the absence of a quantitative assay to measure local insertion and removal of PG from the cell wall. Consequently, measurement of local PG dynamics is an outstanding goal in the field.
V. cholerae uses both PG-modifying enzymes and cytoskeletal elements to generate its shape (Sengupta et al., 1990; Srivastava et al., 2007), but none of these have a known role in curvature. V. cholerae curvature has not been carefully studied, and its genome lacks homologs of known curvature determinants. Thus, we performed a forward genetic visual screen for straight mutants to discover how curvature is determined in V. cholerae. Here we identify CrvA, the first curvature determinant discovered in V. cholerae. CrvA is conserved in most of the Vibrio genus, and forms periplasmic filaments that localize to the inner cell curvature. To characterize CrvA’s function, we develop the assay QuASAR (Quantitative Analysis of Sacculus Architectural Remodeling), which measures local PG insertion and removal dynamics. We show that CrvA mediates cell curvature by decreasing cell wall insertion at the inner cell face relative to the outer cell face. Finally, we demonstrate that curvature increases at high cell density, promotes motility in dense matrices, and promotes colonization and virulence in mammalian hosts.
Results
CrvA is necessary for vibrioid shape in V. cholerae
To discover the determinants of V. cholerae curvature, we created a Tn5 transposon insertion library of wild-type strain C6706 and visually screened the library for morphological defects. Our screen identified an insertion in VCA1075 that resulted in straight cells. We thus named VCA1075 crvA (curvature regulator in Vibrio A). Orthologs of crvA are present in curved Vibrio species and absent from straight Vibrio species (Figure S1C) (Garrity et al., 1989; Jensen et al., 2009; Sawabe et al., 2013), supporting the key role of crvA in V. cholerae curvature.
We noticed that curvature was most pronounced in overnight cultures and thus measured the extent to which ΔcrvA mutations disrupt V. cholerae curvature in early stationary phase. Targeted in-frame deletion of crvA yielded straight cells (Figure 1A–C), and CrvA complementation restored curvature (Figure S1A–B). To accentuate the effects of cell curvature on the appearance of cells, we induced filamentation of elongating cells with sub-inhibitory concentrations of cefalexin (Cfx), which inhibits the division-specific transpeptidase PBP3 (Möll et al., 2014). Filamented wild-type V. cholerae cells formed long helices (Figure 1A), while elongated ΔcrvA and E. coli cells were straight (Figure 1B–C). Cfx treatment slightly decreased cell radius but did not significantly affect curvature (Figure S2A–B). Since projections of cells in phase-contrast images are two-dimensional (2D), we quantified the 2D curvature of cell centerlines (Figure S3A) (Sliusarenko et al., 2011), confirming that ΔcrvA cells are much straighter than wild-type V. cholerae and similar to E. coli cells (Figure 1D). The increased curvature following overnight growth suggests that curvature is dynamically regulated by cell density. Supporting this hypothesis, wild-type 2D centerline curvature increased monotonically with cell density, while ΔcrvA cells remained straight (Figure 1E–H).
Figure 1. CrvA is necessary for vibrioid shape in V. cholerae.

(A–D) Late exponential phase V. cholerae and E. coli cells (top panels). Long duration Cfx exposure (bottom panels) yields highly filamentous cells, which were used for qualitative shape comparison. See Figure S1 for crvA complementation and Figure S2 for crvA conservation. Scale bar = 4 μm.
(A) Wild type V. cholerae cells are curved.
(B) ΔcrvA cells are straight.
(C) E. coli is a straight rod.
(D) 2D centerline curvature quantified from phase images. Means of five experiments containing 50–200 cells ± standard error of the mean (SEM). Deleting crvA reduces V. cholerae curvature (p<0.001), yielding cells as straight as E. coli (p>0.1). See Figure S4A–C for detailed description of curvature metrics.
(E–H) V. cholerae curvature increases with growth (top panels) and is CrvA-dependent (bottom panels). Scale bar = 2 μm.
(E) Wild-type cells in early-exponential phase have little curvature; ΔcrvA cells are essentially straight.
(F) Wild-type cells in mid-exponential have increased curvature relative to early exponential phase, while ΔcrvA cells remain straight.
(G) Wild-type cells in late-exponential phase are highly curved, while ΔcrvA cells remain straight.
(H) 2D centerline curvature quantified from phase images in a time course of exponential phase cells. Means of five experiments containing 50–200 cells ± SEM.
(I–K) CrvA-GFP forms an apparent filament at the inner curved face in 2D and 3D projections. See Figure S3 for further characterization of CrvA-GFP, Figure S4A–C for an explanation of curvature quantification. And Video S1 for fly-arounds of CrvA-GFP cells.
(I) Late-exponential phase CrvA-GFP cells have elongated fluorescent structures localized to the inner face of cell curvature. Scale bar is 3 μm.
(J) 3D reconstruction of a single cell from a z-stack, with CrvA-GFP signal mapped to the 3D reconstruction of that cell’s surface. The cell was rotated 28.8° per image, for a total of 86.4°.
(K) CrvA-GFP enrichment as a function of Gaussian curvature, from 3D reconstructions of 182 cells, shows CrvA’s preference for low Gaussian curvature. Average enrichments are displayed as splines through the data along with 90% bootstrap confidence intervals.
CrvA localizes to the inner curvature of the cell
We investigated where CrvA localizes by fusing monomeric superfolder green fluorescent protein (msfGFP) (Ursell et al., 2014) to the C-terminus of CrvA (CrvA-GFP). CrvA-GFP functionally restored cell curvature, forming an elongated structure on the inner curvature of untreated cells (Figure 1I) and cells elongated with a short-duration Cfx-treatment (Figure S3B). We confirmed this localization by quantitative 3D analysis (Figure 1J, Figure S2D, Video S1), and found that CrvA-GFP was enriched in regions of the cell with low to negative Gaussian curvature (Figure 1K), which is found on the inner curved face of the cell (Figure S3C).
CrvA forms a periplasmic filament that lacks apparent enzymatic activity
Based on its sequence, we predicted that CrvA is periplasmic (Juncker et al., 2003) with two coiled-coil domains (Lupas et al., 1991) and a PEGA-like C-terminal (CT) domain (Figure 2A, S5). PEGA domains are not well-characterized in bacteria, but are sometimes associated with carboxypeptidase (CPase) domains in eukaryotes (Reverter et al., 2004). Thus, CrvA may have similarities to both the cytoskeletal protein CreS (coiled-coil domains) and CPase enzymes Pgp1 and Csd4/6 (CPase-associated domains). We hypothesized that CrvA could function as a novel periplasmic filament that spatially patterns growth (a “periskeletal” element), a localized PG carboxypeptidase enzyme, or a hybrid protein with both functions.
Figure 2. CrvA forms a periplasmic filament that does not measurably alter sacculus composition.

(A) Diagram of predicted CrvA-GFP domains showing signal sequence (sig seq, residues 2-36), coiled-coil domain 1 (cc1, residues 44-110), coiled-coil domain 2 (cc2, residues 143-182), PEGA-like CT domain (residues 310-386), and monomeric superfolder GFP fusion. See Figure S4 for alignments of CrvA amino acid sequence to proteins with predicted similar features.
(B) Phase images overlaid with GFP fluorescence images; scale bar = 3 μm. The top panel is the parental CrvA-GFP, included for comparison. The second panel is a signal sequence deletion (CrvA-GFPΔ(2-37)), yielding straight cells with diffuse cytoplasmic signal. The third panel is a cc2 domain deletion (CrvA-GFPΔ(143-182)), yielding straight cells with polar foci. Panels four and five are deletions within the CT domain of CrvA-GFP (CrvA-GFPΔ(324-327) and CrvA-GFPΔ(332-336)), yielding cells with drastically reduced curvature and shorter filaments. See Video S3 for time-lapse of CT domain mutants.
(C) TEM reveals that CrvA forms filaments in vitro. The protein was purified and allowed to polymerize at 37°C, and then negatively stained with uranyl acetate and lead citrate. See Method Details for more information, and Figure S5A–D for more on CrvA in vitro purification and characterization. See Video S2 for time-lapse of CrvA-GFP structures during cell lysis. Scale bar = 200 nm.
(D) Fluorescence images of OMVs purified from stationary phase cultures of CrvA-GFP cells. See Figure S5E–F for further characterization of OMVs. Scale bar = 3 μm.
(E–F) UPLC analysis of V. cholerae wild-type and ΔcrvA sacculi. See Table S1 for UPLC data.
(E) UPLC shows no significant difference between PG species of wild-type and ΔcrvA sacculi, at OD600 0.8 and 2.0. Means of three runs ± SEM.
(F) Overlay of representative chromatograms of WT and ΔcrvA at OD 0.8 and OD 2.0 with baselines shifted for ease of visualization.
To determine whether CrvA structures can self-assemble like traditional cytoskeletal elements, we purified recombinant CrvA (Figure S4) and assessed its ability to polymerize in vitro. Purified CrvA protein robustly formed polymers with a uniform width, consistent with cytoskeletal filaments (Figure 2C, S5C). Given that coiled-coil domains can promote self-assembly (Ausmees et al., 2003), we purified a CrvA mutant with a deleted cc2 domain (CrvA Δ(143-182), Figure 2A). This cc2 mutant failed to form polymers in vitro (Figure S5D). We also deleted cc2 from the functional CrvA-GFP fusion and expressed the resulting protein in the ΔcrvA parental strain (CrvA-GFPΔ(143-182)), yielding straight cells with polar foci (Figure 2B), indicating a potential role for cc2 in filament formation and cell curvature. To confirm that CrvA is incorporated into a stable higher-order structure in vivo, we gently lysed cells expressing CrvA-GFP and found that these filaments persist in the absence of intact cells (Video S2). These results indicate that CrvA self-assembles and forms an integral component of a structurally robust filament.
The characterization of CrvA as a potential periskeletal element was surprising, so we deleted the periplasmic signal sequence to directly test its periplasmic localization. The resulting mutant, CrvA-GFPΔ(2-37), was straight with diffuse GFP signal (Figure 2B). While this signal sequence deletion could disrupt CrvA-GFP function and localization for unknown reasons, this result suggests that CrvA can only form filaments and promote cell curvature if it is able to localize to the periplasm. Consistent with this prediction, we found that CrvA-GFP was enriched in Outer Membrane Vesicles (OMVs) (Figure 2D, S5E–F), which routinely contain periplasmic proteins, but not cytoplasmic proteins (Altindis et al., 2014; Schild et al., 2009). This enrichment depended upon CrvA’s periplasmic signal sequence (Figure S5F). Taken together, our data suggest that CrvA forms filaments in the periplasm.
Given that the PEGA-like CT domain of CrvA is associated with eukaryotic CPases, we tested the hypothesis that CrvA is a hybrid filament/CPase by analyzing the muropeptide composition of digested cell wall sacculi using ultra performance liquid chromatography (UPLC). We found no differences in the relative abundance of any PG species between wild-type and ΔcrvA sacculi, even at high cell densities where curvature is most pronounced (Figure 2E–F, Table S1). While CrvA may affect cell-wall composition below UPLC detection limits, CrvA is not a homolog of PG-modifying M14 or M23 peptidases (Dörr et al., 2013; Sycuro et al., 2012), nor to the catalytic sites of PEGA-associated peptidases (Figure S4). In order to directly test the function of the CT domain, we deleted two well-conserved motifs in a CrvA-GFP background (Figure S5), yielding the mutants CrvA-GFPΔ(324-327) and CrvA-GFPΔ(332-336). Both of these mutants had drastically reduced cell curvature and shortened polymers (Figure 2B). Unlike stable CrvA-GFP polymers, these mutant polymers were mobile (Video S3), indicating that the CT domain contributes to filament assembly and anchoring. While it remains possible that CrvA acts as an enzyme of unknown function, our data suggest that CrvA functions as a periskeletal element.
CrvA acts locally to generate cell curvature
Since bacterial cell shape is defined by the expansion of the cell wall due to turgor pressure, we tested the effect of high-osmolality conditions on curvature, and found that growth in high-osmolality medium straightened cells and delocalized CrvA-GFP (Figure 3A–B, S7D). We exploited this growth condition to test whether CrvA filamentation precedes curvature generation by growing cells at high osmolality and then transferring them into LB. We found that elongated CrvA-GFP structures formed in straight cells, which then curved around filaments (Figure 3A–B), indicating that CrvA-GFP filament formation both precedes and actively generates cell curvature.
Figure 3. CrvA filaments drive V. cholerae curvature.

(A–B) Changing medium osmolality demonstrates that CrvA localization precedes curvature formation. See Figure S7D for more on osmolarity quantification.
(A) Cells grown in LB are curved with CrvA-GFP filaments, while cells grown in hyperosmotic media (red) are straight with more diffuse CrvA-GFP signal. Cells transferred from hyperosmotic media into LB (green fade) exhibit CrvA-GFP filament formation within 30 min (black arrow), preceding curvature formation; scale bar = 2 μm.
(B) Quantification of 2D centerline curvature dynamics reveals a delay in curvature recovery following transfer from LB into hyperosmotic media (black arrow). Means of five runs ± SEM.
(C–F) CrvA-GFP filaments correlate with increased 3D centerline curvature. See Figure S3A–C for an explanation of curvature quantification.
(C) A maximum intensity projection from a Z-stack reveals that the CrvA-GFP filament is only present in the curved part of the cell. Scale bar = 1 μm.
(D) 3D reconstructions of the Z-stack (from 3C) show that CrvA is enriched at the surface of the curved part of the cell. The cell was rotated 43.2° per image for a total of 86.4°.
(E) CrvA enrichment as a function of 3D centerline curvature. Plotted from 3D reconstructions of 80 cells. Average enrichments are displayed as splines through the data along with 90% bootstrap confidence intervals.
(F) Probability densities of the 3D centerline curvature of ΔcrvA and wild-type cells. Each distribution was constructed from 150–300 cells.
Does CrvA generate curvature by acting locally or by influencing global cellular properties? We addressed this question by interrogating a subset of Cfx-elongated cells with short CrvA-GFP filaments that did not extend from pole to pole (Figure 3C). In these cells, CrvA-GFP correlates with 3D centerline curvature (Figure 3C–E, S3B). Furthermore, CrvA-GFP was enriched in regions with similar curvature to wild type cells, and depleted from regions with similar curvature to ΔcrvA cells (Figure 3F). Thus, CrvA may have an intrinsic curvature preference. Furthermore, our results suggest that CrvA does not merely localize to curvature but acts locally to actively generate curvature.
QuASAR reveals that CrvA drives V. cholerae curvature by asymmetrically patterning PG insertion
One way that CrvA could locally generate curvature is by asymmetrically patterning growth dynamics to bias either insertion or removal of PG. However, we were hampered by the lack of a method to measure local PG dynamics. Previous studies have examined the incorporation of D-cys amino acids into the cell wall (Cabeen et al., 2009), but single-label experiments cannot quantitatively distinguish between PG insertion and removal. We thus developed an assay we call QuASAR (Quantitative Analysis of Sacculus Architectural Remodeling), which measures local PG modifications by comparing the dynamics of different fluorescent D-amino acids (FDAAs) that are directly incorporated into the cell wall (Kuru et al., 2012). Specifically, we performed a two-color pulse-chase experiment (see Method Details - QuASAR) in which we first grew cells in HCC-amino-D-alanine (HADA; λem ≈ 450 nm) and then transitioned them to NBD-amino-D-alanine (NADA; λem ≈ 550 nm). Quantifying the decay of the old (HADA-labeled) PG provides a direct measurement of PG removal. Meanwhile, the insertion of new PG can be quantified by measuring the dynamics of the ratio of new (NADA-labeled) to old (HADA-labeled) PG, which accounts for both the amount of starting material and the removal of new material (Supporting Materials – QuASAR). Because we can directly measure morphogenesis during labeling (curvature generation was not impeded by FDAA incorporation, Figure 4F), QuASAR allows us to quantitatively relate PG insertion and removal dynamics to cell shape changes.
Figure 4. CrvA generates curvature by patterning cell wall insertion.

(A) QuASAR pulse-chase experiment; red indicates newly inserted PG (labeled by NADA), while green indicates old PG (HADA). See Figure S6 for further characterization of QuASAR-based findings, and Figure S3D–F for a description of the relationship between FDAA measurements and morphological models.
(B) Diagram of cell regions for QuASAR analysis.
(C–D) Integral (sum) of fluorescence intensity of new (red) and old (green) PG, separated into the outer (solid lines) and inner (dashed lines) faces. Data represent median values at each time point and error bars are 90% confidence intervals.
(C) Integral of new PG is greater along the outer face than the inner face of wild-type cells.
(D) Integral of old PG along the inner and outer faces of curved wild-type cells are indistinguishable.
(E) Asymmetry quotient of curved and straight cells. The line represents a ratio of 1, corresponding to static curvature. Data represent the median of the pairwise ratios of proportional growth of the outer face of cells to the proportional growth of the inner face of cells (εouter/εinner).
(F) Dynamic curvature is driven by a differential in exponential insertion rates between the inner and outer faces. Values are median 2D centerline curvatures, with range of predicted curvatures for wild type (blue) and ΔcrvA (yellow) cells (Equation S12). All error estimates are ± 90% bootstrap confidence intervals.
Because V. cholerae PG dynamics had not been previously quantified, it was not obvious how cells would pattern insertion and removal. E. coli rods form by inserting PG in a manner that is distributed across the cylindrical portion of the cell, while C. crescentus curved rods grow from a central zone (Cabeen et al., 2009); both species exhibit little growth at the cell poles. Qualitative inspection of the QuASAR images revealed that despite being a curved rod, V. cholerae inserts PG in a distributed fashion while maintaining relatively inert cell poles, similar to E. coli (Figure 4A). We thus measured the total abundance of new and old PG along each face for each cell, excluding the poles (Figure 4B). As expected, we found that the amount of new PG increased with growth (Figure 4C). Additionally, the amount of old PG decreased as cells grew, demonstrating that V. cholerae elongation involves both insertion and removal of PG (Figure 4D). Furthermore, PG insertion and degradation were exponential (Figure 4C–D), indicating that cells grow in proportion to their length.
Next, we determined whether the asymmetry in V. cholerae shape could be explained by asymmetric PG insertion or removal. The amount of newly-inserted PG was greater along the outer face than the inner face of wild-type cells at all timepoints (Figure 4C), while there was no difference between the amount of old PG on the inner and outer faces at any timepoint (Figure 4D). In ΔcrvA cells insertion and removal of new PG was the same on both cell faces (Figure S6A–B). Thus, insertion alone is asymmetrical, and only in curved cells. Furthermore, 2D centerline curvature correlated with the ratio of new PG along the outer and inner faces of individual cells (Figure S6C), providing a simple metric for the relationship between cell-wall remodeling and cell shape changes. Together, these results suggest that CrvA drives curvature by biasing cell-wall insertion to the outer cell face, and not by preferentially removing PG from the inner face.
Does the increase in new PG insertion along the outer face of wild-type cells reflect the increased starting length of the outer face or result from an increased insertion rate? As mentioned above, both growth and decay of PG were exponential rather than linear. Thus, V. cholerae cells grow by inserting (and removing) PG proportional to the amount of PG present (Figure 4C–D, S3D, Equation S5), and not by adding a fixed amount of PG per unit time. Since we are concerned with the asymmetry between cell faces, we determined the initial lengths and the proportional growth constants for outer faces separately from inner faces. Assuming that PG density remains constant (Desmarais et al., 2015), the amount of old PG along each face serves as a proxy for its length at the time of fluorophore transition. Likewise, the amount of new PG represents the increase in length following this transition. Thus, we define how much a face grows relative to its starting length as its proportional growth (ε), which equals the ratio of new fluorescent PG to old PG (Equation S3). We found that proportional growth follows the equation ε ∝ eαt − 1 (Equation S3), where α is the rate of insertion, and t is time following transition from HADA to NADA. Furthermore, ε is solely dependent upon insertion and is not impacted by decay (Equation S6). While the outer face may be longer than the inner face for many cells measured, ε is independent of starting length (Equation S6). Consistent with our initial model that curvature arises from biased insertion, we find that the outer cell face grows faster (α = 23.3 ± 0.5 min) than the inner face (α = 25.4 ± 0.3 min) (Figure S6D). We measured no significant difference between the insertion rates of the inner and outer faces of ΔcrvA cells (Figure S6E). Thus, regardless of whether the outer face begins longer than the inner face, it also grows faster relative to its length.
As described above (Figure 1E–H), V. cholerae cells increase in curvature as they grow. The asymmetry between the proportional growth of a cell’s inner and outer faces determines whether a cell maintains or changes its curvature as it grows. To maintain a given curvature, a cell must maintain the relative lengths of its inner and outer faces, meaning that the two faces must maintain the same proportional growth (Figure S3D–F). In cells where curvature increases over time, the proportional growth of the outer face (εouter) must be greater than the proportional growth of the inner face (εinner), and thus their ratio must be greater than one. We define this ratio (εouter/εinner) as the asymmetry quotient (Figure S3F). In wild type V. cholerae, where curvature increases over time, the asymmetry quotient ranged from 1.07 to 1.17, and was greater than 1 at every time point (Figure 4E). In ΔcrvA cells, the asymmetry quotient did not statistically differ from 1 at any time point (Figure 4E). To determine if the asymmetry quotient measured in our assay is sufficient to explain the specific curvature changes we observed as the cells grew, we developed a mathematical model that predicts curvature dynamics from initial curvature and asymmetric growth rates (Figure S3F, Equation S12). We found strong agreement between predicted and observed cell shapes (Figure 4F), demonstrating both the power of QuASAR to predict gross quantitative morphological changes from subtle quantitative differences in cell wall dynamics and the sufficiency of CrvA-mediated asymmetric growth to explain V. cholerae shape dynamics.
CrvA-mediated curvature is density dependent
The asymmetrical growth model describes a CrvA-dependent curvature-promoting growth regime, but does not explain how CrvA is regulated to reduce curvature at low cell density. In genome-wide RNA-seq studies of V. cholerae gene expression, crvA transcript levels are reduced five-fold at low cell density (Abeel et al., 2012; Papenfort et al., 2015), suggesting that crvA is quorum regulated. We thus tested the effect of QS on curvature, predicting that ΔluxO mutants (locked in a high cell density state) should have increased curvature, while ΔhapR mutants (locked in a low cell density state) should have decreased curvature (Hammer and Bassler, 2003). Measurements were taken at high cell density to allow wild type cells to develop pronounced curvature. Consistent with our predictions, wild-type cells were highly curved at this cell density, ΔluxO cells had exaggerated curvature, and ΔhapR cells exhibited the least curvature (Figure 5A–D). We also added synthesized autoinducers CAI-1 and AI-2, which additively signal a high density environment (Long et al., 2009), to a ΔcqsA ΔluxS strain incapable of synthesizing these molecules. We found that autoinducers enhanced cell curvature (Figure 5E–G), but that curvature also increased in the ΔcqsA ΔluxS mutant (Figure 5E–G). It may be that the asymmetric growth bias generated by CrvA (Figure 4) generates curvature even in the absence of quorum regulation, or that QS signals other than AI-2 and CAI-1 further modulate CrvA dynamics (Jung et al., 2015). Regardless, cell curvature depended on CrvA in all instances (Figure 5E–G), indicating that cell density regulates cell shape through CrvA.
Figure 5. CrvA-mediated curvature is regulated by quorum sensing.

(A–D) Deleting luxO and hapR mimics the high-density and low-density states (top panels). Long-duration Cfx exposure underlines curvature changes (bottom panels); scale bar = 3 μm.
(A) Late-exponential phase ΔluxO V. cholerae cells are highly curved.
(B) Late-exponential phase parental strain cells have canonical vibrioid shape.
(C) Late-exponential phase ΔhapR V. cholerae cells exhibit little curvature.
(D) 2D centerline curvature was quantified from phase-contrast images of cells in late-exponential phase. Means of multiple experiments containing 50–200 cells ± SEM.
(E–G) Deleting AI synthases cqsA and luxS blocked autoinducer (AI) production (top panels), which was added exogenously to simulate a high-density culture (bottom panels); scale bar is 3 μm.
(E) Late-exponential phase ΔcqsA ΔluxS V. cholerae cells have increased curvature upon exposure to AI.
(F) Late-exponential phase ΔcqsA ΔluxS ΔcrvA V. cholerae cells do not curve in response to AI.
(G) 2D centerline curvature was quantified from phase-contrast images of cells in late exponential phase. Means of multiple experiments containing 50–200 cells ± SEM.
Curvature promotes matrix motility and host pathogenesis
The active regulation of curvature by QS suggests that it provides V. cholerae with a selective advantage, especially at high cell density. However, ΔcrvA mutants did not exhibit a growth rate defect or competitive culture growth disadvantage (Figure S7A–B). Since shape has been linked to motility in some contexts (Young, 2006), we assessed the role of curvature in motility. Straight ΔcrvA mutants were not impacted in their ability to swim in LB (Video S4) or migrate through low-density soft agar gels (Figure 6A). However, ΔcrvA mutants had a population motility defect in higher density agar (Figure 6B–C). A control strain unable to produce flagellin (ΔflaA) was unable to migrate through soft agar at any concentration tested. Thus, ΔcrvA mutants exhibit a flagellar-dependent motility disadvantage in dense soft agar matrices.
Figure 6. CrvA promotes gel matrix motility and pathogenesis.

(A–C) Soft agar motility assay. Means of five experiments containing 8–9 biological replicates per strain ± SEM. See Video S4 for comparison of free-swimming in liquid media. Scale bar = 1 cm. *: p<0.05; **: p<0.01; ns: not significant.
(A) In 0.3% agar (the canonical soft motility assay), no significant difference was observed between cells of different shapes (p>0.1).
(B) In 0.4% agar, ΔcrvA cells were slower than wild type (p<0.05).
(C) In 0.5% agar, the motility defect of straight ΔcrvA cells was exacerbated (p<0.01).
(D–E) Competitive in vivo pathogenesis experiments reveal that ΔcrvA cells have a colonization and pathogenesis defect in animal host models of cholera infection. See Figure S7A–C for growth rates, competitive growth assays, and TcpA production. *: p<0.05; **: p<0.01; ns: not significant.
(D) Infant mouse colonization. At 8- and 20-h post-inoculation, the small intestines were divided into three approximately equal lengths to quantify numbers of attached and unattached V. cholerae cells colonized in each segment. Red bars represent mean values.
(E) Fluid accumulation in the rabbit ligated ileal loop model. 108 wild-type or ΔcrvA cells were injected into each segment (approximately 7-cm length). After 9 and 18 h, the fluid in the loops was extracted and measured. Red bars represent mean values.
Given that CrvA promotes matrix motility, and that penetration of intestinal mucin gel matrices has been linked to V. cholerae pathogenesis (Liu et al., 2008), we were curious whether CrvA also impacts cholera colonization and virulence. We first examined whether deletion of crvA affects levels of the virulence factor TcpA, and found no difference between ΔcrvA and wild type (Figure S7C). Next, we performed competitive colonization experiments of the infant mouse small intestine, comparing the distribution of wild-type and ΔcrvA cells. At the earliest time point, ΔcrvA mutants colonized as well as wild type along the intestine (Figure 6D). However, after 20 hours of infection, fewer ΔcrvA cells than wild type had colonized the distal intestines, suggesting that CrvA promotes colonization in vivo (Figure 6D). We also tested the virulence of ΔcrvA mutants in rabbit ilea, where mucus penetration promotes pathogenesis (Richardson, 1991). Consistent with the mouse colonization assay, there was no difference in fluid accumulation at early timepoints (Figure 6E). However, ΔcrvA caused significantly less fluid accumulation than wild-type V. cholerae at later timepoints (Figure 6E). Thus, our results demonstrate that CrvA promotes pathogenesis, which could be explained by a curvature-associated motility advantage in the dense matrices encountered in the host.
Discussion
CrvA is a periskeletal element that generates vibrioid curvature in V. cholerae
The mechanism of V. cholerae curvature determination contains both familiar and surprising elements. The CT domain of CrvA suggests a link to the CPase cell-shape determinants in H. pylori (Sycuro et al., 2012) and C. jejuni (Frirdich et al., 2012). However, CrvA lacks homology to the catalytic domains of candidate peptidases (Figure S4) and does not measurably alter V. cholerae PG biochemistry (Figure 2E–F). In CrvA, the CT domain facilitates polymerization and filament anchoring, suggesting that CrvA functions through a CPase-independent mechanism. CrvA also shares some similarity to CreS; both use coiled-coil domains to form filaments at the inner face of cell curvature and pattern cell shape without affecting cell-wall composition. In contrast, CreS and CrvA share poor sequence-level homology (Figure S4A) and CreS is cytoplasmic while CrvA is periplasmic. CrvA also self-assembles into elongated structures, confirming the existence of a periskeleton. We therefore suggest that the current view of bacterial shape-determining polymers should be expanded beyond the cytoplasm to include other periplasmic filaments like the helical periplasmic flagella of Spirochetes (Ruby et al., 1997).
The molecular mechanisms by which apparently non-enzymatic filaments like CrvA and CreS alter PG patterning remains unclear. These polymers could interact with either the cell wall or PG-modifying enzymes to decrease the relative insertion rate at the inner face of cell curvature, creating asymmetrical growth. Although they share some similarities, the differences between C. crescentus and V. cholerae – including localized vs. distributed insertion and cytoplasmic vs. periplasmic curvature determinants – suggest that these curvature mechanisms arose independently and are convergent. Thus, patterning curved growth with a filament at the inner face of cell curvature may be a robust morphogenesis strategy that evolved independently multiple times.
The QuASAR assay reveals dynamics of cell-wall insertion and removal
As CrvA is not an enzyme but a filament that patterns cell growth, we sought a cell-level mechanistic understanding of CrvA function. QuASAR exploits the ease and throughput of fluorescence microscopy to provide quantitative measurements of localized changes in PG insertion and degradation. We showed that unlike zonal elongation in Caulobacter, V. cholerae growth is distributed throughout the cylindrical region of the cell. V. cholerae generates curvature by proportionally inserting more PG along the outer face than the inner face of the cell while decay is symmetrical, indicating that curvature can be described solely in terms of differential insertion (Figure 7A).
Figure 7. Models of vibrioid curvature.

(A) Schematic of differential insertion rate creating centerline curvature. An initially straight cell (Generation 0 – PG labeled green) experienced growth with an asymmetry quotient of 1.1 (new PG labeled red). After a single doubling in length (Generation 1), the cell was divided and doubled again (Generation 2). As in actual cells, centerline curvature is determined by the diameter and the ratio of the outer and inner arc lengths (Figure S3D–F).
(B) In natural environments, V. cholerae must penetrate and escape from hydrogels, where curvature could be advantageous (red arrows). In the host, V. cholerae encounters host-associated mucus gels, and penetration of these gels is an important step in cholera pathogenesis (left). V. cholerae must also disperse (right) from host-associated mucus gels, as well as bacterial-associated biofilm. Either process could be facilitated by curvature.
While we developed QuASAR to understand V. cholerae curvature, it has broad applications in diverse bacteria. For example, E. coli cells constrict during division, filament in response to DNA damage, and become rounded in stationary phase. These dynamics could be driven by either insertion or degradation of PG, processes which previously could not be uncoupled or locally quantified. Careful considerations must be given when adapting QuASAR to new species, conditions, and phenomena. For example, non-canonical D-amino acids like those used by QuASAR can be incorporated by L,D-transpeptidases (Ldts) (Cava et al., 2011; Kuru et al., 2015). While the role of Ldts in nascent PG synthesis is unclear, QuASAR presumably measures FDAAs incorporated by both Ldts and the PBPs. As FDAAs track with areas of active PG insertion in V. cholerae and many other bacteria (Cava et al., 2011; Kuru et al., 2015; Kuru et al., 2012), their intensity reflects abundance of PG regardless of how it was incorporated. Thus, we suggest that the QuASAR assay can and should be applied to a broad range of questions about the fundamental mechanisms underlying bacterial growth and morphogenesis.
V. cholerae curvature may promote matrix motility and host pathogenesis
The discovery of CrvA in V. cholerae allowed us to explore the benefits of this curvature determinant in a clinically-relevant human pathogen. V. cholerae exhibits a complex lifecycle, both inside and outside the host, and it is virtually impossible to consider all of the ways in which CrvA-mediated curvature might confer an advantage. However, our finding that curvature increases at high cell density suggests that curvature preferentially benefits V. cholerae at specific points in its life cycle. We also discovered that straight cells swim poorly in dense soft agar, suggesting that V. cholerae dynamically increases curvature to provide a motility advantage in dense hydrogel matrices. Since V. cholerae encounters matrices in the form of host-derived mucus and bacteria-associated biofilms, this motility defect could be relevant to host invasion, dispersal, and pathogenesis.
Is there a link between matrix motility and pathogenesis? Although the mucin matrix coating the gut is biochemically distinct from agar, both are dense hydrogels with fluid-filled pores. While bacteria can swim through the mucin matrix, its pore size decreases with depth, providing a barrier to bacterial colonization (Donaldson et al., 2016). Penetrating this mucin barrier is integral to cholera pathogenesis, and factors that promote mucin penetration increase virulence in V. cholerae (Almagro-Moreno et al., 2015). Our finding that straight ΔcrvA cells were defective in motility-dependent mouse and rabbit cholera pathogenesis models (Figure 7B) is consistent with these observations, and with findings that some pathogens exploit helical curvature in colonization of mucus-coated surfaces. In addition to mucus penetration, matrix motility could promote V. cholerae dispersal by enhancing its ability to emerge from host mucus or biofilms, another physiologically-relevant matrix (Figure 7B). Establishing the advantage conferred by a cell shape is challenging, and it remains possible that V. cholerae curvature is under unknown selective pressures unrelated to matrix motility or pathogenesis, or that the phenotypes associated with ΔcrvA cells are unrelated to cell shape changes. However, we know of no other defects associated with loss of CrvA, and our results suggest that vibrioid curvature confers an advantage in matrix motility which could in turn help V. cholerae to penetrate gut mucus and cause cholera. Furthermore, the link between V. cholerae cell shape, matrix motility, and pathogenesis bolsters an emerging body of literature indicating that bacterial cell shape is a factor in virulence, highlighting the importance of this field.
STAR METHODS
CONTACT FOR REAGENT AND RESOURCE SHARING
For any reagents generated in this study or any other questions about reagents or methods please contact Zemer Gitai (zgitai@princeton.edu).
EXPERIMENTAL MODEL AND SUBJECT DETAILS
Bacterial Growth Conditions
Bacteria were grown using standard laboratory conditions. Cultures were streaked onto LB plates with appropriate antibiotics, and single colonies were selected and grown overnight in LB medium (10 g/L NaCl, 10 g/L tryptone, 5 g/L yeast extract), subcultured 1:1000, and grown to early exponential phase (OD600 0.1–0.12), mid-exponential phase (OD600 0.5–0.6), late-exponential phase (OD600 1.0–1.2), or approaching stationary phase (OD600 1.8–2.0) at 37 °C with shaking. Plasmids were electroporated into S17 E. coli and then conjugated into the appropriate strain on LB plates. When required, 100 μM IPTG was used to induce gene expression unless noted. Antibiotics were used at the following concentrations: 50 μg/mL polymixin B (Pb), 100 μg/mL polymixin B (Pb 100), 100 μg/mL carbenicillin (Carb), 30 μg/mL chloramphenicol (Cm), 30 μg/mL kanamycin (Kan), 10 μg/mL tetracycline (Tet), 500 μg/mL streptomycin (Sm), 50 μg/mL fosfomycin (Fos). Optical density was measured in cuvettes using a BioMate 3S Spectrophotometer (ThermoFisher Scientific), or in 96-well plates (Costar 3603, Corning) using a SynergyHT plate reader (BioTek).
In vivo Pathogenesis and Competition Assays
All animal experiments were conducted in accordance with the guidelines of the Animal Research Institute Committee of Nanjing Agricultural University, Nanjing, China (Permit Number: SYXK (su) 2011–0036). All animals were naïve and healthy at time of infection, and had not been used in previous studies. For in vivo competition assays using the infant mouse model (Gardel and Mekalanos, 1996), approximately 105 ΔcrvA mutants (lacZ+) were mixed with an equal amount of wild type cells (lacZ−) and the mixtures were inoculated intragastrically into 5-day-old CD-1 infant mice (equal number of male and female and randomly assigned to and experimental groups). The mice were placed in groups in a 30°C incubator. They were fasted for 2 hrs prior to the infection and continued to fast during the experiment. At the time points indicated, animals were anesthetized by using ether and euthanized by cervical dislocation. The small intestines were removed and divided into three parts of equal length (proximal, medial, and distal). These segments were flushed with PBS buffer twice. The intestinal tissues were then homogenized. V. cholerae in luminal flushes (unattached bacterial cells) and homogenates (surface attached cells) were counted on LB plates containing 5-bromo-4-chloro-3-indolyl-β-D-galactopyranoside (X-gal). For rabbit ligated ileal loop experiments, ligated loops were performed as described in (Richardson, 1991) with modifications. 4-month-old New Zealand White female rabbits (approximately weighted 2 kg) were single-housed at room temperature. They were fasted for 24 hrs prior to surgery and remain fasted (with free access to drinking water) during the experiment. Rabbits were anesthetized with ether and the small intestine was tied into consecutive segments. 1 mL of 108 CFU/mL cultures of wild-type or ΔcrvA mutants were inoculated into each segment (segments were approximately 7 cm long). The intestine was returned to the peritoneal cavity, and the incision was closed. At the time points indicated, the rabbits were anesthetized by using ether and euthanized by air embolism. The loops were slit open and fluid accumulated in each loop was separately collected and measured.
METHOD DETAILS
Quantitative Analysis of Sacculus Architectural Remodeling
Cells from overnight cultures were subcultured 1:1000 into fresh LB for FDAA incorporation as previously described (Kuru et al., 2012). In brief, following a 20-min recovery period, cells were exposed to 100 μM HCC-amino-D-alanine (HADA; λem ≈ 450 nm) for 2 hours. Then, cells were washed three times with PBS and transferred into 100 μM conditioned media (recovered from pelleted cells that had to been exposed to HADA) containing 100 μM NBD-amino-D-alanine (NADA; λem ≈ 550 nm). Aliquots of cells were taken periodically, fixed in 70% EtOH for 20–60 min at 4°C, washed three times in 70% EtOH, and imaged on PBS pads containing 1% agarose. See Method Details - Quantitative Analysis of Sacculus Architectural Remodeling (QuASAR). For a full description of analysis and mathematical modeling, see Quantification and Statistical Analysis – QuASAR: Cell Contouring and Image Quantification, QuASAR: Detailed description of growth model, and QuASAR: Predicting morphology from growth asymmetry.
Genetic Analysis and Strain Construction
Overnight cultures of V. cholerae strain C6706 (Thelin and Taylor, 1996) and S17 E. coli were pooled on agar plates, so that the plasmid was introduced into V. cholerae by conjugation. Plasmid constructs were formed by restriction digest, PCR SOEing, and Gibson thermal assembly (Gibson et al., 2009). Chromosomal deletions and gene fusions in V. cholerae were performed using the suicide vector pKAS32 (Skorupski and Taylor, 1996), and integrated pKAS32 was subjected to an antibiotic counter-selection on LB plates with 5000 μg/mL Sm. For complementation assays, mutants were made in pEVS143 (Dunn et al., 2006) and induced with 100 μM IPTG unless otherwise noted. Domains sequences were predicted using BLAST (Boratyn et al., 2013), coiled-coil domains were verified with COILS software (Lupas et al., 1991), and the periplasmic signal sequence was verified with LipoP software (Juncker et al., 2003). Protein domains were aligned and sequence identity was compared using Clustal ω (Goujon et al., 2010; Sievers et al., 2011); see Figure S4 for results and a detailed description of the rationale. For the phylogenetic analysis, curvature was assessed using Bergey’s Manual of Systematic Bacteriology (Garrity et al., 1989), and CrvA homology was assessed using the STRING database (Jensen et al., 2009); both were mapped to a reconstructed phylogeny of representative members selected from published phylogeny of the Vibrio clade (Sawabe et al., 2013). We investigated where CrvA localizes in the cell by replacing the endogenous CrvA at its native locus with a translational fusion of monomeric superfolder green fluorescent protein (GFP) to the C-terminus of CrvA (CrvA-GFP). See Tables S2 for primers and S3 for strains employed in this study.
Mutagenesis and Cell Shape Screen
Tn5 insertion mutagenesis of V. cholerae was performed using the suicide vector pRL27c (Larsen et al., 2002). Wild-type V. cholerae strain C6706 and pRL27c-bearing E. coli strain WN093 were pooled on agar plates, so that pRL27c was introduced into V. cholerae by conjugation. Ex-conjugate colonies were then selected on LB agar plates with Pb and Kan, and transferred into 96-well plates (Costar 3603, Corning) containing selective LB. Plates were agitated at 37 °C overnight, subcultured into fresh LB, filamented with a long duration of Cfx exposure so that morphological defects would be more readily apparent, and imaged in early-exponential phase on an inverted microscope.
Phase and Fluorescence Microscopy
For upright microscopy, live-cell imaging was done on M9 pads with 1% glucose and 1% agarose at room temperature. Fixed cells were imaged on PBS pads with 1% agarose. Images were collected on a Nikon90i epifluorescent microscope equipped with a 100×/1.4 N.A. objective or a 40×/0.45 N.A. objective (Nikon), and either a Rolera XR cooled CCD camera (QImaging) or a Hamamatsu Orca-R2 camera. For inverted microscopy, cells were imaged in LB containing appropriate antibiotics in glass-bottom 96-well plates (P96G-1.5, MatTek Corporation). Fixed cells were imaged in PBS with 0.1 mM NaN3 and 4% paraformaldehyde. Images and were collected on a Nikon Ti-E inverted microscope equipped with a 100×/1.4 N.A. objective or a 40×/0.45 N.A. objective (Nikon), and either an Andor Clara camera or an Andor iXon DU-897 EMCCD. Images were acquired using NIS Elements software (Nikon) on both the upright and inverted microscopes. Images for 3D reconstructions and subcellular localization were taken on an upright monolithic aluminum microscope (custom-made, (Morgenstein et al., 2015)) with a 100×/1.49 N.A. objective (Nikon), iXon DU-897 cooled EMCCD camera (Andor Technology), and a homemade LabView software package (National Instruments). All images sharing the same scale bar were resized identically.
Filamentation with Cefalexin (Cfx)
Bacteria were grown overnight as described and then subcultured into LB. Cells were allowed to recover from stationary phase, and subinhibitory concentrations of Cfx (3–5 μg/mL) were added at early-exponential phase (~1–2 h post-subculture, depending on desired exposure time and dilution factor of subculture). Short exposures of 20 minutes were used to produce slightly elongated cells (short-duration Cfx; see Figure S2A, B, D), and long exposures of 60–90 minutes were used to generate highly elongated cells (long-duration Cfx; see Figure 1A–C bottom, 3C–E, 5A–C bottom, S2C–E). Filamentation caused cells to elongate and narrow slightly, but did not measurably change other aspects of cell geometry (Figure S2).
Induction of Cell Straightening by Hyperosmotic Growth
Cells were grown overnight in LB and then subcultured into M63 (15 mM (NH4)2SO4, 100 mM KH2PO4, 1.7 μm FeSO4 EDTA chelate) with 0.8% glucose, 0.4% casamino acids, 10 mM MgSO4, and 10% sucrose. Cells were grown for two hours and then washed and transferred either into LB for recovery or back into hyperosmotic media. Cells were periodically collected for phase contrast microscopy, and imaged on pads containing the same medium in which they were grown plus 1% agarose. Osmolalities were measured using an Osmomat 300 (Gonotec, Berlin, Germany) and are reported as the mean ± standard deviation.
Gentle Lysis Conditions
CrvA-gfp cells were grown as described. Mid- to late-exponential phase cells were placed on M9 pads containing 50 mM EDTA and Pb 100 (to disrupt outer membranes), along with 10 mM lysozyme and Fos (to degrade existing wall and prevent new production of cell wall). No detergent was used to ensure gentle lysis, and to avoid potential impacts upon CrvA-GFP filaments. Cells were then imaged as described over 1–2 hours.
OMV Purification and Imaging
OMVs were purified as previously described (Schild et al., 2009). In short, cells were grown to late exponential phase, cells were removed by low-speed centrifugation followed by 0.5-μm filtration, and then OMVs were purified by high-speed centrifugation. OMVs were visualized by TEM with UAc negative stain, and then imaged by phase contrast and epifluorescence microscopy, as described.
UPLC Analysis of PG Composition
UPLC samples were prepared as described previously (Desmarais et al., 2015). V. cholerae C6706 wildtype and ΔcrvA mutants were streaked on Sm500 LB plates. Single colonies were picked and grown overnight in LB with Pb. Overnight cultures were diluted 1:200 in 250 mL Miller LB and grown at 37 °C to an OD600 of 0.8 or 2.0. Cultures were centrifuged at 5,000 × g for 10 min at room temperature and the resulting pellet was resuspended in 3 mL LB. Cell suspensions were then lysed by boiling in SDS for 3 h. Lysed cell suspensions were ultracentrifuged at 400,000 × g, washed with water to remove SDS, then digested with Pronase E in 10 mM Tris-HCl (pH 7.2) + 0.06% w/v NaCl for 2 hours. SDS was added and cell suspensions were boiled to stop digestion, ultracentrifuged at 400,000 × g to remove residual SDS, and then finally digested into muropeptides with muramidase (40ug/ml final concentration) in 50mM phosphate buffer overnight. Samples were boiled to stop reaction, reduced with sodium borohydride in a borate buffer pH 9 (100mM final concentration), and then pH-adjusted to pH 3.5 using orthophosphoric acid. Resulting samples were injected onto a Waters H Class UPLC system equipped with a BEH C18 1.7-μm column (Waters, MA, USA) and eluted with two sodium phosphate solvents (50 mM sodium phosphate (pH 4.35) + 0.4% v/v sodium azide for solvent A, and 75 mM sodium phosphate (pH 4.95) + 15% v/v methanol for solvent B). Peaks were quantified and identified as particular muropeptide species from their elution times. Crosslinking density was calculated as the percentage of dimers and trimers, while strand length was calculated as 1/number of anhydrous peaks, as previously described (Glauner, 1988).
Purification of CrvA Protein
The CrvA gene without the signal sequence (encoding CrvAΔ(2-35)) was cloned into the pMALC-2 vector between the BamHI and SalI sites. This vector contains an N-terminal maltose-binding protein (MBP) tag and factor Xa cleavage site. The plasmid was transformed into BL21*(DE3) pLysS cells (Promega) and an overnight culture was diluted and grown to OD600 0.5. IPTG was added to a final concentration of 0.2 mM, at which time cells were grown for 20 hours with the temperature lowered to 18 °C. CrvAΔ(2-35) pellets were resuspended in low ionic strength “buffer A” (50 mM NaCl, 25 mM Tris, pH 7.2, 0.5 mM PMSF) and sonicated. The lysate was then centrifuged at 75,000 × g for 45 minutes at 4 °C in a Beckman Optima XE ultracentrifuge. The supernatant was loaded on pre-calibrated amylose resin high flow columns (NEB). Columns were washed with buffer A and eluted with buffer A with 10 mM maltose. Fractions were analyzed by SDS-PAGE and peak elution fractions were cleaved with 10 μg of Factor Xa (Novagen) overnight at 4 °C. Cleaved protein was assayed again by SDS-PAGE, dialyzed against buffer A overnight, and loaded again on an amylose column to remove the free MBP. The same purification scheme was also used to purify CrvAΔcc2 (CrvAΔ(2-35,143-182)). Purified protein was allowed to polymerize at 37 °C for one hour, and was stored at 20 °C prior to analysis (roughly ten minutes).
Electron Microscopy and Staining
Purified protein was negatively stained with 2% uranyl acetate (UAc), followed by 0.1M lead citrate counterstain, on carbon film copper grids (CF400-Cu, Electron Microscopy Sciences). Samples were then observed and imaged at 100 kV under a Zeiss 912AB transmission electron microscope (TEM) equipped with an Omega energy filter, as published (Feierbach et al., 2007). Digital images (Advanced Microscopy Techniques) display a 12,500-fold magnification.
Quorum-sensing Induction with Exogenous Autoinducer
Cells were cultured in LB overnight as described, and subcultured 1:1000 into fresh LB. For relevant strains and conditions, quorum sensing was activated with 2 μM of both CAI-1 and AI-2 (Perez et al., 2014) added 20 minutes post-subculture. 2D centerline curvature was quantified with MicrobeTracker as described (Sliusarenko et al., 2011).
Competitive Growth in Liquid Media
Five individual colonies of ΔcrvA or wild-type V. cholerae constitutively expressing either mKO (orange) or mTFP (blue) were grown overnight in LB at 37°C. Saturated cultures were diluted 1:100 and sub-cultured in M9 minimal media supplemented with 0.5% glucose (M9G) shaking at 30°C until they reached early exponential phase. All cultures were then normalized to OD600 = 0.1 and strains were mixed 1:1. 1 μL of mixtures were visualized microscopically (as described) and counted manually. These mixed cultures were then re-diluted 1:100 into M9G and grown shaking at 30°C for 8–10 hours, reaching OD600 > 0.1. This process (OD equalization to OD600 = 0.1, redilution 1:100, and regrowth for 8–10 hours) was repeated three times, for a total of 28 hours of growth. 1uL of cultures was visualized and counted from each culture. 200 to 1,000 cells were counted per replicate at the beginning and end of the competition. The competitive index of the orange strain was calculated as the ratio of orange cells to blue cells at 28 hours divided by the initial ratio for that particular culture. Normalizing to appropriate starting culture normalizes for differences in initial ratio, which is 1:1 on average but varies between cultures by about 15%.
Matrix Motility Assay
V. cholerae strains were grown overnight in LB and inoculated into freshly poured agar plates containing from 0.3%–0.5% agar using a fine tip as previously described (Croze et al., 2011), and grown for 9–48 hours at 37 °C. Agar plates were imaged periodically, with frequency depending upon agar concentration (every 3 hours for 0.3% agar, every 6 hours for 0.4% agar, and every 12 hours for 0.5% agar), using a Syngene gel doc system (Syngene, Frederick, MD). Circles were fit to each colony with radius equal to full width at half maximum intensity, subtracting the background area (regions without visible cells). Results are means of five experiments with nine replicates, ± SEM.
Virulence Factor Assessment
Overnight cultures of wild-type and ΔcrvA mutants were inoculated 1:1000 into AKI medium (Iwanaga et al., 1986). The cultures were grown statically for 4 hours and then with shaking for additional 4 hours at 37 °C. The cells were lysed and samples were normalized by protein concentration. Equal amounts of proteins were loaded and separated by SDS-PAGE. Immunoblot using anti-TcpA antiserum and HRP-labeled Goat Anti-Rabbit IgG antibody was then performed.
QUANTIFICATION AND STATISTICAL ANALYSIS
Quantitative Cell-Shape Analysis and Subcellular Protein Localization
For 2D analysis, phase images were analyzed using the MATLAB scripts of MicrobeTracker (Sliusarenko et al., 2011) or Morphometrics (Morgenstein et al., 2015; Ursell et al., 2014) to obtain cell contours. Centerline curvatures from 2D images were determined by fitting a single circle to each cell that was segmented by either Morphometrics or MicrobeTracker, see Figure S3A. This simple approach, the default in MicrobeTracker, is a lower bound estimate on the true centerline curvature and is compatible with both software packages. The 3D cell shapes were obtained as described previously (Morgenstein et al., 2015). In short, we minimized the difference between an observed Z stack and the forward convolution of a model with the experimental point spread function. We measured 3D centerline curvature as 1/radius of the “kissing circle” at each point along the curve, see Figure S3B. The 2D projection of the centerline is generally straighter than the full 3D curve, and therefore the 3D centerline curvatures are larger than 2D centerline curvatures but have the same units (μm−1). For a comparison of wild-type cell centerline curvatures in 2D and 3D, see Figures 3B and 3F. 2D centerline curvatures from phase-contrast images are able to be characterized in higher-throughput, but are limited in accuracy for cells that are longer than one helical segment. Because CrvA is periplasmic, we calculated the fluorescence intensity of CrvA-GFP at the cell surface, as described previously (Ursell et al., 2014). The enrichment values displayed are the 90% bootstrapped confidence intervals of the average fluorescence intensity at a particular Gaussian curvature, weighted by surface area. The Gaussian curvature is the product of the two principle curvatures and represents one way description of the geometry of a surface; see Figure S3C.
QuASAR: Cell Contouring and Image Quantification
Cell contours and centerlines were fitted in Morphometrics, and fluorescence intensity along these contours was extracted and analyzed using Morphometrics (Morgenstein et al., 2015; Ursell et al., 2014). The background camera signals in both the HADA and NADA channels near each cell were subtracted from the contours, leaving the fluorescence intensity of wall material. See Figure S6F for example fluorescence and phase contrast micrographs. The polar regions were defined as the 520-nm long arcs centered at each end of the centerline. The remaining regions were classified as the inner or outer arc through one of the following three methods: (1) the arc with the longer contour length, (2) the arc that is included in the centerline circle, (3) the arc whose curvature at the center is the most positive. For all three definitions of the inner and outer curve, wild-type cells showed similar results. Upon visual inspection, we found that method (2) most closely matched our intuition for ΔcrvA cells. For these straight cells, the notion of an inner side is less clear. On a face-by-face basis, we calculated primary properties such as arc length, HADA intensity, NADA intensity, as well as secondary properties such as the relative fraction of intensity on the inner and outer face, the ratio of new material to old material (ε), etc. For the plots in Figures 4 and S6, we display the median value along with 90% CI intervals from a bootstrap analysis. Bootstrap samples were drawn with replacement from the population of cells and included both faces from that particular cell.
QuASAR: Detailed description of growth model
In order to visualize local cell growth dynamics, we grew cells in the presence of HADA and then NADA to incorporate two different colors into their PG. The brightness of new material (NADA) relative to old material (HADA) was used as a proxy for the relative insertion rate on both faces. In this section, we provide a mathematical reasoning for the use of this proxy. In the presence of PG degradation, the amount of new material observed at any given time is less than the total amount of material inserted up to that point. Below we describe why measuring the time evolution of the ratio of new material to old material describes the insertion of new material, even in the presence of PG degradation. Let us begin with the simplest exponential growth model for a single cell in which no material is degraded. At time t=0, we switch the label of the PG being inserted from old to new. The amount of new material added at time t is proportional to the total amount of material present at time t. The differential equations that govern this process are given by Equation (S1 where α is the growth rate constant of new material:
| (S1) |
The solution to these equations, given the initial conditions that old(0) = old0 and new(0) = 0, is Equation (S2:
| (S2) |
The ratio of new material to old material is then independent of initial length. We call this ratio ε, the proportional growth of a cell relative to its initial length. Because the process of measuring the fluorescence of the wall dye involves fixing the cells and washing away unincorporated dye, we were not able to follow this process in single individual cells over time. But because ε normalizes away the initial length of the cell, the time evolution of ε can be measured from different cells.
| (S3) |
Assuming that new material is inserted throughout the cylindrical (non-polar) region of the cell and therefore that wall material is distributed independently of its age to daughter cells, this normalization also holds if cells divide. If, in addition to new material being inserted, the PG is being degraded over time, Equation (S1 needs to be updated to include a term for degradation with rate constant β (Equation (S4):
| (S4) |
Solving these coupled differential equations leads to Equation (S5:
| (S5) |
Solving again for ε gives the same expression as in Equation (S3:
| (S6) |
Surprisingly, the time evolution of ε is thus not dependent upon degradation and reports only on proportional grow due to the insertion of new material. In our experimental setup, we do not measure the absolute amount of new and old material. Rather, we measure the fluorescence intensity from incorporated NADA (false-colored red) and HADA (false-colored green), respectively. The constant A converts from PG concentration to arbitrary fluorescence units (Equation (S7):
| (S7) |
As seen in Equation (S8, the ratio of red to green (ε′) is then analogous to ε:
| (S8) |
When fitting the data in Figure 4C, D to Equation S5, we globally fit C while allowing a unique value of α, β and old0 for each of the four data sets (inner and outer face of both WT and ΔcrvA). While these curves show the quality of the model, the strong correlations between the parameters in the model make it difficult to estimate errors in the parameter estimates. Because there were no statistical differences in the amount of old material between opposing faces, we globally fit ε′(t) with a single value of C and a unique insertion time constant α for each of the faces. This global value of C (2.47 ± 0.07) is merely the conversion factor from arbitrary intensity units of HADA signal to arbitrary intensity units of NADA signal, which should be independent of the specific bacterial strain used. For wild type, the outer face grows faster (α = 23.3 ± 0.5 min) than the inner face (α = 25.4 ± 0.3 min), while insertion rates on the two faces are indistinguishable in ΔcrvA cells (α = 33.7 ± 0.7 min, 33.5 ± 0.3 min) (Figure S6D–E).
QuASAR: Predicting morphology from growth asymmetry
The utility of our exponential growth model (Equation (S5) is demonstrated by its ability to predict changes in 2D centerline curvature over time. Under the assumption that PG density is constant, amount of material is linearly related to wall length. Modeling the cell as a segment of a torus, the radius of curvature of the centerline R and the radius of the cell r determine Y, the ratio of outer arc length to inner arc length (Equation (S9):
| (S9) |
| (S10) |
Plugging in Equation (S5 gives us the ratio of arc lengths as a function of time:
| (S11) |
When the proportional growth and degradation is symmetric between the two faces, αout = αin and βout = βin, the ratio of lengths between the two faces remains at a constant value, Y0. However, in the presence of asymmetric insertion or degradation, Equation S12 shows how centerline curvature can be predicted as a function of time. It uses as its ingredients the change in arc length (Equation (S11), the relationship between curvature and arc length (Equation (S10), and the initial curvature R0:
| (S12) |
For our data, there is no difference in the degradation rates between the two faces. This, along with the observations of R0, αout−αin, and d (0.590 μm) lead to the predicted centerline curvature shown in Fig. 4D.
Supplementary Material
Figure S1. Related to Figure 1: CrvA determines curvature in Vibrio species including V. cholerae.
(A–B) CrvA was conjugated into ΔcrvA cells in trans on plasmid pTBC06 under a PTAC promoter. Cells with this plasmid exhibited restoration of curvature even without induction (0 μM IPTG), perhaps due to a leaky promoter or inadequate repression. However, induction with 100 mM IPTG caused a pronounced increase in cell curvature relative to wild type or uninduced cells. See Figure 1A–D for characterization of CrvA deletion.
(A) Phase contrast images of early exponential phase cells taken with and without IPTG induction; scale bar is 2 μm.
(B) Quantification of 2D centerline curvature from phase images reveals that induction of CrvA increases curvature. Data represents means ± SEM.
(C) In order to discover whether or not crvA is responsible for the vibrioid shape common in the Vibrio genus, we mapped both curvature and the presence of crvA orthologs onto a phylogenetic tree of the Vibrio genus. We limited our scope to species that were found in Bergey’s Manual of Systematic Bacteriology (Garrity et al., 1989) and for which crvA homology data were present in the STRING database (Jensen et al., 2009). We mapped species meeting these criteria to a single recent phylogenetic assessment of the Vibrio clade (Sawabe et al., 2013). We found that crvA orthologs were only absent in strains documented as straight rods, and present in all other Vibrio species. For example, crvA orthologs are present in relatively closely related species such as V. vulnificus and V. metschnikovii (Park et al., 2011) as well as the more distantly related V. anguillarum (Sawabe et al., 2013), all of which have curved rod morphology (Garrity et al., 1989). Conspicuously, the sister group containing V. parahaemolyticus and V. harveyi lacks crvA orthologs and is comprised entirely of straight rods, indicating that this subclade likely shares an ancestor which has lost crvA and thus vibrioid morphology (Chen et al., 2009; Garrity et al., 1989). This suggests that crvA and its orthologs are responsible for determining vibrioid curvature, the canonical characteristic of the clade, in curved-rod Vibrio species. See Figure 1A–D for characterization of CrvA deletion and Method Details – Genetic Analysis and Strain Construction for details. Curved rod characterization: “+” indicates that the species is documented as a curved rod in some conditions; “−“ indicates that the species is documented as a straight rod; “?” indicates that the shape is not documented.
Figure S2, Related to Figure 1: CrvA-GFP localizes to the inner face of cell curvature and functionally restores curvature with or without Cfx filamentation.
Further characterization of CrvA-GFP localization. See Figure 1A–D for characterization of CrvA deletion, and Figure 1I–K and 2A–B for characterization of CrvA-GFP mutants. Also see Method Details – Phase and Fluorescence Microscopy, Method Details – Filamentation with Cfx, and Quantification and Statistical Analysis – Quantitative Cell-Shape Analysis and Subcellular Protein Localization.
(A–B) Violin plots displaying the probability distributions, means (red), and medians (black) of morphological features for CrvA-GFP, ΔcrvA, and wild type cells. Each distribution constructed from 150–300 cells. All Cfx treatments are of short duration.
(A) Violin plot of cell radius showing that short duration Cfx slightly reduces cell width, an effect that is independent of the genetic background. Furthermore, CrvA-GFP and ΔcrvA mutants have a radius consistent with wild type cells, both in the presence and absence of Cfx.
(B) Violin plot of the mean 3D centerline curvature showing that Cfx does not affect cell curvature. Furthermore, CrvA-GFP has curvature similar to wild type, while ΔcrvA cells are much straighter than wild type cells, with or without Cfx.
(C–E) Characterization of CrvA-GFP in Cfx-filamented cells.
(C) Merged images of phase contrast and GFP fluorescence images of CrvA-GFP cells filamented by a long duration Cfx treatment. Scale bar is 5 μm.
(D) Enrichment of CrvA-GFP as a function of Gaussian curvature at the cell surface. CrvA-GFP localizes to low to negative Gaussian curvature. In Cfx-elongated cells, which have longer stretches of negative Gaussian curvature between the positively-curved poles, the elongated CrvA-GFP structures were enriched at negative Gaussian curvature, consistent with its localization to the inner curved face. Average enrichments are displayed as splines through the data along with 90% bootstrap confidence intervals. The three conditions displayed are no Cfx (182 cells), short duration Cfx (168 cells), and long duration Cfx (80 cells).
(E) CrvA-GFP signal measured in a single cell that underwent long duration Cfx treatment was mapped to the surface of a 3D reconstruction of that cell. The cell was rotated 72 degrees per image (counter-clockwise around red Z-axis), for a total of 144 degrees, or a little less than one half-turn. Axis diagram (bottom right) shows the direction (black curved arrow) and axis of rotation (red arrow) that was applied to the reconstructed cell.
Figure S3, Related to Figure 3: Geometric descriptions of cell morphology
(A–C) Cartoons clarifying the difference between various curvature metrics.
(A) The 2D centerline curvature of a cell is the inverse of the radius of the circle that best fits the centerline. Four different views of the same cell are shown with a rotation of 36° between views. Because the 2D centerline is always a projection of the full 3D centerline, this curvature is a lower bound estimate on the curvature of the cell. See Figures 1D, 1H, 3B, 4F, 5D, 5G, S1B, S6A–C and S3D–F for measurements using this definition of curvature.
(B) The 3D centerline curvature is a measure of the instantaneous curvature at points along the curve. Four different views of the same cell are shown with the centerline colored by its instantaneous curvature. The curvature at each point along the centerline is the inverse of the radius of the “kissing circle” at that point, that is, the circle which most closely approaches the curve at that point. See Figures 3E–F and S2B for measurements using this definition of curvature.
(C) Surfaces can also be described by their curvature, although instead of just a single number, there are two principle directions at each point on a surface. These principle directions are orthogonal and lie in the plane that is tangent to the surface. For each principle curvature, its sign indicates whether it is curving inward or outward with respect to that surface. For a closed surface, we choose the convention that positive principle curvatures bend towards the inside of the surface. The magnitude of the principle curvature is the inverse of the radius of the kissing circle. The Gaussian curvature at a point on the surface is the product of the two principle curvatures at that point. Negative Gaussian curvature describe surface that bend in opposite directions, like saddles or the inner curved face of a vibrioid cell. See Figures 1K and S2D for measurements using this definition of curvature.
(D–F) Cartoons clarifying the relationship between changes in cell geometries. Specifically, asymmetric elongation drives cell curvature. See Figure S3A–C for how curvature is quantified, Figures 4A–D and S6 for more about how cell growth dynamics are measured, and Figure 4E–F for predictions of curvature dynamics based upon observed growth dynamics. See Method Details - Quantitative Analysis of Sacculus Architectural Remodeling (QuASAR). For a full description of analysis and mathematical modeling, see Quantification and Statistical Analysis – QuASAR: Cell Contouring and Image Quantification, QuASAR: Detailed description of growth model, and QuASAR: Predicting morphology from growth asymmetry.
(D) For cells that grow as segments of a torus, there is a simple relationship between the centerline radius of curvature, the diameter of the cell, and the relative lengths of the inner and outer faces. Curvature (κ) is the inverse radius of the centerline circle (1/R).
(E) Proportional growth dictates that for a fixed duration of time, the final length of a segment is proportional to its initial length. Cells with the same proportionality constant (i.e., the same growth rate, ε) on the outer and inner faces will grow in a self-similar growth and maintain the same centerline curvature. This is true independent of the starting length of the cell.
(F) Asymmetric proportional growth, where the inner or the outer faces grow with different proportionality constants, leads to changes in curvature. The resulting curvature is independent of starting length, and depends entirely upon the initial curvature and the asymmetry quotient. Growth with an asymmetry quotient less than 1 leads to a straightening of curved rods (yellow background) whereas an asymmetry quotient greater than 1 leads to increasingly curved rods (blue background).
Figure S4, Related to Figure 2: CrvA alignments to potential bacterial orthologs.
Alignments of CrvA amino acid sequence to potential bacterial orthologs performed with Clustalω. See Figure 2A–D for characterization and experimental interrogation of CrvA domain architecture. Also see Method Details - Genetic Analysis and Strain Construction for more information.
(A) Both CreS and CrvA are coiled-coil rich proteins that act as bacterial shape-determining filaments, generating curvature by forming a filament at the inner curved face of the cell. Alignment of CrvA and IF-like cytoskeletal element CreS reveals some similarities, due to the shared presence of coiled-coil domains. However, sequence homology was low (<20% identity), suggesting that they are not orthologs. Both CreS and CrvA are annotated as Structural Maintenance of Chromosome (SMC)-like proteins, which have two coiled-coil rich regions separated by a spacer. However, CreS and CrvA lack homology to the ATP-binding Walker domains of SMC proteins, consistent with the observation that polymerization of CreS and CrvA is ATP independent, as well as the observation that CrvA localizes to the ATP-free periplasm. Furthermore, it hints at a potential broad role for SMC-like coiled-coil domains in polymerization, rather than merely self-interaction. It is possible that the coiled-coils of adjacent monomers interact with each other (forming intermolecular interactions), rather than interacting with coiled-coils on the same monomer (forming intramolecular interactions), thus forming a filament.
(B) The CT domain of CrvA is predicted by sequence homology to possess a putative PEGA domain, a protein in the CP-C-like superfamily, which is shared with some CPase proteins. These proteins were not characterized by empirical means, so its function was unclear. Alignments of the CT domain of CrvA to PEGA domains from three bacterial genera (VVA0639 from Vibrio vulnificus, Q5QVJ2 from Idiomarina loihiensis, and Q6AK24 from Desulfotea psychrophila) revealed that the CrvA CT domain exhibited sequence homology (>20% identity) with all three domains. It shared the greatest homology (40.5%) with fellow Vibrio protein VVA0639, suggesting that these proteins may be evolutionarily related. Surprisingly, none of the residues of the PEGA motif were conserved in CrvA (CrvA has the sequence QYND instead of PEGA at this site), indicating that these residues are not critical. However, two conserved motifs were identified within the CT domain, residues 324-327 (VTIN) and residues 332-336 (GSTPV). Both of these motifs were deleted to characterize the function of the CT domain of CrvA. Putative PEGA motifs are displayed in bold green, and conserved sequences targeted for deletion are displayed in red.
(C–D) Two classes of peptidases have recently been demonstrated to act upon the cell wall to pattern cell shape. In V. cholerae, the M23 D,D-endopeptidase ShyA contributes to elongation by cleaving cross-links between tetrapeptides (Dörr et al., 2013). In H. pylori, the M14 carboxypeptidase (CPase) Csd4 contributes to helical curvature by cleaving the C-terminal residues from PG peptides. Since the C-terminal (CT) domain of CrvA is associated with some CPases, we tested the homology of the CT domain of CrvA to each of these bacterial cell wall peptidases.
(C) Alignment of the CT domain of CrvA to ShyA. There are no obvious regions of similarity, and sequence homology was low (<20% identity), suggesting that they are not orthologs.
(D) Alignment of the CT domain of CrvA to Csd4. There are no obvious regions of similarity, and sequence homology was low (<20% identity), suggesting that they are not orthologs.
(E) The CT domain of CrvA is predicted to be a PEGA domain. This domain is purported to fall within the CP-C-like protein superfamily, which is shared by the CPN/E family carboxypeptidases (Reverter et al., 2004). To test the homology of these domains, the amino acid sequence of the CT domain of CrvA was aligned to the CP-C-like domains of CPase D, N, and E. Metal-binding residues are displayed in bold and active site residues in bold red. Catalytically inactive C-terminal CP-associated domain (the CP-C domain) are displayed in blue. Catalytic residues were inferred from homology to CPase N, while CT domain is inferred from CPase M. In general, we found that CrvA had poor sequence homology to all of these proteins (<20% identity). However, the CT domain of CrvA aligned best with the CP-C-like domains it was predicted to resemble, which do not include the catalytic residues in all three CPases. The function of the CP-C-like domain remains unclear, but it has been proposed to act as a binding domain (Reverter et al., 2004). Catalytic residues were inferred from homology to CPase N (Keil et al., 2007), while CT domains were inferred from homology to CPase M (Reverter et al., 2004). This analysis is consistent with our data indicating that the CT domain aids polymerization and filament anchoring, and does not suggest an enzymatic role for CrvA.
Figure S5, Related to Figure 2: In vitro and ex vivo characterization of CrvA
(A–B) Signal sequence-deleted MBP-fused CrvA (CrvAΔ(1-35)-MBP) was overexpressed in E. coli overnight at 18°C after induction with 0.2 mM IPTG. See Figure 2C and Figure S8 for EMs of purified protein, and Method Details – Protein Purification for more information.
(A) Coomassie-stained SDS-PAGE showing purification of the fusion protein from amylose columns and elution with 10mM maltose. Since CrvA is an uncharacterized protein, we purified it in three different pH conditions. Ft= column flow-through; In. = supernatant loaded after centrifugation, prior to column purification; Numbers (1–3) indicated elution fractions.
(B) The MBP tag was removed by Factor Xa protease treatment. We tested the best two conditions (pH 6.8 and 7.2) after purification and cleaved the protein at 4°C. Samples were taken at different time points and analyzed on SDS-PAGE. ON=overnight; numbers (0–4) indicated sample time, in hours.
(C–D) TEMs of purified CrvA and CrvAΔcc2 (CrvAΔ(143-182)), prepared as described. Wide fields of view (scale bar = 400 nm) demonstrate robustness of polymerization in mature CrvA, and absence of polymerization in CrvAΔcc2. See Figure 2C for higher-magnification view of CrvA filaments, and Method Details – Electron Microscopy for more information.
(C) TEMs of purified CrvA protein reveal negatively stained filaments.
(D) TEMs of CrvAΔcc2 (CrvA(Δ143-182)) reveal that the cc2 domain is necessary for in vitro polymerization.
(E–F) CrvA-GFP requires signal sequence to enter OMVs.
(E) Negative stain (UAc) of purified OMVs were isolated from V. cholerae by centrifugation and filtration. Scale bar is 50 nm. See Figure 2D for fluorescence images of CrvA-GFP OMVs, and Method Details – OMV Purification and Imaging for more information.
(F) CrvA-GFP phase and fluorescence microscopy. Fluorescence images (top panels) were taken under identical exposure conditions and processed identically after imaging (same minimum and maximum values); scale bar is 5 μm. See Figure 2D for details of fluorescence images CrvA-GFP OMVs, and Method Details – OMV Purification and Imaging for more information. CrvA-GFP OMVs (left panels) fluoresce green, demonstrating that they contain CrvA-GFP. CrvA-GFPΔ(2-37) OMVs (right panels) do not fluoresce green, demonstrating a lack of CrvA-GFP.
Figure S6, Related to Figure 4: Additional QuASAR data
Further characterization of cell shape using the QuASAR assay. See Method Details - Quantitative Analysis of Sacculus Architectural Remodeling (QuASAR). For a full description of analysis and mathematical modeling, see Quantification and Statistical Analysis – QuASAR: Cell Contouring and Image Quantification, QuASAR: Detailed description of growth model, and QuASAR: Predicting morphology from growth asymmetry.
(A–B) The inner and outer faces of straight ΔcrvA cells are indistinguishable at all time points with regards to both old and new material. See Figure 4C–D for comparable experiments performed on asymmetrically-growing wild-type V. cholerae cells. (A) Integral of new material is not significantly different between the inner and outer faces of straight ΔcrvA cells. Data represent median values of the integral (sum) of NADA signal for outer (solid line) and inner (dashed line) faces of ΔcrvA cells at each time point, and error bars are 90% confidence intervals.
(B) Integral of old material is not significantly different between the inner and outer faces of straight ΔcrvA cells. Data represent median values of the integral (sum) of HADA signal for outer (solid line) and inner (dashed line) faces of ΔcrvA cells at each time point, and error bars are 90% confidence intervals.
(C) Plotting curvature as a function of the integral of new material on the outer face over the integral of new material on the inner face reveals that this ratio has a best fit line with positive slope for wild type cells (best slope: 0.064 ± 0.033, 90% C.I.; correlation coefficient 0.21). For ΔcrvA cells, this slope is not significantly different from zero (0.0053 ± .010, 90% C.I.; correlation coefficient 0.058).
(D–E) Exponential growth model of proportional growth (ε′). Even in the presence of degradation, ε reports on the insertion of new material. Fits are to Equation S8 with one global value of C and are displayed with 90% bootstrap CI. See Figure 4E–F for predictions of curvature dynamics based upon observed asymmetries in proportional growth.
(D) For wild type cells, the inner face (purple) grows slightly slower than the outer face (orange).
(E) For ΔcrvA cells, the inner face (purple) is indistinguishable from the outer face (orange).
(F) Example images from QuASAR at 6 minutes and 30 minutes after the transition from HADA to NADA. The intensity scales from cell to cell are the same in each of the phase (top), NADA (middle), and HADA (bottom) channels. Over time, the old material is degraded and new material is inserted, however there is still a significant signal in the old material channel at 30 minutes. See Figures 4B–C and S10A–B for measurements of fluorescence intensity at different timepoints.
Figure S7, Related to Figure 6: Experiments in support of comparisons and competitions of straight and curved cells
(A) The growth curves for both wild type and ΔcrvA on a semi-log graph. Cells were grown with shaking at 37°C in LB. Means and standard error were calculated from four biological replicates measured in quadruplicate. See Figure 6 for competitive assays between wild type and ΔcrvA. See Experimental Model and Subject Details – Bacterial Growth for information regarding bacterial culture and optical density measurements.
(B) Competitive index of mKO-expressing cells to mTFP-expressing cells following 28 hours of competitive exponential phase growth in M9+0.5% glucose shaking at 30°C. None of the competitions, including ΔcrvA relative to wild type, displayed a competitive index different from 1 (p>0.6). Means and standard error represent data from five biological replicates, with 200–1000 cells counted per biological replicate. See Figure 6 for competitive assays between wild type and ΔcrvA. Also see Method Details – Competitive Index for further information.
(C) Immunoblot comparing levels of production of attachment pilus TcpA. Wild-type and ΔcrvA cells were grown under virulence inducing condition. The lysed cells were normalized by protein concentration and subjected to SDS-PAGE and immunoblotting using anti-TcpA antiserum and HRP-labeled goat anti-rabbit IgG antibody. Wild type and ΔcrvA strains exhibit similar levels of TcpA production, which is tightly co-regulated with toxin production. Thus, the competitive differences between WT and ΔcrvA are not likely to be due to different levels of toxin production or differences in attachment due to pilus expression. See Figure 6D–E for competitive colonization and pathogenesis assays between wild type and ΔcrvA. Also see Method Details – Virulence Factor Assessment for further information.
(D) Comparison of experimental osmolality conditions (bars in graph) to environmental osmolality commonly encountered by V. cholerae (horizontal bars/rectangles, in brown). Cells exhibit growth- and cell density-dependent curvature dynamics in LB made with 10 g/L of principle osmolyte NaCl (480 ± 10 mOsm, left bar). Osmolality remains constant regardless of cell growth and metabolism (cell-free spent media had an osmolality of 476 ± 8 mOsm, center bar). Thus, curvature increases at constant osmolality, suggesting that curvature evolution does not require osmotic changes. In contrast, growth in a high-osmolality, sucrose-containing medium (Figure 3A–B) caused cells to straighten and CrvA-GFP to lose its characteristic localization pattern (670 ± 15 mOsm, right bar). In order to understand the significance of these osmolality measurements for V. cholerae, which experiences fluctuating conditions of moderate osmolality throughout its lifecycle, we compared our measurements with some typical environmental conditions. LB is somewhat more brackish than the typical human small intestine (270 – 310 mOsm) (Fordtran and Locklear, 1966) and the osmolality of rabbit ileal lumen is slightly higher following treatment with cholera toxin (325 ± 8 mOsm) (Lima et al., 1988). Environmental isolates of V. cholerae have been found at a variety of brackish conditions from 2 to 14 parts per thousand salinity, very close to our LB with of 10 g/L NaCl (Louis et al., 2003). Thus, our high-osmolality, sucrose containing medium was roughly twice the normal environment of V. cholerae, and was not significantly different from the upper bound for an estuarine environment which V. cholerae is known to inhabit (Louis et al., 2003). While V. cholerae may experience marine conditions which could result in environmentally-driven shape changes, the decreased abundance of V. cholerae at salinities above 14 parts per thousand (Louis et al., 2003) and its increased temperature sensitivity at higher salinities (Blackwell and Oliver, 2008) do not support an adaptive link between high osmolality and morphological changes.
Table S1, Related to Figure 2: UPLC of ΔcrvA and wild-type sacculi. PG composition of both strains is very similar at lower density (where curvature is less pronounced) or at higher density (where curvature is more pronounced). Means and standard errors are from three separate experiments per strain and condition. Columns on right show statistical analysis of the differences between the means and standard errors of UPLC results. Student’s t-test reveals that no statistically significant differences were observed between the two strains in any of the muropeptide species measured. See Method Details - Purification of Sacculi and UPLC Analysis of Peptidoglycan Composition and Figure 2E–F for more information.
Contains useful information regarding primers used in this study. See Method Details - Genetic Analysis and Strain Construction.
Contains useful information regarding strains used in this study. See Method Details - Genetic Analysis and Strain Construction.
Flyaround rotations reveal CrvA prefers negative Gaussian curvature. Top panel shows CrvA-GFP intensity mapped to the surface of five different cells, with intensity scaled from minimum to maximum per cell. Bottom panel shows Gaussian curvature for those same cells. Cells are displayed in the same orientation in both panels. See Figure 1I–K, 2A–B, and S3 for further characterization of CrvA-GFP.
Agarose pads were made with M9 medium supplemented with lysozyme and fosfomycin to degrade cell wall, and EDTA and polymixin B to disrupt the outer membrane. Cells lyse due to their own turgor pressure, leaving behind robust CrvA-GFP filaments. Images were acquired every ten minutes, and if frames went out of focus in the final timepoints, the final frame was duplicated so that all endpoints could be viewed simultaneously. See Figure 1I–K, 2A–B, and S3 for further characterization of CrvA-GFP. Images were resized identically. Playback speed of 4 fps; scale bar is 5 μm.
Timecourses of CrvA-GFP, CrvA-GFPΔ(324-327), and CrvA-GFPΔ(332-336) cells reveal that CrvA-GFP filaments are stable, while CT-domain mutant localization is mobile. Images were acquired every thirty seconds on M9 pads supplemented with glucose. See Figure 1I–K, 2A–B, and S3 for further characterization of CrvA-GFP. Playback speed of 5 fps; scale bar is 5 μm.
Video reconstructed from continuously acquired phase images. See Figure 6 for competitive motility-based assays between wild type and ΔcrvA. Panels have identical size scaling and playback speed (real time playback speed of 5.2 fps).
Highlights.
CrvA polymers self-assemble in the periplasm at the inner curved face of the cell.
CrvA drives asymmetric cell wall insertion and is required for cell curvature.
CrvA-mediated curvature promotes motility in dense matrices and host pathogenesis.
Acknowledgments
We acknowledge the members of the Gitai lab, especially Albert Siryaporn and Randy Morgenstein for helpful discussions, and Nikolay Ouzounov for assistance in strain construction. We also thank rotation students Alex Geller for initial efforts to purify CrvA, and Hendia Edmund for assistance with cell shape screening. Additionally, we acknowledge the Bassler lab, particularly Carey Nadell, Amanda Hurley, and Julie Valastyan, for their assistance with aspects of V. cholerae biology. Thomas Silhavy and Marcin Grabowicz offered helpful insight regarding periplasmic localization studies. Paul Shao assisted with electron microscopy. Autoinducers were provided by the Semmelhack lab. We thank Bonnie Bassler, Rebecca Hasley, and Joshua Crossley for their careful reading of the manuscript.
This work was supported by National Institutes of Health (NIH) Grants 1R01GM107384 and 1DP1OD019133, National Science Foundation (NSF) Grant CBET-1330288, and a Human Frontiers Young Investigator Award (to Z.G.); NIH Director’s New Innovator Award DP2OD006466 and NSF CAREER award MCB-1149328 (to K.C.H.); NIH/NIAID Grant R01AI120489 (to J.Z.); NSF Career Grant PHY-0844466 (to J.W.S.); NIH Grant GM113172 (to M.S.V.); NSF Graduate Research Fellowship (to T.M.B.); NSF Graduate Research Fellowship (to N.R.M.); NSF Graduate Research Fellowship (to A.M.); and NIH P50 GM071508 (funding B.P.B.).
Footnotes
Author Contributions
T.M.B., A.P., and Z.G. conceptualized the project. T.M.B. performed all analysis and investigation except: 3D analysis and mathematical modeling for QuASAR were performed by B.P.B. with J.P.N. and J.W.S.; UPLC was performed by A.M. with S.D. and K.C.H; recombinant CrvA was cloned, expressed, and purified by A.D.; competitive growth assays were performed by N.R.M.; in vivo infections were performed by Y.S. with J.Z. Conceptualization of QuASAR, its methodology, and software development were performed by T.M.B. and B.P.B., with materials and guidance provided by M.S.V. Writing and visualization was performed by T.M.B., B.P.B, and Z.G. Z.G. supervised all aspects of the project.
Publisher's Disclaimer: This is a PDF file of an unedited manuscript that has been accepted for publication. As a service to our customers we are providing this early version of the manuscript. The manuscript will undergo copyediting, typesetting, and review of the resulting proof before it is published in its final citable form. Please note that during the production process errors may be discovered which could affect the content, and all legal disclaimers that apply to the journal pertain.
Bibliography
- Abeel T, Van Parys T, Saeys Y, Galagan J, Van de Peer Y. GenomeView: a next-generation genome browser. Nucleic Acids Research. 2012;40:e12–e12. doi: 10.1093/nar/gkr995. [DOI] [PMC free article] [PubMed] [Google Scholar]
- Ali M, Lopez AL, You YA, Kim YE, Sah B, Maskery B, Clemens J. The global burden of cholera. Bull World Health Organ. 2012;90:209–218A. doi: 10.2471/BLT.11.093427. [DOI] [PMC free article] [PubMed] [Google Scholar]
- Almagro-Moreno S, Pruss K, Taylor RK. Intestinal Colonization Dynamics of Vibrio cholerae. PLoS Pathogens. 2015;11:e1004787. doi: 10.1371/journal.ppat.1004787. [DOI] [PMC free article] [PubMed] [Google Scholar]
- Altindis E, Fu Y, Mekalanos JJ. Proteomic analysis of Vibrio cholerae outer membrane vesicles. Proceedings of the National Academy of Sciences of the United States of America. 2014;111:E1548–E1556. doi: 10.1073/pnas.1403683111. [DOI] [PMC free article] [PubMed] [Google Scholar]
- Ausmees N, Kuhn JR, Jacobs-Wagner C. The Bacterial Cytoskeleton: An Intermediate Filament-Like Function in Cell Shape. Cell. 2003;115:705–713. doi: 10.1016/s0092-8674(03)00935-8. [DOI] [PubMed] [Google Scholar]
- Blackwell KD, Oliver JD. The ecology of Vibrio vulnificus, Vibrio cholerae, and Vibrio parahaemolyticus in North Carolina Estuaries. The Journal of Microbiology. 2008;46:146–153. doi: 10.1007/s12275-007-0216-2. [DOI] [PubMed] [Google Scholar]
- Boratyn GM, Camacho C, Cooper PS, Coulouris G, Fong A, Ma N, Madden TL, Matten WT, McGinnis SD, Merezhuk Y, et al. BLAST: a more efficient report with usability improvements. Nucleic Acids Research. 2013;41:W29–W33. doi: 10.1093/nar/gkt282. [DOI] [PMC free article] [PubMed] [Google Scholar]
- Cabeen MT, Charbon G, Vollmer W, Born P, Ausmees N, Weibel DB, Jacobs-Wagner C. Bacterial cell curvature through mechanical control of cell growth. The EMBO Journal. 2009;28:1208–1219. doi: 10.1038/emboj.2009.61. [DOI] [PMC free article] [PubMed] [Google Scholar]
- Cava F, de Pedro MA, Lam H, Davis BM, Waldor MK. Distinct pathways for modification of the bacterial cell wall by non-canonical D-amino acids. The EMBO Journal. 2011;30:3442–3453. doi: 10.1038/emboj.2011.246. [DOI] [PMC free article] [PubMed] [Google Scholar]
- Chen SY, Jane WN, Chen YS, Wong H-c. Morphological changes of Vibrio parahaemolyticus under cold and starvation stresses. International Journal of Food Microbiology. 2009;129:157–165. doi: 10.1016/j.ijfoodmicro.2008.11.009. [DOI] [PubMed] [Google Scholar]
- Croze Ottavio A, Ferguson Gail P, Cates Michael E, Poon Wilson C. Migration of Chemotactic Bacteria in Soft Agar: Role of Gel Concentration. Biophysical Journal. 2011;101:525–534. doi: 10.1016/j.bpj.2011.06.023. [DOI] [PMC free article] [PubMed] [Google Scholar]
- Denome SA, Elf PK, Henderson TA, Nelson DE, Young KD. Escherichia coli Mutants Lacking All Possible Combinations of Eight Penicillin Binding Proteins: Viability, Characteristics, and Implications for Peptidoglycan Synthesis. Journal of Bacteriology. 1999;181:3981–3993. doi: 10.1128/jb.181.13.3981-3993.1999. [DOI] [PMC free article] [PubMed] [Google Scholar]
- Desmarais SM, Tropini C, Miguel A, Cava F, Monds RD, de Pedro MA, Huang KC. High-throughput, Highly Sensitive Analyses of Bacterial Morphogenesis Using Ultra Performance Liquid Chromatography. Journal of Biological Chemistry. 2015;290:31090–31100. doi: 10.1074/jbc.M115.661660. [DOI] [PMC free article] [PubMed] [Google Scholar]
- Donaldson GP, Lee SM, Mazmanian SK. Gut biogeography of the bacterial microbiota. Nat Rev Micro. 2016;14:20–32. doi: 10.1038/nrmicro3552. [DOI] [PMC free article] [PubMed] [Google Scholar]
- Dörr T, Cava F, Lam H, Davis BM, Waldor MK. Substrate specificity of an elongation-specific peptidoglycan endopeptidase and its implications for cell wall architecture and growth of Vibrio cholerae. Molecular Microbiology. 2013;89:949–962. doi: 10.1111/mmi.12323. [DOI] [PMC free article] [PubMed] [Google Scholar]
- Dunn AK, Millikan DS, Adin DM, Bose JL, Stabb EV. New rfp- and pES213-Derived Tools for Analyzing Symbiotic Vibrio fischeri Reveal Patterns of Infection and lux Expression In Situ. Applied and Environmental Microbiology. 2006;72:802–810. doi: 10.1128/AEM.72.1.802-810.2006. [DOI] [PMC free article] [PubMed] [Google Scholar]
- Feierbach B, Bisher M, Goodhouse J, Enquist LW. In Vitro Analysis of Transneuronal Spread of an Alphaherpesvirus Infection in Peripheral Nervous System Neurons. Journal of Virology. 2007;81:6846–6857. doi: 10.1128/JVI.00069-07. [DOI] [PMC free article] [PubMed] [Google Scholar]
- Fordtran JS, Locklear TW. Ionic constituents and osmolality of gastric and small-intestinal fluids after eating. The American Journal of Digestive Diseases. 1966;11:503–521. doi: 10.1007/BF02233563. [DOI] [PubMed] [Google Scholar]
- Frirdich E, Biboy J, Adams C, Lee J, Ellermeier J, Gielda LD, DiRita VJ, Girardin SE, Vollmer W, Gaynor EC. Peptidoglycan-Modifying Enzyme Pgp1 Is Required for Helical Cell Shape and Pathogenicity Traits in Campylobacter jejuni. PLoS Pathog. 2012;8:e1002602. doi: 10.1371/journal.ppat.1002602. [DOI] [PMC free article] [PubMed] [Google Scholar]
- Gardel CL, Mekalanos JJ. Alterations in Vibrio cholerae motility phenotypes correlate with changes in virulence factor expression. Infect Immun. 1996;64:2246–2255. doi: 10.1128/iai.64.6.2246-2255.1996. [DOI] [PMC free article] [PubMed] [Google Scholar]
- Garrity GM, Brenner DJ, Krieg NR, Staley JT. Bergey’s Manual of Systematic Bacteriology. Annals of Internal Medicine. 1989;2:520–523. [Google Scholar]
- Gibson DG, Young L, Chuang RY, Venter JC, Hutchison CA, Smith HO. Enzymatic assembly of DNA molecules up to several hundred kilobases. Nat Meth. 2009;6:343–345. doi: 10.1038/nmeth.1318. [DOI] [PubMed] [Google Scholar]
- Gitai Z. The New Bacterial Cell Biology: Moving Parts and Subcellular Architecture. Cell. 2005;120:577–586. doi: 10.1016/j.cell.2005.02.026. [DOI] [PubMed] [Google Scholar]
- Glauner B. Separation and quantification of muropeptides with high-performance liquid chromatography. Analytical Biochemistry. 1988;172:451–464. doi: 10.1016/0003-2697(88)90468-x. [DOI] [PubMed] [Google Scholar]
- Goujon M, McWilliam H, Li W, Valentin F, Squizzato S, Paern J, Lopez R. A new bioinformatics analysis tools framework at EMBL–EBI. Nucleic Acids Research. 2010;38:W695–W699. doi: 10.1093/nar/gkq313. [DOI] [PMC free article] [PubMed] [Google Scholar]
- Hammer BK, Bassler BL. Quorum sensing controls biofilm formation in Vibrio cholerae. Molecular Microbiology. 2003;50:101–104. doi: 10.1046/j.1365-2958.2003.03688.x. [DOI] [PubMed] [Google Scholar]
- Höltje JV. Growth of the Stress-Bearing and Shape-Maintaining Murein Sacculus of Escherichia coli. Microbiology and Molecular Biology Reviews. 1998;62:181–203. doi: 10.1128/mmbr.62.1.181-203.1998. [DOI] [PMC free article] [PubMed] [Google Scholar]
- Iwanaga M, Yamamoto K, Higa N, Ichinose Y, Nakasone N, Tanabe M. Culture conditions for stimulating cholera toxin production by Vibrio cholerae O1 El Tor. Microbiol Immunol. 1986;30:1075–1083. doi: 10.1111/j.1348-0421.1986.tb03037.x. [DOI] [PubMed] [Google Scholar]
- Jensen LJ, Kuhn M, Stark M, Chaffron S, Creevey C, Muller J, Doerks T, Julien P, Roth A, Simonovic M, et al. STRING 8—a global view on proteins and their functional interactions in 630 organisms. Nucleic Acids Research. 2009;37:D412–D416. doi: 10.1093/nar/gkn760. [DOI] [PMC free article] [PubMed] [Google Scholar]
- Juncker AS, Willenbrock H, von Heijne G, Brunak S, Nielsen H, Krogh A. Prediction of lipoprotein signal peptides in Gram-negative bacteria. Protein Science: A Publication of the Protein Society. 2003;12:1652–1662. doi: 10.1110/ps.0303703. [DOI] [PMC free article] [PubMed] [Google Scholar]
- Jung SA, Chapman CA, Ng WL. Quadruple Quorum-Sensing Inputs Control Vibrio cholerae Virulence and Maintain System Robustness. PLoS Pathog. 2015;11:e1004837. doi: 10.1371/journal.ppat.1004837. [DOI] [PMC free article] [PubMed] [Google Scholar]
- Keil C, Maskos K, Than M, Hoopes JT, Huber R, Tan F, Deddish PA, Erdös EG, Skidgel RA, Bode W. Crystal Structure of the Human Carboxypeptidase N (Kininase I) Catalytic Domain. Journal of Molecular Biology. 2007;366:504–516. doi: 10.1016/j.jmb.2006.11.025. [DOI] [PubMed] [Google Scholar]
- Koch RHH. Sechster Bericht der Leiters der deutschen Wissenschaftlichen commission zur Enforschung der cholera. Dtsche Med Wschr. 1884;10:191–192. [Google Scholar]
- Kuru E, Tekkam S, Hall E, Brun YV, VanNieuwenhze MS. Synthesis of fluorescent D-amino acids (FDAAs) and their use for probing peptidoglycan synthesis and bacterial growth in situ. Nature protocols. 2015;10:33–52. doi: 10.1038/nprot.2014.197. [DOI] [PMC free article] [PubMed] [Google Scholar]
- Kuru E, Velocity Hughes H, Brown PJ, Hall E, Tekkam S, Cava F, de Pedro MA, Brun YV, VanNieuwenhze MS. In situ Probing of Newly Synthesized Peptidoglycan in Live Bacteria with Fluorescent D-Amino Acids. Angewandte Chemie (International ed in English) 2012;51:12519–12523. doi: 10.1002/anie.201206749. [DOI] [PMC free article] [PubMed] [Google Scholar]
- Larsen RA, Wilson MM, Guss AM, Metcalf WW. Genetic analysis of pigment biosynthesis in Xanthobacter autotrophicus Py2 using a new, highly efficient transposon mutagenesis system that is functional in a wide variety of bacteria. Archives of Microbiology. 2002;178:193–201. doi: 10.1007/s00203-002-0442-2. [DOI] [PubMed] [Google Scholar]
- Lima AA, Lyerly DM, Wilkins TD, Innes DJ, Guerrant RL. Effects of Clostridium difficile toxins A and B in rabbit small and large intestine in vivo and on cultured cells in vitro. Infection and Immunity. 1988;56:582–588. doi: 10.1128/iai.56.3.582-588.1988. [DOI] [PMC free article] [PubMed] [Google Scholar]
- Liu Z, Miyashiro T, Tsou A, Hsiao A, Goulian M, Zhu J. Mucosal penetration primes Vibrio cholerae for host colonization by repressing quorum sensing. Proceedings of the National Academy of Sciences. 2008;105:9769–9774. doi: 10.1073/pnas.0802241105. [DOI] [PMC free article] [PubMed] [Google Scholar]
- Long T, Tu KC, Wang Y, Mehta P, Ong NP, Bassler BL, Wingreen NS. Quantifying the Integration of Quorum-Sensing Signals with Single-Cell Resolution. PLoS Biol. 2009;7:e1000068. doi: 10.1371/journal.pbio.1000068. [DOI] [PMC free article] [PubMed] [Google Scholar]
- Louis VR, Russek-Cohen E, Choopun N, Rivera ING, Gangle B, Jiang SC, Rubin A, Patz JA, Huq A, Colwell RR. Predictability of Vibrio cholerae in Chesapeake Bay. Applied and Environmental Microbiology. 2003;69:2773–2785. doi: 10.1128/AEM.69.5.2773-2785.2003. [DOI] [PMC free article] [PubMed] [Google Scholar]
- Lupas A, Van Dyke M, Stock J. Predicting coiled coils from protein sequences. Science. 1991;252:1162–1164. doi: 10.1126/science.252.5009.1162. [DOI] [PubMed] [Google Scholar]
- Möll A, Dörr T, Alvarez L, Chao MC, Davis BM, Cava F, Waldor MK. Cell Separation in Vibrio cholerae Is Mediated by a Single Amidase Whose Action Is Modulated by Two Nonredundant Activators. Journal of Bacteriology. 2014;196:3937–3948. doi: 10.1128/JB.02094-14. [DOI] [PMC free article] [PubMed] [Google Scholar]
- Morgenstein RM, Bratton BP, Nguyen JP, Ouzounov N, Shaevitz JW, Gitai Z. RodZ links MreB to cell wall synthesis to mediate MreB rotation and robust morphogenesis. Proceedings of the National Academy of Sciences. 2015;112:12510–12515. doi: 10.1073/pnas.1509610112. [DOI] [PMC free article] [PubMed] [Google Scholar]
- Pacini F. Microscopic observation and pathological deductions on Asiatic cholera: Memory of Dr. Filippo Pacini. Gazz med Ital fed Tosc. 1854;2:397–401. 405–412. [Google Scholar]
- Papenfort K, Förstner KU, Cong JP, Sharma CM, Bassler BL. Differential RNA-seq of Vibrio cholerae identifies the VqmR small RNA as a regulator of biofilm formation. Proceedings of the National Academy of Sciences of the United States of America. 2015;112:E766–E775. doi: 10.1073/pnas.1500203112. [DOI] [PMC free article] [PubMed] [Google Scholar]
- Park SY, Nam HM, Park K, Park SD. Aeromonas hydrophila Sepsis Mimicking Vibrio vulnificus Infection. Annals of Dermatology. 2011;23:S25–S29. doi: 10.5021/ad.2011.23.S1.S25. [DOI] [PMC free article] [PubMed] [Google Scholar]
- Perez LJ, Karagounis TK, Hurley A, Bassler BL, Semmelhack MF. Highly potent, chemically stable quorum sensing agonists for vibrio Cholerae. Chemical Science. 2014;5:151–155. doi: 10.1039/C3SC52572D. [DOI] [PMC free article] [PubMed] [Google Scholar]
- Persat A, Stone HA, Gitai Z. The curved shape of Caulobacter crescentus enhances surface colonization in flow. Nat Commun. 2014;5:1–23. doi: 10.1038/ncomms4824. [DOI] [PMC free article] [PubMed] [Google Scholar]
- Reverter D, Maskos K, Tan F, Skidgel RA, Bode W. Crystal Structure of Human Carboxypeptidase M, A Membrane-bound Enzyme that Regulates Peptide Hormone Activity. Journal of Molecular Biology. 2004;338:257–269. doi: 10.1016/j.jmb.2004.02.058. [DOI] [PubMed] [Google Scholar]
- Richardson K. Roles of motility and flagellar structure in pathogenicity of Vibrio cholerae: analysis of motility mutants in three animal models. Infect Immun. 1991;59:2727–2736. doi: 10.1128/iai.59.8.2727-2736.1991. [DOI] [PMC free article] [PubMed] [Google Scholar]
- Ruby JD, Li H, Kuramitsu H, Norris SJ, Goldstein SF, Buttle KF, Charon NW. Relationship of Treponema denticola periplasmic flagella to irregular cell morphology. Journal of Bacteriology. 1997;179:1628–1635. doi: 10.1128/jb.179.5.1628-1635.1997. [DOI] [PMC free article] [PubMed] [Google Scholar]
- Sawabe T, Ogura Y, Matsumura Y, Feng G, Amin AKMR, Mino S, Nakagawa S, Sawabe T, Kumar R, Fukui Y, et al. Updating the Vibrio clades defined by multilocus sequence phylogeny: proposal of eight new clades, and the description of Vibrio tritonius sp. nov. Frontiers in Microbiology. 2013;4:414. doi: 10.3389/fmicb.2013.00414. [DOI] [PMC free article] [PubMed] [Google Scholar]
- Scheffers DJ, Pinho MG. Bacterial Cell Wall Synthesis: New Insights from Localization Studies. Microbiology and Molecular Biology Reviews. 2005;69:585–607. doi: 10.1128/MMBR.69.4.585-607.2005. [DOI] [PMC free article] [PubMed] [Google Scholar]
- Schild S, Nelson EJ, Bishop AL, Camilli A. Characterization of Vibrio cholerae Outer Membrane Vesicles as a Candidate Vaccine for Cholera. Infection and Immunity. 2009;77:472–484. doi: 10.1128/IAI.01139-08. [DOI] [PMC free article] [PubMed] [Google Scholar]
- Sengupta TK, Chatterjee AN, Das J. Penicillin binding proteins of Vibrio cholerae. Biochemical and Biophysical Research Communications. 1990;171:1175–1181. doi: 10.1016/0006-291x(90)90808-z. [DOI] [PubMed] [Google Scholar]
- Sievers F, Wilm A, Dineen D, Gibson TJ, Karplus K, Li W, Lopez R, McWilliam H, Remmert M, Söding J, et al. Fast, scalable generation of high-quality protein multiple sequence alignments using Clustal Omega. Molecular Systems Biology. 2011;7 doi: 10.1038/msb.2011.75. [DOI] [PMC free article] [PubMed] [Google Scholar]
- Skorupski K, Taylor RK. Positive selection vectors for allelic exchange. Gene. 1996;169:47–52. doi: 10.1016/0378-1119(95)00793-8. [DOI] [PubMed] [Google Scholar]
- Sliusarenko O, Heinritz J, Emonet T, Jacobs-Wagner C. High-throughput, subpixel-precision analysis of bacterial morphogenesis and intracellular spatio-temporal dynamics. Molecular microbiology. 2011;80:612–627. doi: 10.1111/j.1365-2958.2011.07579.x. [DOI] [PMC free article] [PubMed] [Google Scholar]
- Srivastava P, Demarre G, Karpova TS, McNally J, Chattoraj DK. Changes in Nucleoid Morphology and Origin Localization upon Inhibition or Alteration of the Actin Homolog, MreB, of Vibrio cholerae. Journal of Bacteriology. 2007;189:7450–7463. doi: 10.1128/JB.00362-07. [DOI] [PMC free article] [PubMed] [Google Scholar]
- Sycuro LK, Pincus Z, Gutierrez KD, Biboy J, Stern CA, Vollmer W, Salama NR. Peptidoglycan Crosslinking Relaxation Promotes Helicobacter pylori’s Helical Shape and Stomach Colonization. Cell. 2010;141:822–833. doi: 10.1016/j.cell.2010.03.046. [DOI] [PMC free article] [PubMed] [Google Scholar]
- Sycuro LK, Wyckoff TJ, Biboy J, Born P, Pincus Z, Vollmer W, Salama NR. Multiple Peptidoglycan Modification Networks Modulate Helicobacter pylori’s Cell Shape, Motility, and Colonization Potential. PLoS Pathogens. 2012;8:e1002603. doi: 10.1371/journal.ppat.1002603. [DOI] [PMC free article] [PubMed] [Google Scholar]
- Thelin KH, Taylor RK. Toxin-coregulated pilus, but not mannose-sensitive hemagglutinin, is required for colonization by Vibrio cholerae O1 El Tor biotype and O139 strains. Infection and Immunity. 1996;64:2853–2856. doi: 10.1128/iai.64.7.2853-2856.1996. [DOI] [PMC free article] [PubMed] [Google Scholar]
- Ursell TS, Nguyen J, Monds RD, Colavin A, Billings G, Ouzounov N, Gitai Z, Shaevitz JW, Huang KC. Rod-like bacterial shape is maintained by feedback between cell curvature and cytoskeletal localization. Proceedings of the National Academy of Sciences. 2014;111:E1025–E1034. doi: 10.1073/pnas.1317174111. [DOI] [PMC free article] [PubMed] [Google Scholar]
- van Teeffelen S, Wang S, Furchtgott L, Huang KC, Wingreen NS, Shaevitz JW, Gitai Z. The bacterial actin MreB rotates, and rotation depends on cell-wall assembly. Proceedings of the National Academy of Sciences. 2011;108:15822–15827. doi: 10.1073/pnas.1108999108. [DOI] [PMC free article] [PubMed] [Google Scholar]
- Vollmer W, Bertsche U. Murein (peptidoglycan) structure, architecture and biosynthesis in Escherichia coli. Biochimica et Biophysica Acta (BBA) - Biomembranes. 2008;1778:1714–1734. doi: 10.1016/j.bbamem.2007.06.007. [DOI] [PubMed] [Google Scholar]
- Weidel W, Frank H, Martin HH. The rigid layer of the cell wall of Escherichia coli strain B. Microbiology. 1960;22:158–166. doi: 10.1099/00221287-22-1-158. [DOI] [PubMed] [Google Scholar]
- Young K. The selective value of bacterial shape. Microbiology and Molecular Biology Reviews. 2006;70:660–703. doi: 10.1128/MMBR.00001-06. [DOI] [PMC free article] [PubMed] [Google Scholar]
Associated Data
This section collects any data citations, data availability statements, or supplementary materials included in this article.
Supplementary Materials
Figure S1. Related to Figure 1: CrvA determines curvature in Vibrio species including V. cholerae.
(A–B) CrvA was conjugated into ΔcrvA cells in trans on plasmid pTBC06 under a PTAC promoter. Cells with this plasmid exhibited restoration of curvature even without induction (0 μM IPTG), perhaps due to a leaky promoter or inadequate repression. However, induction with 100 mM IPTG caused a pronounced increase in cell curvature relative to wild type or uninduced cells. See Figure 1A–D for characterization of CrvA deletion.
(A) Phase contrast images of early exponential phase cells taken with and without IPTG induction; scale bar is 2 μm.
(B) Quantification of 2D centerline curvature from phase images reveals that induction of CrvA increases curvature. Data represents means ± SEM.
(C) In order to discover whether or not crvA is responsible for the vibrioid shape common in the Vibrio genus, we mapped both curvature and the presence of crvA orthologs onto a phylogenetic tree of the Vibrio genus. We limited our scope to species that were found in Bergey’s Manual of Systematic Bacteriology (Garrity et al., 1989) and for which crvA homology data were present in the STRING database (Jensen et al., 2009). We mapped species meeting these criteria to a single recent phylogenetic assessment of the Vibrio clade (Sawabe et al., 2013). We found that crvA orthologs were only absent in strains documented as straight rods, and present in all other Vibrio species. For example, crvA orthologs are present in relatively closely related species such as V. vulnificus and V. metschnikovii (Park et al., 2011) as well as the more distantly related V. anguillarum (Sawabe et al., 2013), all of which have curved rod morphology (Garrity et al., 1989). Conspicuously, the sister group containing V. parahaemolyticus and V. harveyi lacks crvA orthologs and is comprised entirely of straight rods, indicating that this subclade likely shares an ancestor which has lost crvA and thus vibrioid morphology (Chen et al., 2009; Garrity et al., 1989). This suggests that crvA and its orthologs are responsible for determining vibrioid curvature, the canonical characteristic of the clade, in curved-rod Vibrio species. See Figure 1A–D for characterization of CrvA deletion and Method Details – Genetic Analysis and Strain Construction for details. Curved rod characterization: “+” indicates that the species is documented as a curved rod in some conditions; “−“ indicates that the species is documented as a straight rod; “?” indicates that the shape is not documented.
Figure S2, Related to Figure 1: CrvA-GFP localizes to the inner face of cell curvature and functionally restores curvature with or without Cfx filamentation.
Further characterization of CrvA-GFP localization. See Figure 1A–D for characterization of CrvA deletion, and Figure 1I–K and 2A–B for characterization of CrvA-GFP mutants. Also see Method Details – Phase and Fluorescence Microscopy, Method Details – Filamentation with Cfx, and Quantification and Statistical Analysis – Quantitative Cell-Shape Analysis and Subcellular Protein Localization.
(A–B) Violin plots displaying the probability distributions, means (red), and medians (black) of morphological features for CrvA-GFP, ΔcrvA, and wild type cells. Each distribution constructed from 150–300 cells. All Cfx treatments are of short duration.
(A) Violin plot of cell radius showing that short duration Cfx slightly reduces cell width, an effect that is independent of the genetic background. Furthermore, CrvA-GFP and ΔcrvA mutants have a radius consistent with wild type cells, both in the presence and absence of Cfx.
(B) Violin plot of the mean 3D centerline curvature showing that Cfx does not affect cell curvature. Furthermore, CrvA-GFP has curvature similar to wild type, while ΔcrvA cells are much straighter than wild type cells, with or without Cfx.
(C–E) Characterization of CrvA-GFP in Cfx-filamented cells.
(C) Merged images of phase contrast and GFP fluorescence images of CrvA-GFP cells filamented by a long duration Cfx treatment. Scale bar is 5 μm.
(D) Enrichment of CrvA-GFP as a function of Gaussian curvature at the cell surface. CrvA-GFP localizes to low to negative Gaussian curvature. In Cfx-elongated cells, which have longer stretches of negative Gaussian curvature between the positively-curved poles, the elongated CrvA-GFP structures were enriched at negative Gaussian curvature, consistent with its localization to the inner curved face. Average enrichments are displayed as splines through the data along with 90% bootstrap confidence intervals. The three conditions displayed are no Cfx (182 cells), short duration Cfx (168 cells), and long duration Cfx (80 cells).
(E) CrvA-GFP signal measured in a single cell that underwent long duration Cfx treatment was mapped to the surface of a 3D reconstruction of that cell. The cell was rotated 72 degrees per image (counter-clockwise around red Z-axis), for a total of 144 degrees, or a little less than one half-turn. Axis diagram (bottom right) shows the direction (black curved arrow) and axis of rotation (red arrow) that was applied to the reconstructed cell.
Figure S3, Related to Figure 3: Geometric descriptions of cell morphology
(A–C) Cartoons clarifying the difference between various curvature metrics.
(A) The 2D centerline curvature of a cell is the inverse of the radius of the circle that best fits the centerline. Four different views of the same cell are shown with a rotation of 36° between views. Because the 2D centerline is always a projection of the full 3D centerline, this curvature is a lower bound estimate on the curvature of the cell. See Figures 1D, 1H, 3B, 4F, 5D, 5G, S1B, S6A–C and S3D–F for measurements using this definition of curvature.
(B) The 3D centerline curvature is a measure of the instantaneous curvature at points along the curve. Four different views of the same cell are shown with the centerline colored by its instantaneous curvature. The curvature at each point along the centerline is the inverse of the radius of the “kissing circle” at that point, that is, the circle which most closely approaches the curve at that point. See Figures 3E–F and S2B for measurements using this definition of curvature.
(C) Surfaces can also be described by their curvature, although instead of just a single number, there are two principle directions at each point on a surface. These principle directions are orthogonal and lie in the plane that is tangent to the surface. For each principle curvature, its sign indicates whether it is curving inward or outward with respect to that surface. For a closed surface, we choose the convention that positive principle curvatures bend towards the inside of the surface. The magnitude of the principle curvature is the inverse of the radius of the kissing circle. The Gaussian curvature at a point on the surface is the product of the two principle curvatures at that point. Negative Gaussian curvature describe surface that bend in opposite directions, like saddles or the inner curved face of a vibrioid cell. See Figures 1K and S2D for measurements using this definition of curvature.
(D–F) Cartoons clarifying the relationship between changes in cell geometries. Specifically, asymmetric elongation drives cell curvature. See Figure S3A–C for how curvature is quantified, Figures 4A–D and S6 for more about how cell growth dynamics are measured, and Figure 4E–F for predictions of curvature dynamics based upon observed growth dynamics. See Method Details - Quantitative Analysis of Sacculus Architectural Remodeling (QuASAR). For a full description of analysis and mathematical modeling, see Quantification and Statistical Analysis – QuASAR: Cell Contouring and Image Quantification, QuASAR: Detailed description of growth model, and QuASAR: Predicting morphology from growth asymmetry.
(D) For cells that grow as segments of a torus, there is a simple relationship between the centerline radius of curvature, the diameter of the cell, and the relative lengths of the inner and outer faces. Curvature (κ) is the inverse radius of the centerline circle (1/R).
(E) Proportional growth dictates that for a fixed duration of time, the final length of a segment is proportional to its initial length. Cells with the same proportionality constant (i.e., the same growth rate, ε) on the outer and inner faces will grow in a self-similar growth and maintain the same centerline curvature. This is true independent of the starting length of the cell.
(F) Asymmetric proportional growth, where the inner or the outer faces grow with different proportionality constants, leads to changes in curvature. The resulting curvature is independent of starting length, and depends entirely upon the initial curvature and the asymmetry quotient. Growth with an asymmetry quotient less than 1 leads to a straightening of curved rods (yellow background) whereas an asymmetry quotient greater than 1 leads to increasingly curved rods (blue background).
Figure S4, Related to Figure 2: CrvA alignments to potential bacterial orthologs.
Alignments of CrvA amino acid sequence to potential bacterial orthologs performed with Clustalω. See Figure 2A–D for characterization and experimental interrogation of CrvA domain architecture. Also see Method Details - Genetic Analysis and Strain Construction for more information.
(A) Both CreS and CrvA are coiled-coil rich proteins that act as bacterial shape-determining filaments, generating curvature by forming a filament at the inner curved face of the cell. Alignment of CrvA and IF-like cytoskeletal element CreS reveals some similarities, due to the shared presence of coiled-coil domains. However, sequence homology was low (<20% identity), suggesting that they are not orthologs. Both CreS and CrvA are annotated as Structural Maintenance of Chromosome (SMC)-like proteins, which have two coiled-coil rich regions separated by a spacer. However, CreS and CrvA lack homology to the ATP-binding Walker domains of SMC proteins, consistent with the observation that polymerization of CreS and CrvA is ATP independent, as well as the observation that CrvA localizes to the ATP-free periplasm. Furthermore, it hints at a potential broad role for SMC-like coiled-coil domains in polymerization, rather than merely self-interaction. It is possible that the coiled-coils of adjacent monomers interact with each other (forming intermolecular interactions), rather than interacting with coiled-coils on the same monomer (forming intramolecular interactions), thus forming a filament.
(B) The CT domain of CrvA is predicted by sequence homology to possess a putative PEGA domain, a protein in the CP-C-like superfamily, which is shared with some CPase proteins. These proteins were not characterized by empirical means, so its function was unclear. Alignments of the CT domain of CrvA to PEGA domains from three bacterial genera (VVA0639 from Vibrio vulnificus, Q5QVJ2 from Idiomarina loihiensis, and Q6AK24 from Desulfotea psychrophila) revealed that the CrvA CT domain exhibited sequence homology (>20% identity) with all three domains. It shared the greatest homology (40.5%) with fellow Vibrio protein VVA0639, suggesting that these proteins may be evolutionarily related. Surprisingly, none of the residues of the PEGA motif were conserved in CrvA (CrvA has the sequence QYND instead of PEGA at this site), indicating that these residues are not critical. However, two conserved motifs were identified within the CT domain, residues 324-327 (VTIN) and residues 332-336 (GSTPV). Both of these motifs were deleted to characterize the function of the CT domain of CrvA. Putative PEGA motifs are displayed in bold green, and conserved sequences targeted for deletion are displayed in red.
(C–D) Two classes of peptidases have recently been demonstrated to act upon the cell wall to pattern cell shape. In V. cholerae, the M23 D,D-endopeptidase ShyA contributes to elongation by cleaving cross-links between tetrapeptides (Dörr et al., 2013). In H. pylori, the M14 carboxypeptidase (CPase) Csd4 contributes to helical curvature by cleaving the C-terminal residues from PG peptides. Since the C-terminal (CT) domain of CrvA is associated with some CPases, we tested the homology of the CT domain of CrvA to each of these bacterial cell wall peptidases.
(C) Alignment of the CT domain of CrvA to ShyA. There are no obvious regions of similarity, and sequence homology was low (<20% identity), suggesting that they are not orthologs.
(D) Alignment of the CT domain of CrvA to Csd4. There are no obvious regions of similarity, and sequence homology was low (<20% identity), suggesting that they are not orthologs.
(E) The CT domain of CrvA is predicted to be a PEGA domain. This domain is purported to fall within the CP-C-like protein superfamily, which is shared by the CPN/E family carboxypeptidases (Reverter et al., 2004). To test the homology of these domains, the amino acid sequence of the CT domain of CrvA was aligned to the CP-C-like domains of CPase D, N, and E. Metal-binding residues are displayed in bold and active site residues in bold red. Catalytically inactive C-terminal CP-associated domain (the CP-C domain) are displayed in blue. Catalytic residues were inferred from homology to CPase N, while CT domain is inferred from CPase M. In general, we found that CrvA had poor sequence homology to all of these proteins (<20% identity). However, the CT domain of CrvA aligned best with the CP-C-like domains it was predicted to resemble, which do not include the catalytic residues in all three CPases. The function of the CP-C-like domain remains unclear, but it has been proposed to act as a binding domain (Reverter et al., 2004). Catalytic residues were inferred from homology to CPase N (Keil et al., 2007), while CT domains were inferred from homology to CPase M (Reverter et al., 2004). This analysis is consistent with our data indicating that the CT domain aids polymerization and filament anchoring, and does not suggest an enzymatic role for CrvA.
Figure S5, Related to Figure 2: In vitro and ex vivo characterization of CrvA
(A–B) Signal sequence-deleted MBP-fused CrvA (CrvAΔ(1-35)-MBP) was overexpressed in E. coli overnight at 18°C after induction with 0.2 mM IPTG. See Figure 2C and Figure S8 for EMs of purified protein, and Method Details – Protein Purification for more information.
(A) Coomassie-stained SDS-PAGE showing purification of the fusion protein from amylose columns and elution with 10mM maltose. Since CrvA is an uncharacterized protein, we purified it in three different pH conditions. Ft= column flow-through; In. = supernatant loaded after centrifugation, prior to column purification; Numbers (1–3) indicated elution fractions.
(B) The MBP tag was removed by Factor Xa protease treatment. We tested the best two conditions (pH 6.8 and 7.2) after purification and cleaved the protein at 4°C. Samples were taken at different time points and analyzed on SDS-PAGE. ON=overnight; numbers (0–4) indicated sample time, in hours.
(C–D) TEMs of purified CrvA and CrvAΔcc2 (CrvAΔ(143-182)), prepared as described. Wide fields of view (scale bar = 400 nm) demonstrate robustness of polymerization in mature CrvA, and absence of polymerization in CrvAΔcc2. See Figure 2C for higher-magnification view of CrvA filaments, and Method Details – Electron Microscopy for more information.
(C) TEMs of purified CrvA protein reveal negatively stained filaments.
(D) TEMs of CrvAΔcc2 (CrvA(Δ143-182)) reveal that the cc2 domain is necessary for in vitro polymerization.
(E–F) CrvA-GFP requires signal sequence to enter OMVs.
(E) Negative stain (UAc) of purified OMVs were isolated from V. cholerae by centrifugation and filtration. Scale bar is 50 nm. See Figure 2D for fluorescence images of CrvA-GFP OMVs, and Method Details – OMV Purification and Imaging for more information.
(F) CrvA-GFP phase and fluorescence microscopy. Fluorescence images (top panels) were taken under identical exposure conditions and processed identically after imaging (same minimum and maximum values); scale bar is 5 μm. See Figure 2D for details of fluorescence images CrvA-GFP OMVs, and Method Details – OMV Purification and Imaging for more information. CrvA-GFP OMVs (left panels) fluoresce green, demonstrating that they contain CrvA-GFP. CrvA-GFPΔ(2-37) OMVs (right panels) do not fluoresce green, demonstrating a lack of CrvA-GFP.
Figure S6, Related to Figure 4: Additional QuASAR data
Further characterization of cell shape using the QuASAR assay. See Method Details - Quantitative Analysis of Sacculus Architectural Remodeling (QuASAR). For a full description of analysis and mathematical modeling, see Quantification and Statistical Analysis – QuASAR: Cell Contouring and Image Quantification, QuASAR: Detailed description of growth model, and QuASAR: Predicting morphology from growth asymmetry.
(A–B) The inner and outer faces of straight ΔcrvA cells are indistinguishable at all time points with regards to both old and new material. See Figure 4C–D for comparable experiments performed on asymmetrically-growing wild-type V. cholerae cells. (A) Integral of new material is not significantly different between the inner and outer faces of straight ΔcrvA cells. Data represent median values of the integral (sum) of NADA signal for outer (solid line) and inner (dashed line) faces of ΔcrvA cells at each time point, and error bars are 90% confidence intervals.
(B) Integral of old material is not significantly different between the inner and outer faces of straight ΔcrvA cells. Data represent median values of the integral (sum) of HADA signal for outer (solid line) and inner (dashed line) faces of ΔcrvA cells at each time point, and error bars are 90% confidence intervals.
(C) Plotting curvature as a function of the integral of new material on the outer face over the integral of new material on the inner face reveals that this ratio has a best fit line with positive slope for wild type cells (best slope: 0.064 ± 0.033, 90% C.I.; correlation coefficient 0.21). For ΔcrvA cells, this slope is not significantly different from zero (0.0053 ± .010, 90% C.I.; correlation coefficient 0.058).
(D–E) Exponential growth model of proportional growth (ε′). Even in the presence of degradation, ε reports on the insertion of new material. Fits are to Equation S8 with one global value of C and are displayed with 90% bootstrap CI. See Figure 4E–F for predictions of curvature dynamics based upon observed asymmetries in proportional growth.
(D) For wild type cells, the inner face (purple) grows slightly slower than the outer face (orange).
(E) For ΔcrvA cells, the inner face (purple) is indistinguishable from the outer face (orange).
(F) Example images from QuASAR at 6 minutes and 30 minutes after the transition from HADA to NADA. The intensity scales from cell to cell are the same in each of the phase (top), NADA (middle), and HADA (bottom) channels. Over time, the old material is degraded and new material is inserted, however there is still a significant signal in the old material channel at 30 minutes. See Figures 4B–C and S10A–B for measurements of fluorescence intensity at different timepoints.
Figure S7, Related to Figure 6: Experiments in support of comparisons and competitions of straight and curved cells
(A) The growth curves for both wild type and ΔcrvA on a semi-log graph. Cells were grown with shaking at 37°C in LB. Means and standard error were calculated from four biological replicates measured in quadruplicate. See Figure 6 for competitive assays between wild type and ΔcrvA. See Experimental Model and Subject Details – Bacterial Growth for information regarding bacterial culture and optical density measurements.
(B) Competitive index of mKO-expressing cells to mTFP-expressing cells following 28 hours of competitive exponential phase growth in M9+0.5% glucose shaking at 30°C. None of the competitions, including ΔcrvA relative to wild type, displayed a competitive index different from 1 (p>0.6). Means and standard error represent data from five biological replicates, with 200–1000 cells counted per biological replicate. See Figure 6 for competitive assays between wild type and ΔcrvA. Also see Method Details – Competitive Index for further information.
(C) Immunoblot comparing levels of production of attachment pilus TcpA. Wild-type and ΔcrvA cells were grown under virulence inducing condition. The lysed cells were normalized by protein concentration and subjected to SDS-PAGE and immunoblotting using anti-TcpA antiserum and HRP-labeled goat anti-rabbit IgG antibody. Wild type and ΔcrvA strains exhibit similar levels of TcpA production, which is tightly co-regulated with toxin production. Thus, the competitive differences between WT and ΔcrvA are not likely to be due to different levels of toxin production or differences in attachment due to pilus expression. See Figure 6D–E for competitive colonization and pathogenesis assays between wild type and ΔcrvA. Also see Method Details – Virulence Factor Assessment for further information.
(D) Comparison of experimental osmolality conditions (bars in graph) to environmental osmolality commonly encountered by V. cholerae (horizontal bars/rectangles, in brown). Cells exhibit growth- and cell density-dependent curvature dynamics in LB made with 10 g/L of principle osmolyte NaCl (480 ± 10 mOsm, left bar). Osmolality remains constant regardless of cell growth and metabolism (cell-free spent media had an osmolality of 476 ± 8 mOsm, center bar). Thus, curvature increases at constant osmolality, suggesting that curvature evolution does not require osmotic changes. In contrast, growth in a high-osmolality, sucrose-containing medium (Figure 3A–B) caused cells to straighten and CrvA-GFP to lose its characteristic localization pattern (670 ± 15 mOsm, right bar). In order to understand the significance of these osmolality measurements for V. cholerae, which experiences fluctuating conditions of moderate osmolality throughout its lifecycle, we compared our measurements with some typical environmental conditions. LB is somewhat more brackish than the typical human small intestine (270 – 310 mOsm) (Fordtran and Locklear, 1966) and the osmolality of rabbit ileal lumen is slightly higher following treatment with cholera toxin (325 ± 8 mOsm) (Lima et al., 1988). Environmental isolates of V. cholerae have been found at a variety of brackish conditions from 2 to 14 parts per thousand salinity, very close to our LB with of 10 g/L NaCl (Louis et al., 2003). Thus, our high-osmolality, sucrose containing medium was roughly twice the normal environment of V. cholerae, and was not significantly different from the upper bound for an estuarine environment which V. cholerae is known to inhabit (Louis et al., 2003). While V. cholerae may experience marine conditions which could result in environmentally-driven shape changes, the decreased abundance of V. cholerae at salinities above 14 parts per thousand (Louis et al., 2003) and its increased temperature sensitivity at higher salinities (Blackwell and Oliver, 2008) do not support an adaptive link between high osmolality and morphological changes.
Table S1, Related to Figure 2: UPLC of ΔcrvA and wild-type sacculi. PG composition of both strains is very similar at lower density (where curvature is less pronounced) or at higher density (where curvature is more pronounced). Means and standard errors are from three separate experiments per strain and condition. Columns on right show statistical analysis of the differences between the means and standard errors of UPLC results. Student’s t-test reveals that no statistically significant differences were observed between the two strains in any of the muropeptide species measured. See Method Details - Purification of Sacculi and UPLC Analysis of Peptidoglycan Composition and Figure 2E–F for more information.
Contains useful information regarding primers used in this study. See Method Details - Genetic Analysis and Strain Construction.
Contains useful information regarding strains used in this study. See Method Details - Genetic Analysis and Strain Construction.
Flyaround rotations reveal CrvA prefers negative Gaussian curvature. Top panel shows CrvA-GFP intensity mapped to the surface of five different cells, with intensity scaled from minimum to maximum per cell. Bottom panel shows Gaussian curvature for those same cells. Cells are displayed in the same orientation in both panels. See Figure 1I–K, 2A–B, and S3 for further characterization of CrvA-GFP.
Agarose pads were made with M9 medium supplemented with lysozyme and fosfomycin to degrade cell wall, and EDTA and polymixin B to disrupt the outer membrane. Cells lyse due to their own turgor pressure, leaving behind robust CrvA-GFP filaments. Images were acquired every ten minutes, and if frames went out of focus in the final timepoints, the final frame was duplicated so that all endpoints could be viewed simultaneously. See Figure 1I–K, 2A–B, and S3 for further characterization of CrvA-GFP. Images were resized identically. Playback speed of 4 fps; scale bar is 5 μm.
Timecourses of CrvA-GFP, CrvA-GFPΔ(324-327), and CrvA-GFPΔ(332-336) cells reveal that CrvA-GFP filaments are stable, while CT-domain mutant localization is mobile. Images were acquired every thirty seconds on M9 pads supplemented with glucose. See Figure 1I–K, 2A–B, and S3 for further characterization of CrvA-GFP. Playback speed of 5 fps; scale bar is 5 μm.
Video reconstructed from continuously acquired phase images. See Figure 6 for competitive motility-based assays between wild type and ΔcrvA. Panels have identical size scaling and playback speed (real time playback speed of 5.2 fps).