Abstract
Stress-induced reductions of neural precursor cells from the subgranular zone of the hippocampal dentate gyrus have been linked to impaired neurogenesis and cognitive dysfunction. Given the importance of redox state in regulating multiple damage-responsive pathways in the CNS, we hypothesize that oxidative stress plays a major role in affecting neurogenesis and subsequent cognitive function after cell injury/depletion. Using an in vitro system, we showed that the level of reactive oxygen species (ROS), which depend critically on changes in cell density, were significantly higher in neural precursor cells when compared with other primary and transformed cell lines. ROS were significantly elevated (≈4-fold) under low- (<1 × 10⁴ cells per cm2) versus high-density (>1 × 10⁵ cells per cm2) conditions. Higher ROS levels found at lower cell densities were associated with elevated proliferation and increased metabolic activity. These ROS were likely a result of altered mitochondrial function that ultimately compromised the growth rate of cells. At high cell densities, intracellular ROS and oxidative damage were reduced in concert with an increased expression of mitochondrial superoxide dismutase 2. Our finding that DNA-damage-induced depletion of neural precursor cells in the subgranular zone of mice also led to increased ROS and altered proliferation validated our in vitro system. Increased ROS and proliferation associated with the reduction of precursor cell numbers both in vitro and in vivo could be reversed with the antioxidant α-lipoic acid. These data showed that neural precursor cells were predisposed to microenvironmental cues that regulate redox-sensitive pathways to control cellular proliferation after CNS damage.
Neurogenesis occurs in the mammalian dentate gyrus throughout life (1), resulting in the integration of newly born cells into the hippocampal circuitry (2). Although the functional role of these cells has not yet been fully established, considerable correlative data suggest that changes in dentate neurogenesis are associated with altered cognitive function (3, 4). The cells responsible for neurogenesis are sensitive to a variety of insults, including ionizing irradiation (5, 6), exposure to proinflammatory mediators (7), and stress (8), all of which lead to a reduction in the numbers of precursor cells and their progeny. Although direct damage to neural precursor cells is important to injury-induced alterations in neurogenesis, recent data suggest that alterations in the microenvironment may play a prominent role (4–6). Such alterations are likely to involve various types of direct cell–cell interactions as well as the activities of diffusible/soluble factors released by damaged or dying cells. These factors may readily affect cellular homeostasis leading to the disequilibrium between pro- and antioxidants within cells, thereby altering redox state and subsequently affecting self renewal and differentiation (9).
The high metabolic requirements of the CNS, along with the relatively low levels of antioxidants and high amounts of poly-unsaturated fatty acids that can promote chain reactions, may predispose the brain to injury from free radicals, including reactive oxygen species (ROS). Changes in redox state have been shown to be critical in regulating cell survival after a variety of insults, including irradiation, trauma, ischemia, and neurode-generation (10–13). Direct oxidative insult is an inevitable component of injury and can induce a number of effects, including the activation of signaling pathways and the promotion of cell cycle arrest, DNA repair, and apoptosis. These effects are also integral factors of the overall stress response that has a direct impact on the viability of all tissues (14). Under normal physiological conditions, it has been shown that certain agents, including growth factors, are capable of stimulating the production of mitochondrial (mt)-derived ROS (15); this suggests that oxidative species may function as signaling molecules. Radiation and other noxious stimuli elicit fluctuating changes in ROS, growth factors, and cytokine levels within the CNS, and these factors can dictate the attrition and repopulation of cells within a damaged tissue. Although most studies that address the effects of damaging agents focus on intracellular events, it is easy to overlook the impact of cell loss on the microenvironment and on the remaining surviving cell population. Therefore, we contend that the mere absence of cells constitutes an integral component of the general CNS stress response, affecting redox state and subsequent physiologic parameters. This latter effect can be modeled in vitro, by simple manipulations of culture density.
Recent studies (13) have shown that, after irradiation, increased oxidative stress is associated with an acute and chronic depletion of neural precursor cells in vitro. Furthermore, in the irradiated brain, increased measures of oxidative stress within the hippocampus occur at a time when numbers of proliferating precursors and their progeny are significantly reduced (6, 13). These findings corroborate previous work (16) that suggests that redox state is critical in regulating the stress response of these cells. Although an in vitro neural precursor cell model does not simulate the complexity of the hippocampal microenvironment, it provides a unique system whereby the mechanisms governing these interactions can be addressed independently.
Materials and Methods
Growth of Neural Precursor Cells. Standard growth conditions for maintaining multipotential neural precursor cells derived from the rat hippocampus have recently been described (13). For all cell density experiments described, cells were seeded 2 days before analysis, unless noted otherwise, and counted the day of assay to confirm actual cell numbers. For the purposes of this paper, low density (LD) refers to <104 cells per cm2, and high density (HD) refers to >105 cells per cm2. For those experiments investigating the effects of α-lipoic acid (LA, Sigma), the antioxidant was added at the time of plating and left in culture until the time of assay.
Measurement of ROS. To detect intracellular ROS, anchored cultures of variable cell density were treated for 1 h at 37°C with 5 μM of the ROS-sensitive dye 5-(and-6)-chloromethyl-2′,7′-dichlorodihydrofluorescein diacetate (Molecular Probes) (17). Analysis by fluorescence-activated cell sorting (FACS) was done immediately after dye treatment, and all measurements were repeated at least three times.
Determination of Cell Growth and Metabolic Activity. Cultures of neural precursor cells seeded at different densities were counted over 2–10 days to determine population-doubling times. Additional flasks were also pulse-labeled with BrdUrd and processed by using a kit (AC/D-S, Phoenix Flow Systems, San Diego) to determine the percentage of S-phase cells after 2 days by FACS.
To gauge cellular viability, the metabolic activity of cells grown at different densities was determined by using the XTT assay (Sigma). Equal numbers of cells were either assayed in suspension (2-day time points) or plated and assayed over longer times while anchored according to the manufacturer.
Assay of Mitochondria by FACS Analysis. FACS and Western analyses were performed to determine the status of mitochondria in neural precursor cells cultured at different densities. mt content was initially probed by using nonyl acridine orange (NAO, Molecular Probes) (18). mt content was also assayed by analyzing mt porin levels by Western blot (see below). Functionality of mitochondria was probed by using rhodamine 123 (R123, Molecular Probes) or tetramethylrhodamine methyl ester (TMRM, Molecular Probes) (19), two dyes whose fluorescence depends on mt transmembrane potential (ψm). Anchored cells were incubated independently with 10 μM of the mt selective dyes for 30 min just before FACS analysis. All results were derived from a minimum of three determinations.
Western Analysis of mt Proteins. Cell extracts from multiple flasks at LD or HD were prepared by using standard techniques (20) and were analyzed by Western blot to determine the relative abundance of mt specific proteins. Samples were normalized for protein content (60 μg of total protein), separated by 4–20% SDS/PAGE (Readygels, Bio-Rad), and transferred to nitrocellulose membranes. Membranes were probed with antibodies against manganese superoxide dismutase (MnSOD, diluted 1:4,000; SOD-111, StressGen Biotechnologies, Victoria, Canada), mt aconitase (diluted 1:2,000, provided by Richard Eisenstein, University of Wisconsin, Madison), and porin (clone 529538, diluted 1:500; Calbiochem), and detected with species-specific horseradish peroxidase-conjugated secondary antibodies in conjunction with the ECL chemiluminescent reagent (Amersham Pharmacia Biosciences).
Data Analysis and Statistics. Significance between data sets obtained through FACS analysis was determined by the Kolmogorov–Smirnov test provided with cellquest software (BD Biosciences, San Jose, CA). Mean fluorescent values derived from multiple FACS data sets were also assessed for significance (assigned at the P = 0.05 level) by ANOVA.
In Vivo Studies. Wild-type C57BL/J6 mice (2-month-old males, ≈20 g) were purchased from a commercial vendor (The Jackson Laboratory). Mice were housed and cared for in accordance with the U.S. Department of Health and Human Services Guide for the Care and Use of Laboratory Animals; all protocols were approved by the Institutional Committee for Animal Research. Irradiation, anesthesia, perfusion, and tissue collection procedures have been described (6).
Ki-67 Immunohistochemistry. Proliferating cells in the dentate subgranular zone (SGZ) were labeled with an antibody against Ki-67, a nuclear antigen that is expressed during all stages of the cell cycle except G0 (21). Tissue sections were processed for the detection of Ki-67-positive cells (6), and the number of proliferating cells was quantified within a standardized counting area of the SGZ by using a histomorphometric approach as described (6).
Measurement of Oxidative Damage in Vivo. For quantitative analysis of lipid peroxidation, tissues from control and irradiated (10 Gy) animals were collected 24 h and 1 week after treatment. To quantify oxidative stress in vivo, a commercially available kit that measures malondialdehyde (MDA) levels in cell lysates and tissue homogenates was used (Lipid Peroxidation Assay Kit, Calbiochem). Tissue homogenates and experimental procedures were performed according to the manufacturer. MDA levels in irradiated and unirradiated brains were determined in triplicate and calibrated against a standard curve generated the day of assay.
To qualitatively localize oxidatively damaged cells within the hippocampal formation, immunolabeling was done with an anti-MDA antibody (Alpha Diagnostics, San Antonio, TX; diluted 1:100 in 2% normal goat serum in PBS) by using a similar approach as for Ki-67 above.
Data Analysis and Statistics. For immunohistochemical endpoints, values for all animals in a given treatment group were averaged and SEM were calculated. A Wilcoxon–Mann–Whitney test for two independent samples stratified by dose was used to determine whether cellular changes in radiation response were statistically significant. For MDA data, means were calculated and assessed for significance (P ≤ 0.05) by Student's t test.
Results
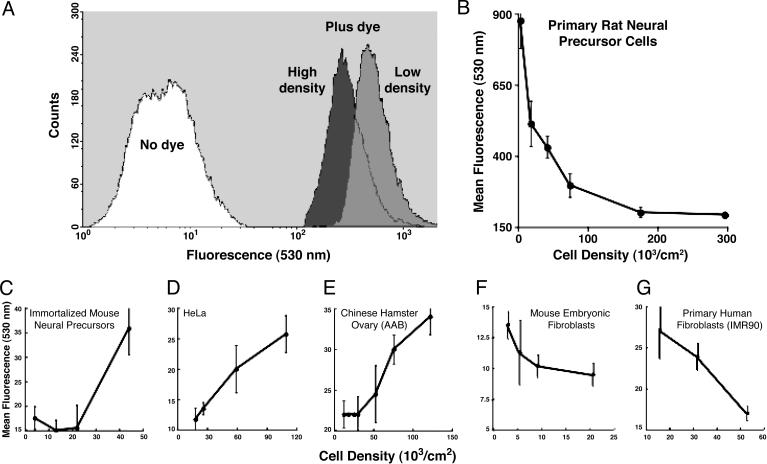
Cell-Density-Dependent Production of ROS. We hypothesized that changes in cell density altered ROS levels, which are critical in regulating neural precursor cell function. To show this, we monitored redox-sensitive endpoints as a function of cell density. Exponentially growing cultures of neural precursor cells were seeded over a range of subconfluent cell densities (0.4 × 10⁴ –1.6 × 10⁵ cells per cm2) and analyzed for ROS levels by FACS 48 h after plating (17). Histograms of FACS-sorted cells cultured at LD showed significantly more ROS than the same cells cultured at HD (Fig. 1A). As cell cultures grew and expanded from LD, ROS levels dropped rapidly and then leveled off (Fig. 1B). This marked dependence of ROS production on cell density was atypical of other cell lines tested. The opposite trend was observed in immortalized neural precursors (Fig. 1C) and other transformed cells (Fig. 1 D and E), where increasing cell density was associated with increasing ROS levels. Although other primary cells (Fig. 1 F and G) did show the same general trend in ROS vs. cell density as primary neural precursors, the effect was much less pronounced, given that the absolute levels of ROS were at least an order or magnitude lower.
Fig. 1.
Cell-density-dependent production of ROS. Cells grown at different densities were treated while anchored with the fluorogenic dye 5-(and-6)-chloromethyl-2′,7′-dichlorodihydrofluorescein diacetate and assessed for intracellular ROS by FACS analysis. FACS histograms (A) show that neural precursor cells are not autofluorescent and have elevated ROS at LD versus HD. ROS levels drop rapidly as neural precursors grow to HD (B) but are significantly higher at all densities when compared with other cells (C–G). All data in B–G are averaged from four or more experiments (±SEM).
The marked production of density-dependent ROS was also affected by anchorage conditions. Density-dependent differences in ROS levels were maximized when cells were completely anchored and were gradually lost once cells were harvested, and 3–4 h in suspension effectively eliminated the density effect. Further controls confirmed that differences in the concentration of cells in suspension and/or dye did not account for the different ROS levels observed between cultures grown at different cell densities (data not shown).
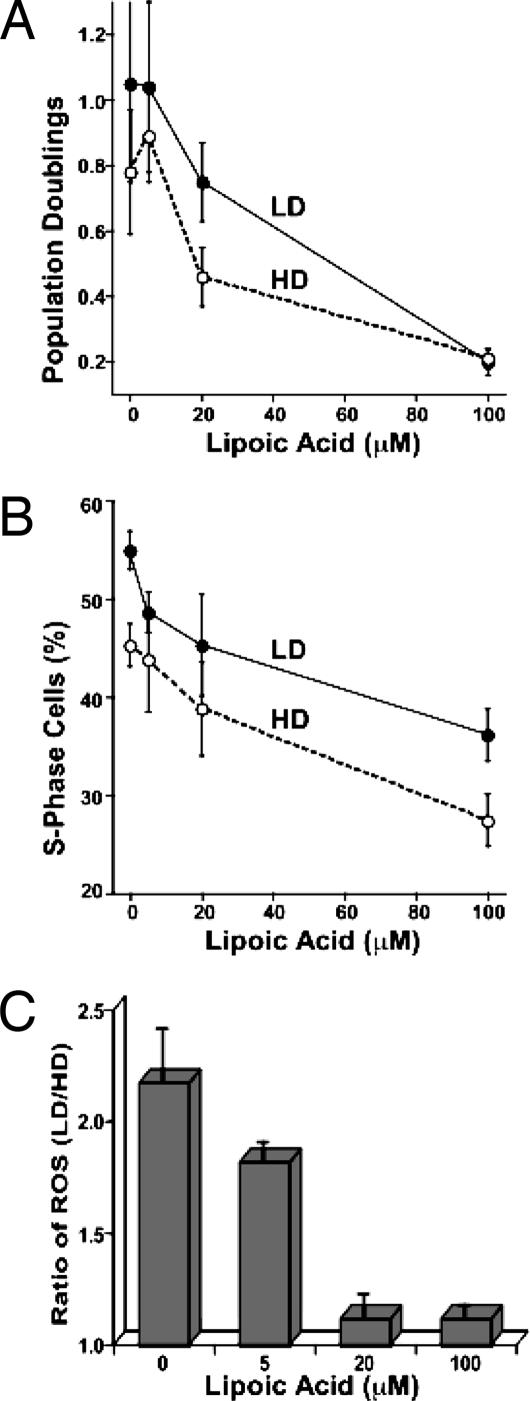
Dependence of Cell Growth upon ROS. The response of ROS to changes in cell density suggested that ROS are involved in regulating proliferation. Thus, to determine the potential physiological impact of ROS, cells were cultured at different densities in the presence or absence of the antioxidant LA and analyzed for changes in growth rate and cell cycle distribution by FACS analysis. In the absence of LA, LD cultures tended to show more rapid population growth (Fig. 2A) and higher S-phase fractions (Fig. 2B) than HD cultures. In the presence of LA, both LD and HD cultures showed a significant and concentration-dependent inhibition of growth (≈3-fold longer doubling times and ≈1.5-fold reduction in S-phase cells at 100 μM). To analyze the scavenging capacity of LA more directly, LD and HD cultures were analyzed for ROS levels. The levels of ROS in LD cultures decreased significantly as the concentration of LA increased, whereas LA induced only marginal decreases in ROS in the HD cultures (Fig. 2C). Ultimately, in the presence of LA, ROS levels in cells cultured at LD approached those levels found in HD cultures treated with LA. These results demonstrated the capability of LA to scavenge ROS and suggested that by altering the level of ROS, growth could be attenuated.
Fig. 2.
Cell growth depends on ROS levels. Cells grown at varying densities were assessed for population doubling, cell cycle distribution, and ROS levels in the presence (5–100 μM) and absence of lipoic acid over 2–3 days. In the presence of lipoic acid, LD and HD cultures showed concentration-dependent decreases in population doubling (A) and S-phase fractions (B). Increasing concentrations of LA were also found to progressively reduce the LD/HD ratio of ROS found at different densities (C). All data are averaged from three or more experiments (±SEM).
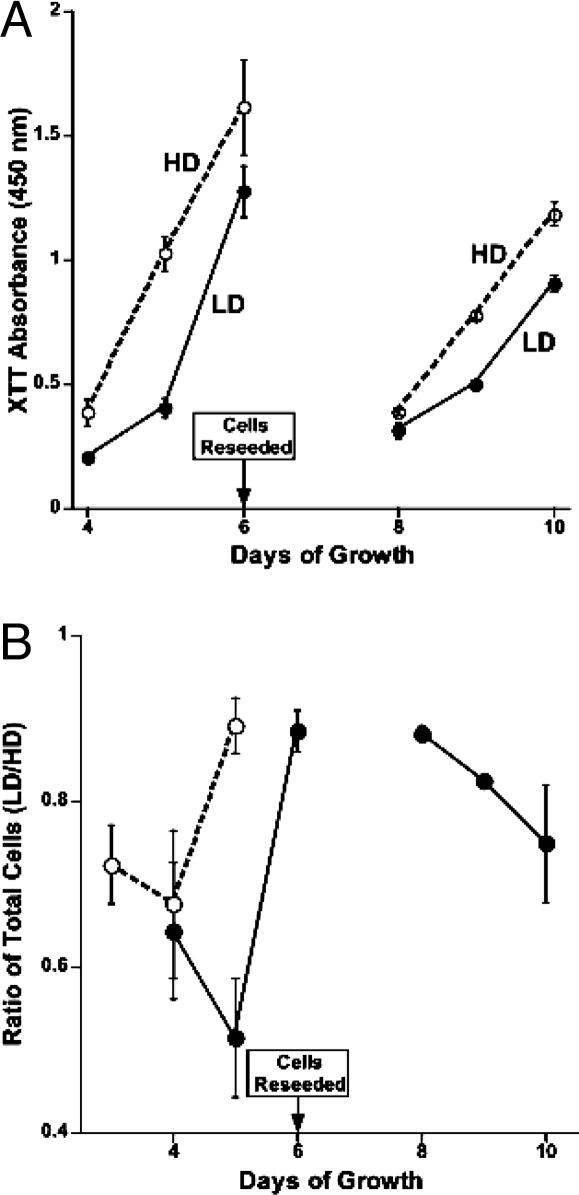
To more thoroughly examine the potential consequences imparted by differences in cell density, metabolic activity and proliferation were measured after cells were reseeded at equal densities. Cells cultured at LD and HD as described (i.e., for 2 days) were harvested and either immediately assayed by using the XTT assay or reseeded for subsequent analysis. Cells derived from LD cultures showed a significantly higher XTT absorbance (26%, P < 0.05), indicating an increased metabolic activity compared with cells derived from HD. However, when these cells (i.e., LD and HD) were reseeded (on day 2) at equal densities (1.2 × 10⁴ cells per cm2), those derived from LD cultures exhibited a persistent inhibition of growth (Fig. 3). Analysis of cultures derived from LD conditions by XTT assays showed lower absorbance at days 4, 5, and 6 compared with cultures derived from HD conditions. When day 6 cultures were harvested and reseeded again at equal densities, lower XTT readings still persisted in cultures derived from LD conditions (Fig. 3A). Cell counts confirmed that the XTT data reflected reduced cell numbers in cultures from LD. When cell counts were compared among conditions, the ratio (LD/HD) of total cells was always less than unity (Fig. 3B) and indicated that cultures derived from LD conditions showed slower growth than their HD counterparts, both before and after reseeding at day 6. Similar data were also obtained when higher numbers of cells were reseeded (4.0 × 10⁴ cells per cm2) from LD and HD cultures (Fig. 3B), suggesting that the persistent inhibition of growth was more likely a consequence of changes and/or damage incurred during the initial period of growth at LD. Given the prevalence of ROS and increased metabolic activity of the mitochondria that is associated with LD cultures, and based on the knowledge of the critical role mitochondria play in the intracellular metabolism of ROS (15, 22), we suspected that many of our density-dependent effects were associated with alterations at the mt level.
Fig. 3.
Cells cultured under LD conditions exhibit a persistent inhibition of growth. Cells were cultured at LD or HD for 2 days before reseeding at equal densities and subsequent analysis over the course of 10 days. Cultures derived from LD conditions (A, solid lines) exhibited reduced XTT absorbance compared with cultures derived from HD (A, dashed lines), even after cells were reseeded again at equal densities on day 6. Cultures grown from LD conditions had significantly fewer cells than those grown from HD conditions, as indicated by a ratio (LD/HD) of total cell counts that was always less than unity (B). The slower growth of cells from LD conditions persisted over 10 days and was observed at two different densities (i.e., 1.2 × 10⁴/cm2 solid line, or 4.0 × 10⁴/cm2 dashed line, B). All data averaged from three experiments (±SEM).
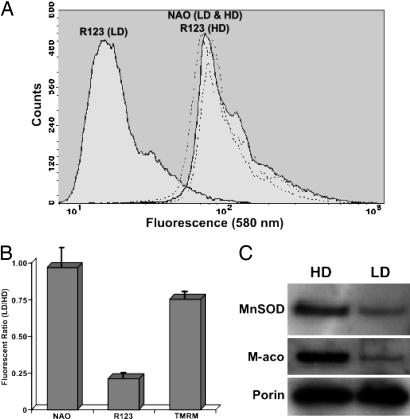
mt Changes and Oxidative Stress. To determine the status of mitochondria under our different culture conditions, LD and HD cultures were assessed for mt content and function by FACS analysis by using the dyes NAO and R123, respectively (17). Analysis of FACS histograms showed no significant differences between LD and HD cultures with respect to mt content (Fig. 4A), yielding a LD/HD ratio of NAO fluorescence near unity (Fig. 4B). This result was confirmed by Western analysis of mt porin levels (Fig. 4C). However, analysis of cells treated with R123 at different densities showed a significant drop in fluorescence in LD cultures (Fig. 4A), suggesting that those conditions favored a state of altered mt function (Fig. 4B). To demonstrate further that the drop in R123 fluorescence observed at LD represented an actual change in mt ψm, cells cultured at different densities were also analyzed with the dye tetramethylrhodamine methyl ester (TMRM). Fluorescence in LD cultures treated with TMRM was not reduced to the same extent as found with R123 (Fig. 4B) and may reflect both differences in dye uptake and some concentration-dependent quenching of R123 fluorescence. Despite these differences, both dyes showed lower fluorescence, suggesting real physiologic changes in mt ψm in LD cultures. In addition to the impact of density upon mt function, the levels of proteins specific to these organelles were also found to be different. LD cultures had three to four times less MnSOD than HD cultures (Fig. 4C), as well as significantly lower levels of the metabolic enzyme aconitase (Fig. 4C). These data suggest that as cells expand to HD, there is a direct up-regulation of MnSOD that reduces ROS and slows proliferation. However, high levels of ROS can also be damaging and likely contribute to the degradation of mt aconitase, because aconitase is structurally predisposed to free radical attack and subsequent degradation (23), and because message levels of this protein as determined by RT-PCR show little variation with cell density (data not shown). Changes in mt proteins noted above clearly show that redox state impacts the physiology of these cells.
Fig. 4.
mt alterations correspond to density-dependent changes in oxidative stress. FACS analysis of anchored cells treated with the mt probe NAO indicated little density-dependent fluctuation in mt content (A, dashed lines), yielding a LD/HD ratio of NAO fluorescence near unity (B). This result was confirmed by Western analysis of mt porin levels (that also served as loading controls for these blots) and showed that mt content varied little with cell density (C). However, FACS analysis of LD anchored cells treated with the mt function probe R123 showed a dramatic drop in fluorescence (A, solid lines) that resulted in a considerable decline in the fluorescent ratio (LD/HD) of R123 (B). Qualitatively similar results (B) were obtained with the dye tetramethylrhodamine methyl ester, suggesting that reduced cell densities lead to physiologic changes in mt ψm. Further analysis of mt proteins showed that aconitase was significantly lower (10-fold) in LD cultures (C), and that MnSOD was higher (3- to 4-fold) in HD cultures. All data in B are averaged from four or more experiments (±SEM).
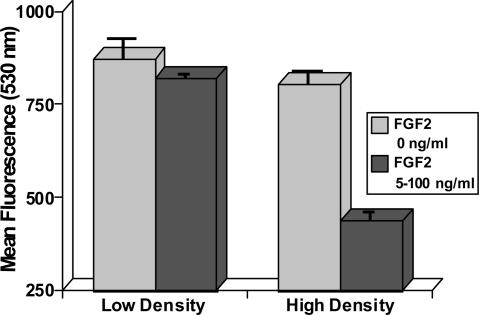
Oxidative Stress and Growth Factors. Growth factors have been reported to increase intracellular ROS in some cell systems (15) but not in others (16), so we investigated whether the differences in ROS we observed at different culture densities might be due to fluctuations in fibroblast growth factor 2 (FGF2). In our system, precursor cells are normally cultured in serum-free medium plus 20 ng/ml FGF2 (13). To determine whether density-dependent ROS levels depended upon the concentration of growth factor, we cultured cells for 2 days in different levels (0–100 ng/ml) of FGF2. Regardless of cell density, the absence of growth factor was associated with relatively high ROS, whereas the addition of 5 ng/ml FGF2 reduced those levels, most significantly at HD (Fig. 5). Supplementation with more FGF2 (20–100 ng/ml) had little additional effect (Fig. 5) and indicated that the differences in ROS levels observed at different cell densities were not growth factor related.
Fig. 5.
Relationship between density-dependent ROS and growth factor. Differing densities of neural precursor cells were cultured in serum-free media supplemented with varying levels of FGF2 (0–100 ng/ml). FACS analysis of cells cultured in the absence of FGF2 showed higher levels of ROS at all cell densities tested. Addition of FGF2 lowered ROS levels but to a much greater extent in HD cultures, but the presence of varying FGF2 did not account for the cell-density-dependent differences in ROS reported in this study. All data are averaged from three or more experiments (±SEM).
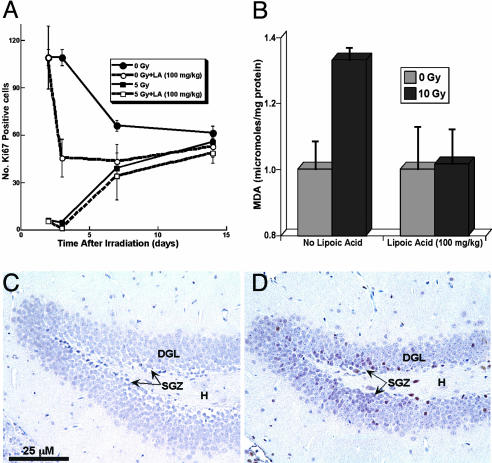
Proliferation and Oxidative Stress Within the Hippocampus. To substantiate the relevance of our in vitro observations, studies were undertaken in mice to determine the relationship between redox state and number of neural precursor cells in vivo. To accomplish this, we reduced neural precursor cells in the mouse dentate SGZ by using ionizing irradiation (5 Gy). Irradiation led to a significant drop in the number of proliferating (Ki-67-positive) precursor cells by 2 days (Fig. 6A); this cell loss was followed by a subsequent increase in proliferation that lasted >1 week (Fig. 6A). Over this same postirradiation interval, measurements of lipid peroxidation showed an increase in the amount of MDA, as detected by bulk measurements of hippocampal tissues (Fig. 6B) or immunohistochemistry of tissue sections (Fig. 6 C and D). Thus, as observed in LD cultures, reducing the number of neural precursor cells in vivo was followed by an increased proliferation that was associated with an elevated oxidative stress in the dentate SGZ.
Fig. 6.
Proliferation and oxidative stress within the hippocampus. Brain tissues from irradiated (5–10 Gy) and nonirradiated mice with or without treatment with LA (100 mg/kg) were processed for immunohistochemical analysis or MDA assays. Numbers of proliferating cells within the SGZ of the dentate gyrus were quantified as described. Unirradiated controls showed a typical age-dependent decline in the number of proliferating precursors (A, filled circles) that was markedly enhanced by LA treatment (A, open circles). Analysis of tissues from irradiated mice demonstrated the effectiveness of X-irradiation to reduce the numbers of proliferating neural precursors in the SGZ (A, filled squares). Proliferating cells then recover over the next 2 weeks; this was not affected by the presence of LA (A, open squares). During this increased proliferation, oxidative stress increased as measured by MDA levels of hippocampal tissue (10 Gy, 2 weeks), an effect that could be reversed by LA (B). Compared with unirradiated controls (C), tissue sections from these irradiated mice showed that MDA staining (purple/brown cells) was concentrated in both blades of the SGZ (D). All data in A are averaged from five or more experiments (±SEM).
Elevated ROS persisting within the irradiated hippocampus may function as a neurotrophic signal to stimulate cell proliferation after the depletion of precursor cells within the SGZ. To analyze this possibility, mice were given LA and analyzed for changes in proliferation and oxidative stress in the dentate SGZ. Administration of LA in vivo was found to reduce cell proliferation; unirradiated mice given LA exhibited reduced numbers of proliferating (Ki-67-positive) cells (Fig. 6A), whereas the effect of LA in irradiated animals was less pronounced due to the marked radiation-induced depletion of precursor cell numbers. After irradiation, LA also lowered MDA levels in hippocampal tissue (Fig. 6B), indicating that this antioxidant can ameliorate radiation-induced oxidative stress in vivo.
Discussion
In our in vitro model, regardless of cell density, neural precursor cells showed significantly higher levels of ROS relative to a variety of primary and established cell lines. This suggests that neural precursor cells may be uniquely predisposed to redox regulation. Given their mitotic activity and multipotentiality, these cells must possess the capability to respond to multiple endogenous and exogenous cues to control their ability to divide and/or differentiate. We suggest that ROS are critical to this decision.
Given the significant changes in ROS as a function of cell density (Fig. 1), we assume that this may be associated with relevant physiologic parameters such as proliferation. This was supported by our data (Fig. 2 A and B), showing that reducing ROS levels through the use of LA could slow proliferation (Fig. 2 A and B). Our LA data (Fig. 2C) also suggested that under certain conditions (i.e., LD), there are pools of ROS that are variably accessible to LA scavenging and hence more amenable to regulation. The most potent antioxidant form of LA, dihydrolipoic acid, is generated by the mt α-keto acid dehydrogenase complexes, suggesting that the mitochondria are key sites of action of LA in cells (24). Given the more significant impact of LA on LD cultures and the pivotal role of mitochondria in the generation of ROS (15, 25), we postulated that mt ROS might be critical regulators of density-dependent redox changes observed in neural precursor cells.
Analysis of LD cultures with XTT and mt probes confirmed that increased metabolic activity was associated with alterations in mt physiology and elevated ROS, but not with mt biogenesis (Fig. 4). What is not known, however, is how cells detect alterations in the microenvironment, such as changes in cell density, or how cells transmit these signals to elicit physiologic change at the mt level. Density-dependent changes in mt-specific proteins may be involved, and the regulation of MnSOD provides one direct mechanism for modulating the level of mt ROS to control proliferation in response to changes in cell density.
The dual nature of ROS and their impact upon the mitochondria may underlie many of the observed density-dependent changes. Although LD can promote proliferation, the high levels of ROS found at LD can also be damaging (e.g., aconitase degradation) and may also lead to changes that cause the persistent inhibition of growth observed in cells reseeded from LD cultures (Fig. 3). Although the precise cause of this effect is uncertain, heritable changes in the mitochondria caused by elevated ROS may provide one clue. Oxidative damage to the mt DNA could compromise the proliferative capacity of daughter cells derived from LD, and this suggests that the memory of past insult might be transmitted through damaged mitochondria.
It is also unclear why conditions of LD trigger a rise in mt ROS. One possibility would be an inadequate production of ATP due to a depletion of Krebs cycle substrates. This would cause LD cells to depend largely on glycolysis for the production of ATP. The resultant increase in ADP levels would promote increased electron transport and ultimately increased electron leakage and ROS production. Although the foregoing changes in metabolism are speculative, they may underlie our observed elevations in ROS at LD.
The regulation of ROS in cells is critical, especially given the potential of ROS to elicit such varied responses. Previous studies have shown a relationship among ROS and certain mitogenic factors (e.g., epidermal growth factor and FGF; ref. 15), but in our model, FGF2 had a smaller impact on ROS levels than did cell density. Although the addition of FGF2 could significantly reduce ROS levels at a given cell density (Fig. 4), once present, it did not account for the disparate ROS levels we observed at different cell densities.
Our in vitro studies are useful in providing potential mechanistic insight into how neural precursor cells respond to changes in ROS. However, cell culture conditions provide only some of the environmental cues that could influence precursor cell behavior in a complex 3D architecture. Because of this, we wanted to determine whether or how our in vitro redox findings related to changes observed in vivo. In the hippocampal SGZ, irradiation elicits a rapid and significant depletion of neural precursor cells (6), and this change is likely mediated through microenvironmental influences, including oxidative stress (13), inflammation (4–6), and cytokines (26). Because the rebound in precursor cell proliferation in the SGZ (Fig. 6A) is associated with elevated MDA (Fig. 6 B and D), it is possible that ROS contribute to the prostimulatory signals within the irradiated hippocampus. The ability to scavenge ROS through the antioxidant LA, reduce MDA levels, and also reduce proliferation in vivo (Fig. 6 A and B) provides further evidence for the multiple roles of oxidative species in cells. However, how neurogenesis might benefit from the reduced proliferation of neural precursors in the presence of an antioxidant is not clear. Although slowing growth through antioxidant use might promote the development of mature neurons from neural precursors recovering from DNA damage and related stress, only longer-term studies will determine whether such treatments can functionally rescue neurogenesis from the prolonged inhibition observed after irradiation.
Conclusion
The density, anchorage, and temporal dependence of ROS levels shown here suggest that neural precursor cells can fine tune their redox state to rapidly respond and adjust to changes in their environment. Similar behavior exhibited by neural precursor cells cultured at LD to those responding to the loss of cellularity in the dentate SGZ indicates that physiologically relevant endpoints, such as the CNS stress response, can be modeled successfully by surprisingly simple manipulations of cell culture conditions.
Acknowledgments
We thank Vahe Sarkissian and Shinji Otsuka for technical assistance. This work was supported by American Cancer Society Grant RPG-00-036-01 CNE and National Aeronautics and Space Administration Grant NAG2-1632 (to C.L.L.), National Institutes of Health Grant AG16633 and the Stanford Cancer Council (to T.-T.H.), and National Institutes of Health Grant R01 NS46051 and Department of Defense Grant DAMD17-01-1-0820 (to J.R.F.).
Author contributions: C.L.L. designed research; R.R., E.G., and S.M. performed research; C.L.L., R.R., T.-T.H., and J.R.F. analyzed data; and C.L.L. and J.R.F. wrote the paper.
Abbreviations: HD, high density; LD, low density; LA, α-lipoic acid; mt, mitochondrial; ROS, reactive oxygen species; SGZ, dentate subgranular zone; FACS, fluorescence-activated cell sorting; NAO, nonyl acridine orange; MnSOD, manganese superoxide dismutase; MDA, malondialdehyde; R123, rhodamine 123; FGF2, fibroblast growth factor 2.
References
- 1.Eriksson, P. S., Perfilieva, E., Bjork-Eriksson, T., Alborn, A. M., Nordborg, C., Peterson, D. A. & Gage, F. H. (1998) Nat. Med. 4, 1313–1317. [DOI] [PubMed] [Google Scholar]
- 2.van Praag, H., Schinder, A. F., Christie, B. R., Toni, N., Palmer, T. D. & Gage, F. H. (2002) Nature 415, 1030–1034. [DOI] [PMC free article] [PubMed] [Google Scholar]
- 3.Raber, J., Rola, R., LeFevour, A., Morhardt, D., Curley, J., Mizumatsu, S. & Fike, J. (2004) Radiat. Res. 162, 39–47. [DOI] [PubMed] [Google Scholar]
- 4.Rola, R., Raber, J., Rizk, A., Otsuka, S., VandenBerg, S., Morhardt, D. & Fike, J. (2004) Exp. Neurol. 188, 316–330. [DOI] [PubMed] [Google Scholar]
- 5.Monje, M. L., Mizumatsu, S., Fike, J. R. & Palmer, T. D. (2002) Nat. Med. 8, 955–962. [DOI] [PubMed] [Google Scholar]
- 6.Mizumatsu, S., Monje, M., Morhardt, D., Rola, R., Palmer, T. & Fike, J. (2003) Cancer Res. 63, 4021–4027. [PubMed] [Google Scholar]
- 7.Vallieres, L., Campbell, I. L., Gage, F. H. & Sawchenko, P. E. (2002) J. Neurosci. 22, 486–492. [DOI] [PMC free article] [PubMed] [Google Scholar]
- 8.Gould, E. & Tanapat, P. (1999) Biol. Psychiatry 46, 1472–1479. [DOI] [PubMed] [Google Scholar]
- 9.Smith, J., Ladi, E., Mayer-Proschel, M. & Noble, M. (2000) Proc. Natl. Acad. Sci. USA 97, 10032–10037. [DOI] [PMC free article] [PubMed] [Google Scholar]
- 10.Simonian, N. A. & Coyle, J. T. (1996) Annu. Rev. Pharmacol. Toxicol. 36, 83–106. [DOI] [PubMed] [Google Scholar]
- 11.Love, S. (1999) Brain Pathol. 9, 119–131. [DOI] [PMC free article] [PubMed] [Google Scholar]
- 12.Lewen, A., Matz, P. & Chan, P. H. (2000) J. Neurotrauma 17, 871–890. [DOI] [PubMed] [Google Scholar]
- 13.Limoli, C. L., Giedzinski, E., Rola, R., Otsuka, S., Palmer, T. D. & Fike, J. R. (2004) Radiat. Res. 161, 17–27. [DOI] [PubMed] [Google Scholar]
- 14.Dent, P., Yacoub, A., Contessa, J., Caron, R., Amorino, G., Valerie, K., Hagan, M. P., Grant, S. & Schmidt-Ullrich, R. (2003) Radiat. Res. 159, 283–300. [DOI] [PubMed] [Google Scholar]
- 15.Nemoto, S., Takeda, K., Yu, Z. X., Ferrans, V. J. & Finkel, T. (2000) Mol. Cell. Biol. 20, 7311–7318. [DOI] [PMC free article] [PubMed] [Google Scholar]
- 16.Noble, M., Smith, J., Power, J. & Mayer-Proschel, M. (2003) Ann. N.Y. Acad. Sci. 991, 251–271. [DOI] [PubMed] [Google Scholar]
- 17.Limoli, C., Giedzinski, E., Morgan, W., Swarts, S., Jones, G. & Hyun, W. (2003) Cancer Res. 63, 3107–3111. [PubMed] [Google Scholar]
- 18.Maftah, A., Petit, J. M., Ratinaud, M. H. & Julien, R. (1989) Biochem. Biophys. Res. Commun. 164, 185–190. [DOI] [PubMed] [Google Scholar]
- 19.Chen, L. B. (1988) Annu. Rev. Cell Biol. 4, 155–181. [DOI] [PubMed] [Google Scholar]
- 20.Dignam, J. D. (1990) Methods Enzymol. 182, 194–203. [DOI] [PubMed] [Google Scholar]
- 21.Kee, N., Sivalingam, S., Boonstra, R. & Wojtowicz, J. M. (2002) J. Neurosci. Methods 115, 97–105. [DOI] [PubMed] [Google Scholar]
- 22.Voet, D., Voet, J. G. & Pratt, C. W. (1999) in Fundamentals of Biochemistry (Wiley, New York), pp. 492–525.
- 23.Hausladen, A. & Fridovich, I. (1994) J. Biol. Chem. 269, 29405–29408. [PubMed] [Google Scholar]
- 24.Packer, L., Tritschler, H. J. & Wessel, K. (1997) Free Radic. Biol. Med. 22, 359–378. [DOI] [PubMed] [Google Scholar]
- 25.Boveris, A. & Cadenas, E. (1982) in Superoxide Dismutase, ed. Oberly, L. W. (CRC, Boca Raton, FL), pp. 15–30.
- 26.McBride, W. H. (1995) Int. J. Radiat. Oncol. Biol. Phys. 33, 233–234. [DOI] [PubMed] [Google Scholar]


