

Early Neolithic (~7700-year-old) genetic data from the Russian Far East implies a high level of genetic continuity in this region.
Keywords: ancient genetics, East Asia, neolithic, Russian Far East, human population genetics
Abstract
Ancient genomes have revolutionized our understanding of Holocene prehistory and, particularly, the Neolithic transition in western Eurasia. In contrast, East Asia has so far received little attention, despite representing a core region at which the Neolithic transition took place independently ~3 millennia after its onset in the Near East. We report genome-wide data from two hunter-gatherers from Devil’s Gate, an early Neolithic cave site (dated to ~7.7 thousand years ago) located in East Asia, on the border between Russia and Korea. Both of these individuals are genetically most similar to geographically close modern populations from the Amur Basin, all speaking Tungusic languages, and, in particular, to the Ulchi. The similarity to nearby modern populations and the low levels of additional genetic material in the Ulchi imply a high level of genetic continuity in this region during the Holocene, a pattern that markedly contrasts with that reported for Europe.
INTRODUCTION
Ancient genomes from western Asia have revealed a degree of genetic continuity between preagricultural hunter-gatherers and early farmers 12 to 8 thousand years ago (ka) (1, 2). In contrast, studies on southeast and central Europe indicate a major population replacement of Mesolithic hunter-gatherers by Neolithic farmers of a Near Eastern origin during the period 8.5 to 7 ka. This is then followed by a progressive “resurgence” of local hunter-gatherer lineages in some regions during the Middle/Late Neolithic and Eneolithic periods and a major contribution from the Asian Steppe later, ~5.5 ka, coinciding with the advent of the Bronze Age (3–5). Compared to western Eurasia, for which hundreds of partial ancient genomes have already been sequenced, East Asia has been largely neglected by ancient DNA studies to date, with the exception of the Siberian Arctic belt, which has received attention in the context of the colonization of the Americas (6, 7). However, East Asia represents an extremely interesting region as the shift to reliance on agriculture appears to have taken a different course from that in western Eurasia. In the latter region, pottery, farming, and animal husbandry were closely associated. In contrast, Early Neolithic societies in the Russian Far East, Japan, and Korea started to manufacture and use pottery and basketry 10.5 to 15 ka, but domesticated crops and livestock arrived several millennia later (8, 9). Because of the current lack of ancient genomes from East Asia, we do not know the extent to which this gradual Neolithic transition, which happened independently from the one taking place in western Eurasia, reflected actual migrations, as found in Europe, or the cultural diffusion associated with population continuity.
RESULTS
Samples, sequencing, and authenticity
To fill this gap in our knowledge about the Neolithic in East Asia, we sequenced to low coverage the genomes of five early Neolithic burials (DevilsGate1, 0.059-fold coverage; DevilsGate2, 0.023-fold coverage; and DevilsGate3, DevilsGate4, and DevilsGate5, <0.001-fold coverage) from a single occupational phase at Devil’s Gate (Chertovy Vorota) Cave in the Primorye Region, Russian Far East, close to the border with China and North Korea (see the Supplementary Materials). This site dates back to 9.4 to 7.2 ka, with the human remains dating to ~7.7 ka, and it includes some of the world’s earliest evidence of ancient textiles (10). The people inhabiting Devil’s Gate were hunter-fisher-gatherers with no evidence of farming; the fibers of wild plants were the main raw material for textile production (10). We focus our analysis on the two samples with the highest sequencing coverage, DevilsGate1 and DevilsGate2, both of which were female. The mitochondrial genome of the individual with higher coverage (DevilsGate1) could be assigned to haplogroup D4; this haplogroup is found in present-day populations in East Asia (11) and has also been found in Jomon skeletons in northern Japan (2). For the other individual (DevilsGate2), only membership to the M branch (to which D4 belongs) could be established. Contamination, estimated from the number of discordant calls in the mitochondrial DNA (mtDNA) sequence, was low {0.87% [95% confidence interval (CI), 0.28 to 2.37%] and 0.59% (95% CI, 0.03 to 3.753%)} on nonconsensus bases at haplogroup-defining positions for DevilsGate1 and DevilsGate2, respectively. Using schmutzi (12) on the higher-coverage genome, DevilsGate1 also gives low contamination levels [1% (95% CI, 0 to 2%); see the Supplementary Materials]. As a further check against the possible confounding effect of contamination, we made sure that our most important analyses [outgroup f3 scores and principal components analysis (PCA)] were qualitatively replicated using only reads showing evidence of postmortem damage (PMD score of at least 3) (13), although these latter results had a high level of noise due to the low coverage (0.005X for DevilsGate1 and 0.001X for DevilsGate2).
Relation to modern populations
We compared the individuals from Devil’s Gate to a large panel of modern-day Eurasians and to published ancient genomes (Fig. 1A) (4, 5, 14–17). On the basis of PCA (18) and an unsupervised clustering approach, ADMIXTURE (19), both individuals fall within the range of modern variability found in populations from the Amur Basin, the geographic region where Devil’s Gate is located (Fig. 1), and which is today inhabited by speakers from a single language family (Tungusic). This result contrasts with observations in western Eurasia, where, because of a number of major intervening migration waves, hunter-gatherers of a similar age fall outside modern genetic variation (3, 20). We further confirmed the affinity between Devil’s Gate and modern-day Amur Basin populations by using outgroup f3 statistics in the form f3(African; DevilsGate, X), which measures the amount of shared genetic drift between a Devil’s Gate individual and X, a modern or ancient population, since they diverged from an African outgroup. Modern populations that live in the same geographic region as Devil’s Gate have the highest genetic affinity to our ancient genomes (Fig. 2), with a progressive decline in affinity with increasing geographic distance (r2 = 0.756, F1,96 = 301, P < 0.001; Fig. 3), in agreement with neutral drift leading to a simple isolation-by-distance pattern. The Ulchi, traditionally fishermen who live geographically very close to Devil’s Gate and are the only Tungusic-speaking population from the Amur Basin sampled in Russia (all other Tungusic speakers in our panel are from China), are genetically the most similar population in our panel. Other populations that show high affinity to Devil’s Gate are the Oroqen and the Hezhen—both of whom, like the Ulchi, are Tungusic speakers from the Amur Basin—as well as modern Koreans and Japanese. Given their geographic distance from Devil’s Gate (Fig. 3), Amerindian populations are unusually genetically close to samples from this site, in agreement with their previously reported relationship to Siberian and other north Asian populations (7).
Fig. 1. Regional reference panel, PCA, and ADMIXTURE analysis.
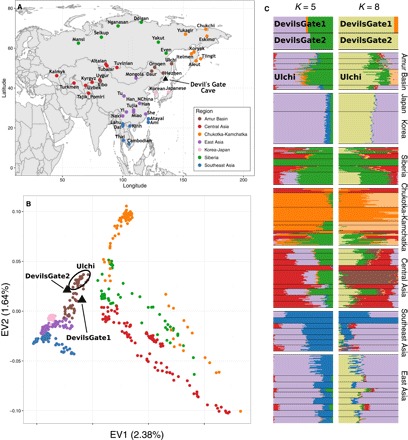
(A) Map of Asia showing the location of Devil’s Gate (black triangle) and of modern populations forming the regional panel of our analysis. (B) Plot of the first two principal components as defined by our regional panel of modern populations from East Asia and central Asia shown on (A), with the two samples from Devil’s Gate (black triangles) projected upon them (18). (C) ADMIXTURE analysis (19) performed on Devil’s Gate and our regional panel, for K = 5 (lowest cross-validation error) and K = 8 (appearance of Devil’s Gate–specific cluster).
Fig. 2. Outgroup f3 statistics.
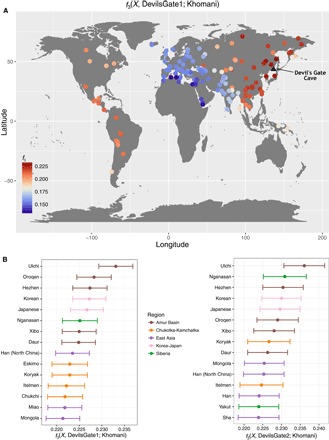
Outgroup f3 measuring shared drift between Devil’s Gate (black triangle shows sampling location) and modern populations with respect to an African outgroup (Khomani). (A) Map of the whole world. (B) Fifteen populations with the highest shared drift with Devil’s Gate, color-coded by regions as in Fig. 1. Error bars represent 1 SE.
Fig. 3. Spatial pattern of outgroup f3 statistics.
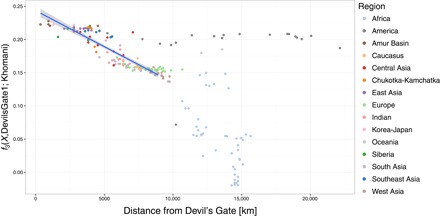
Relationship between outgroup f3(X, Devil’s Gate; Khomani) and distance on land from Devil’s Gate using DevilsGate1 and all single-nucleotide polymorphisms (SNPs). Populations up to 9000 km away from Devil’s Gate were considered when computing correlation. The highest distance considered was chosen to acquire the highest Pearson correlation in steps of 500 km. Best linear fit (r2 = 0.772, F1,108 = 368.4, P < 0.001) is shown as blue line, with 95% CI indicated by the shaded area.
Relation to ancient genomes from Asia
No previously published ancient genome shows marked genetic affinity to Devil’s Gate: The top 50 populations in our outgroup f3 statistic were all modern, an expected result given that all other ancient genomes are either geographically or temporally very distant from Devil’s Gate. Among these ancient genomes, the closest to Devil’s Gate are those from Steppe populations dating from the Bronze Age onward and Mesolithic hunter-gatherers from Europe, but these genomes are no closer to the Devil’s Gate genomes than to genomes of modern populations from the same regions (for example, Tuvinian, Kalmyk, Russian, or Finnish). The two ancient genomes geographically closest to Devil’s Gate, Ust’-Ishim (~45 ka) and Mal’ta (MA1, 24 ka), also do not show high genetic affinity, probably because they both date to a much earlier time period. Of the two, MA1 is genetically closer to Devil’s Gate, but it is equally as distant from Devil’s Gate as it is from all other East Asians (figs. S14 to S16). A similar pattern is found for Ust’-Ishim, which is equally as distant to all Asians, including Devil’s Gate; this is consistent with its basal position in a genealogical tree (figs. S17 to S19).
Continuity between Devil’s Gate and the Ulchi
Because Devil’s Gate falls within the range of modern human genetic variability in the Amur Basin in a number of analyses and shows a high genetic affinity to the Ulchi, we investigated the extent of genetic continuity in this region. To look for signals of additional genetic material in the Ulchi, we modeled them as a mixture of Devil’s Gate and other modern populations using admixture f3 statistics. Despite a large panel of possible modern sources, the Ulchi are best represented by Devil’s Gate alone without any further contribution (no admixture f3 gave a significant negative result; tables S3 and S4). Because admixture f3 can be affected by demographic events such as bottlenecks, we also tested whether Devil’s Gate formed a clade with the Ulchi using a D statistic in the form D(African outgroup, X; Ulchi, Devil’s Gate). A number of primarily modern populations worldwide gave significantly nonzero results (|z| > 2), which, together with the additional components for the Ulchi in the ADMIXTURE analysis, suggests that the continuity is not absolute. However, it should be noted that the higher error rates in the Devil’s Gate sequence resulting from DNA degradation and low coverage can also decrease the inferred level of continuity. To compare the level of continuity between the Ulchi and the inhabitants of Devil’s Gate to that between modern Europeans and European hunter-gatherers, we compared their ancestry proportions as inferred by ADMIXTURE. We found that the proportion of Devil’s Gate–related ancestry in the Ulchi was significantly higher than the local hunter-gatherer–related ancestry in any European population (P < 0.01 from 100 bootstrap replicates for the five European populations with the highest mean hunter-gatherer–related component).
These results suggest a relatively high degree of continuity in this region; the Ulchi are likely descendants of Devil’s Gate (or a population genetically very close to it), but the geographic and genetic connectivity among populations in the region means that this modern population also shows increased association with related modern populations. Compared to Europe, these results suggest a higher level of genetic continuity in northern East Asia over the last ~7.7 thousand years (ky), without any major population turnover since the early Neolithic.
Southern and northern genetic material in the Japanese and the Koreans
The close genetic affinity between Devil’s Gate and modern Japanese and Koreans, who live further south, is also of interest. It has been argued, based on both archaeological (21) and genetic analyses (22–25), that modern Japanese have a dual origin, descending from an admixture event between hunter-gatherers of the Jomon culture (16 to 3 ka) and migrants of the Yayoi culture (3 to 1.7 ka), who brought wet rice agriculture from the Yangtze estuary in southern China through Korea. The few ancient mtDNA samples available from Jomon sites on the northern Hokkaido island show an enrichment of particular haplotypes (N9b and M7a, with D1, D4, and G1 also detected) present in modern Japanese populations, particularly the Ainu and Ryukyuans, as well as southern Siberians (for example, Udegey and Ulchi) (26, 27). The mtDNA haplogroups of our samples from Devil’s Gate (D4 and M) are also present in Jomon samples, although they are not the most common ones (N9b and M7a). Recently, nuclear genetic data from two Jomon samples also confirmed the dual origin hypothesis and implied that the Jomon diverged before the diversification of present-day East Asians (28).
We investigated whether it was possible to recover the Northern and Southern genetic components by modeling modern Japanese as a mixture of all possible pairs of sources, including both modern Asian populations and Devil’s Gate, using admixture f3 statistics. The clearest signal was given by a combination of Devil’s Gate and modern-day populations from Taiwan, southern China, and Vietnam (Fig. 4), which could represent hunter-gatherer and agriculturalist components, respectively. However, it is important to note that these scores were just barely significant (−3 < z < −2) and that some modern pairs also gave negative scores, even if not reaching our significance threshold (z scores as low as −1.9; see the Supplementary Materials). The origin of Koreans has received less attention. Also, because of their location on the mainland, Koreans have likely experienced a greater degree of contact with neighboring populations throughout history. However, their genomes show similar characteristics to those of the Japanese on genome-wide SNP data (29) and have also been shown to harbor both northern and southern Asian mtDNA (30) and Y chromosomal haplogroups (30, 31). Unfortunately, our low coverage and small sample size from Devil’s Gate prevented a reliable estimate of admixture coefficients or use of linkage disequilibrium–based methods to investigate whether the components originated from secondary contact (admixture) or continuous differentiation and to date any admixture event that did occur.
Fig. 4. Admixture f3 statistics.
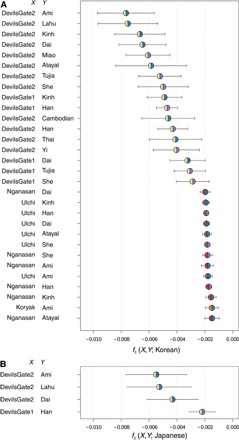
Admixture f3 representing modern Koreans and Japanese as a mixture of two populations, X and Y, color-coded by regions as in Fig. 1. (A) Thirty pairs with the lowest f3 score for the Koreans as the target, out of those giving a significant (z < −2) value. (B) All four pairs giving a significantly (z < −2) negative score for the Japanese as the target. Error bars represent 1 SE.
Phenotypes of interest
The low coverage of our sample does not allow for direct observation of most SNPs linked to phenotypic traits of interest, but imputation based on modern-day populations can provide some information. We focused on the genome with highest coverage, DevilsGate1, using the same imputation approach that has previously been used to estimate genotype probabilities (GPs) for ancient European samples (5, 16, 17). DevilsGate1 likely had brown eyes (rs12913832 on HERC2; GP, 0.905) and, where it could be determined, had pigmentation-associated variants that are common in East Asia (see section S11) (32). She appears to have at least one copy of the derived mutation on the EDAR gene, encoding the Ectodysplasin A receptor (rs3827760; GP, 0.865), which gives increased odds of straight, thick hair (33), as well as shovel-shaped incisors (34). She almost certainly lacked the most common Eurasian mutation for lactose tolerance (rs4988235, LCT gene; GP > 0.999) (35) and was unlikely to have suffered from alcohol flush (rs671, ALDH2 gene; GP, 0.847) (36). Thus, at least with regard to those phenotypic traits for which the genetic basis is known, there also seems to have been some degree of phenotypic continuity in this region for the last 7.7 ky.
DISCUSSION
By analyzing genome-wide data from two early Neolithic East Asians from Devil’s Gate, in the Russian Far East, we could demonstrate a high level of genetic continuity in the region over at least the last 7700 years. The cold climatic conditions in this area, where modern populations still rely on a number of hunter-gatherer-fisher practices, likely provide an explanation for the apparent continuity and lack of major genetic turnover by exogenous farming populations, as has been documented in the case of southeast and central Europe. Thus, it seems plausible that the local hunter-gatherers progressively added food-producing practices to their original lifestyle. However, it is interesting to note that in Europe, even at very high latitudes, where similar subsistence practices were still important until very recent times, the Neolithic expansion left a significant genetic signature, albeit attenuated in modern populations, compared to the southern part of the continent. Our ancient genomes thus provide evidence for a qualitatively different population history during the Neolithic transition in East Asia compared to western Eurasia, suggesting stronger genetic continuity in the former region. These results encourage further study of the East Asian Neolithic, which would greatly benefit from genetic data from early agriculturalists (ideally, from areas near the origin of wet rice cultivation in southern East Asia), as well as higher-coverage hunter-gatherer samples from different regions to quantify population structure before intensive agriculture.
MATERIALS AND METHODS
Experimental design
Sample preparation and sequencing
Molecular analyses were carried out in dedicated ancient DNA facilities at Trinity College Dublin, Ireland. Samples were prepared, and DNA was extracted using a silica column–based protocol following the methods of Gamba et al. (17), which were based on the study of Yang et al. (37). DNA extracted from both the first and second lysis buffers (17) was used for library preparation, which was carried out using a modified version of the protocol of Meyer and Kircher (38), as described by Gamba et al. (17). Libraries were sequenced on either an Illumina MiSeq or HiSeq platform (for further details and sequencing statistics, see Supplementary Materials and Methods).
Data processing and alignment
For single-end sequencing data, adapter sequences were trimmed from the ends of reads using cutadapt (39), allowing an overlap of only 1 base pair (bp) between the adapter and the read. For paired-end data, adapters were trimmed using leeHom (40). leeHom was run using the --ancientdna option, and paired-end reads that overlapped were merged. For paired-end reads that could not be overlapped, only data from read 1 were used in downstream analyses. Reads were aligned using the Burrows-Wheeler alignment tool (BWA) (41), with the seed region disabled, to the GRCh37 build of the human genome, with the mitochondrial sequence replaced by the revised Cambridge reference sequence (National Center for Biotechnology Information accession number NC_012920.1). Reads from different sequencing experiments were merged using Picard MergeSamFiles (http://picard.sourceforge.net/), and clonal reads were removed using SAMtools (42). A minimum read length of 30 bp was imposed, and for the higher-coverage (above 0.01X) samples, DevilsGate1 and DevilsGate2, indels were realigned using RealignerTargetCreator and IndelRealigner from the Genome Analysis Toolkit (GATK) (43). SAMtools (42) was used to filter out reads with a mapping quality of less than 30, and reads were rescaled using mapDamage 2.0 (44) to reduce the qualities of likely damaged bases, therefore lessening the effects of ancient DNA damage–associated errors on analysis (44). Average genomic depth of coverage was calculated using the genomecov function of bedtools (45).
Authenticity of results and contamination estimates
Patterns of molecular damage and the length distribution of reads were assessed using all reads for DevilsGate3, DevilsGate4, and DevilsGate5. Because a portion of the reads from DevilsGate1 and DevilsGate2 was derived from 50-bp single-end sequencing, only reads sequenced with 150-bp paired-end sequencing were considered in the following analyses to avoid using truncated reads (library ID MOS5A.E1 for DevilsGate1 and MOS4A.E1 for DevilsGate2). MapDamage 2.0 (44) was used to assess patterns of molecular damage, which are typical of ancient DNA. We replicated all results using our data without applying MapDamage to avoid biases from dropping true mutations that look like damage on our low-coverage data. For further details, see Supplementary Materials and Methods.
We assessed the rate of mitochondrial contamination for our highest-coverage samples, DevilsGate1 and DevilsGate2. This was calculated by evaluating the percentage of nonconsensus bases at haplogroup-defining positions (haplogroup D4 for DevilsGate1 and M for DevilsGate2) using bases with quality ≥20. We also used schmutzi, a tool that uses a Bayesian maximum a posteriori algorithm (12), to estimate the mitochondrial contamination for DevilsGate1. Last, we replicated the analyses that yielded the most robust results (outgroup f3 scores and PCA) using only reads showing evidence of postmortem damage (PMD score of at least 3) (13). For further details, see Supplementary Materials and Methods.
Statistical analysis
Mitochondrial haplogroup determination and molecular sex determination
Mitochondrial consensus sequences were generated for DevilsGate1 and DevilsGate2 using Analysis of Next Generation Sequencing Data (ANGSD) (46). Called positions were required to have a depth of coverage ≥3, and only bases with quality ≥20 were considered. The resulting FASTA files were uploaded to HAPLOFIND (47) for haplogroup determination, with coverage calculated using GATK DepthOfCoverage (43). Mutations defining the assigned haplogroup were also manually checked. Molecular sex was assigned using the script described in the study of Skoglund et al. (48). For further details, see Supplementary Materials and Methods.
SNP calling and merging with reference panel
To compare our sample to modern and ancient human genetic variation, we called SNPs using the hg19 reference FASTA file at positions overlapping with the Human Origins (HO) reference panel (591,356 positions) (49) using SAMtools 1.2 (42). Bases were required to have a minimum mapping quality of 30 and base quality of 20; all triallelic SNPs were discarded. Because our low coverage does not provide sufficient information to infer diploid genotypes, a base was chosen with probability proportional to its depth of coverage. This allele was duplicated to form a homozygous diploid genotype, which was used to represent the individual at that SNP position (48). This method of SNP calling (referred to as the proportional method from now on) will artificially increase the appearance of drift on the lineage leading to the ancient individual; however, this drift is not expected to be in any particular direction and, therefore, should not bias inferences about population relationships (3). A total of 35,903 positions in DevilsGate1 and 14,739 positions in DevilsGate2 were covered by at least one high-quality read.
The resulting SNP data for DevilsGate1 and DevilsGate2 were then merged with a reference panel containing modern genomes from the HO panel and selected ancient genomes [this data set was described by Jones et al. (5)] as well as an additional 45 Korean genomes from the Personal Genome Project Korea (http://opengenome.net/) using PLINK 1.07 (50). Additional sample information is available in extended data table S1, including sample IDs, populations, and groupings used throughout the article. Last, a transversion-only version of all the above data was created by converting all T’s to C’s and G’s to A’s. This alternative data set was used to confirm that potential biases originating from ancient DNA damage do not influence our conclusions.
In the later analyses (outgroup and admixture f3 statistics, PCA, and ADMIXTURE analysis), results using all mutations or only transversions were qualitatively similar, apart from increased noise in the transversion-only data due to the reduced information content. Thus, in the main text, we only report results using all mutations and the default calling method referred to as the proportional method (choosing a read uniformly at random from the reads covering any given position). We present results using the Khomani San as our African outgroup for outgroup f3 and D statistics, but other populations (the Yoruba, the Mbuti, and the Dinka) gave equivalent results. For further details, see Supplementary Materials and Methods.
Population genetic analysis
PCA was performed with two different reference panels (Fig. 1 and extended data table S1), both subsets of the worldwide panel of contemporary and ancient individuals from the study of Jones et al. (5). The analysis was carried out using EIGENSOFT 6.0.1 smartpca (18), with the lsqproject and normalization options on, the outlier removal option off, and one SNP from each pair in linkage disequilibrium with r2 > 0.2 removed. Ancient samples were projected onto the principal components defined by modern populations. For further details and results, see Supplementary Materials and Methods.
A clustering analysis was performed using ADMIXTURE version 1.23 (19). SNPs in linkage disequilibrium were thinned using PLINK 1.07 with parameters –indep-pairwise 200 25 0.5, resulting in a set of 334,359 SNPs for analysis (91,379 transversions). K = 2 to 20 clusters for the global panel and K = 2 to 10 clusters for the regional panel were explored using 10 independent runs, with fivefold cross-validation at each K with different random seeds. The minimal cross-validation error was found at K = 18 for the global panel and K = 5 for the regional (East Asia and central Asia) panel, but the error already started plateauing around K = 9 for the global panel, suggesting little improvement. Furthermore, results for the regional panel were largely similar to those from the global panel for East Asian populations. To compare population-level frequencies of the inferred ancestry components, we simultaneously performed bootstrapping on SNPs and individuals for each population, with 100 bootstrap estimates, using inferred ancestral components from our ADMIXTURE runs on all SNPs and MapDamage-treated samples from Devil’s Gate. We projected each bootstrap replicate on the ancestral components by numerically maximizing the corresponding likelihood function, following the logic in the study of Allentoft et al. (16) and Sikora et al. (51). For further details and results, see Supplementary Materials and Methods and extended data figs. S1 to S8.
D statistics (52) and f3 statistics (49, 53) were used to formally assess the relationships between the samples using the qpDstat (D statistics) and qp3PopTest (f3 statistics) programs from the ADMIXTOOLS package (49). Significance was assessed by these programs using a block jackknife over 5-centimorgan chunks of the genome, and statistics were considered significant if their z score was of magnitude greater than 2 or, for admixture f3 scores, if they were smaller than −2. These correspond approximately to P values of 0.046 and 0.023, respectively. For further details and results, see Supplementary Materials and Methods.
Phenotypes of interest
We investigated phenotypes of interest in our highest-coverage sample, DevilsGate1, including some loci known to have been under selection in Eurasian populations. Because of the low quality of our samples, we used BEAGLE (54) to impute genotypes using a reference panel containing phased genomes from the 1000 Genomes Project (26 different populations). Following the study of Gamba et al. (17), GATK UnifiedGenotyper (43) was used to call genotype likelihoods at SNP sites in phase 3 of the 1000 Genomes Project. Equal likelihoods were set for positions with no spanning sequence data and positions where the observed genotype could be explained by deamination (17). We imputed at least 1 Mb upstream and downstream from the loci of interest using 10 iterations to estimate genotypes at markers for which we had no direct genotype. For further details and results, see Supplementary Materials and Methods and extended data table S9.
Supplementary Material
Acknowledgments
Funding: V.S. was supported by the Gates Cambridge Trust. R.P. was funded by the European Research Council (ERC) starting grant ADNABIOARC (263441) and the Irish Research Council Advanced Research Project Grant from January 2014 to December 2016. M.H. was supported by ERC Consolidator Grant 310763 “GeneFlow.” This work was supported by the Research Fund (1.140113.01) of Ulsan National Institute of Science and Technology to J.B. This work was also supported by the Research Fund (14-BR-SS-03) of Civil-Military Technology Cooperation Program to J.B. and Y.S.C. M.G.-L. was supported by a Biotechnology and Biological Sciences Research Council Doctoral Training Partnerships studentship. A.M. and A.E. were supported by the ERC Consolidator Grant 647787 “LocalAdaptation.” D.G.B. was funded by ERC Investigator grant 295729-CodeX. Author contributions: E.V., T.B., and R.P. acquired the samples and provided the archaeological context; E.R.J., H.-M.K., Y.S.C., H.K., and K.L. performed experiments; V.S., E.R.J., S.J., Y.B., Y.S.C., M.G.-L., J.B., and A.M. analyzed genetic data; V.S., M.H., D.G.B., A.E., R.P., J.B., and A.M. wrote the manuscript with input from all coauthors. Competing interests: The authors declare that they have no competing interests. Data and materials availability: All data needed to evaluate the conclusions in the paper are present in the paper and/or the Supplementary Materials. Additional data related to this paper may be requested from the authors. Raw reads in FASTA format and aligned reads as bamfiles for all five ancient samples from Devil’s Gate are available from the European Nucleotide Archive accession code PRJEB14817.
SUPPLEMENTARY MATERIALS
Supplementary material for this article is available at http://advances.sciencemag.org/cgi/content/full/3/2/e1601877/DC1
Supplementary Materials and Methods
fig. S1. Calibrated age range of the two human specimens from Devil’s Gate (OxCal version 4.2.4).
fig. S2. Damage patterns for samples from Devil’s Gate.
fig. S3. Sequence length distribution for samples from Devil’s Gate.
fig. S4. Outgroup f3 statistics on PMDtools-filtered data.
fig. S5. PCA on all SNPs using the worldwide panel.
fig. S6. PCA on transversion SNPs using the worldwide panel.
fig. S7. PCA on all SNPs using the regional panel.
fig. S8. PCA on transversion SNPs using the regional panel.
fig. S9. ADMIXTURE analysis cross-validation (CV) error as a function of the number of clusters (K) for the regional panel using all SNPs (top row) or transversions only (bottom row) and with (left column) or without (right column) MapDamage treatment.
fig. S10. ADMIXTURE analysis CV error as a function of the number of clusters (K) for the world panel using all SNPs (top row) or transversions only (bottom row) and with (left column) or without (right column) MapDamage treatment.
fig. S11. Outgroup f3 scores of the form f3(X, MA1; Khomani), with modern populations and selected ancient samples (DevilsGate1, DevilsGate2, Ust’-Ishim, Kotias, Loschbour, and Stuttgart), using all SNPs, with f3 > 0.15 displayed.
fig. S12. D scores of the form D(X, Khomani; MA1, DevilsGate1), with all modern populations in our panel and selected ancient samples, using all SNPs.
fig. S13. D scores of the form D(X, Khomani; MA1, DevilsGate1), with all modern populations in our panel and selected ancient samples, using all SNPs.
fig. S14. Outgroup f3 scores of the form f3(X, Ust’-Ishim; Khomani), with modern populations and selected ancient samples (MA1, Kotias, Loschbour, and Stuttgart), using all SNPs, with f3 > 0.15 displayed.
fig. S15. D scores of the form D(X, Khomani; Ust’-Ishim, DevilsGate1), with all modern populations in our panel and selected ancient samples, using all SNPs.
fig. S16. D scores of the form D(X, Khomani; Ust’-Ishim, DevilsGate2), with all modern populations in our panel and selected ancient samples, using all SNPs.
fig. S17. Comparison of Devil’s Gate–related ancestry in the Ulchi and European hunter-gatherer–related ancestry in European populations.
fig. S18. Comparison of Devil’s Gate–related ancestry in the Ulchi and Early European farmer–related ancestry in European populations.
fig. S19. Comparison of Devil’s Gate–related ancestry in the Ulchi and Bronze Age Steppe–related ancestry in European populations.
table S1. Details of sample preparation and sequencing.
table S2. mtDNA contamination estimates.
table S3. Admixture f3(Source1, Source2; Target) for the Ulchi with z < −1 using all SNPs.
table S4. Admixture f3(Source1, Source2; Target) for the Ulchi with z < −1 using only transversion SNPs.
table S5. Admixture f3(Source1, Source2; Target) for the Sardinians using all SNPs and showing the 10 most significantly negative pairs.
table S6. Admixture f3(Source1, Source2; Target) for the Lithuanians using all SNPs and showing the 10 most significantly negative pairs.
extended data fig. S1. Results from ADMIXTURE analysis using the regional panel, all SNPs, and MapDamage treatment on samples from Devil’s Gate and setting the number of clusters to K = 2 to 10.
extended data fig. S2. Results from ADMIXTURE analysis using the regional panel, transversion SNPs, and MapDamage treatment on samples from Devil’s Gate and setting the number of clusters to K = 2 to 10.
extended data fig. S3. Results from ADMIXTURE analysis using the regional panel, all SNPs, and no MapDamage treatment on samples from Devil’s Gate and setting the number of clusters to K = 2 to 10.
extended data fig. S4. Results from ADMIXTURE analysis using the regional panel, transversion SNPs, and no MapDamage treatment on samples from Devil’s Gate and setting the number of clusters to K = 2 to 10.
extended data fig. S5. Results from ADMIXTURE analysis using the total panel, all SNPs, and MapDamage treatment on samples from Devil’s Gate and setting the number of clusters to K = 2 to 20.
extended data fig. S6. Results from ADMIXTURE analysis using the total panel, transversion SNPs, and MapDamage treatment on samples from Devil’s Gate and setting the number of clusters to K = 2 to 20.
extended data fig. S7. Results from ADMIXTURE analysis using the total panel, all SNPs, and no MapDamage treatment on samples from Devil’s Gate and setting the number of clusters to K = 2 to 20.
extended data fig. S8. Results from ADMIXTURE analysis using the total panel, transversion SNPs, and no MapDamage treatment on samples from Devil’s Gate and setting the number of clusters to K = 2 to 20.
extended data table S1. Sample information.
extended data table S2. ADMIXTURE proportions.
extended data table S3. Outgroup f3 statistics for Devil’s Gate.
extended data table S4. Outgroup f3 and space.
extended data table S5. Outgroup f3 for MA1 and Ust’-Ishim.
extended data table S6. D scores for MA1 and Ust’-Ishim.
extended data table S7. D scores for the Ulchi.
extended data table S8. Admixture f3 for the Koreans and the Japanese.
extended data table S9. Phenotypes of interest.
REFERENCES AND NOTES
- 1.Lazaridis I., Nadel D., Rollefson G., Merrett D. C., Rohland N., Mallick S., Fernandes D., Novak M., Gamarra B., Sirak K., Connell S., Stewardson K., Harney E., Fu Q., Gonzalez-Fortes G., Jones E. R., Alpaslan Roodenberg S., Lengyel G., Bocquentin F., Gasparian B., Monge J. M., Gregg M., Eshed V., Mizrahi A.-S., Meiklejohn C., Gerritsen F., Bejenaru L., Blüher M., Campbell A., Cavalleri G., Comas D., Froguel P., Gilbert E., Kerr S. M., Kovacs P., Krause J., McGettigan D., Merrigan M., Andrew Merriwether D., O’Reilly S., Richards M. B., Semino O., Shamoon-Pour M., Stefanescu G., Stumvoll M., Tönjes A., Torroni A., Wilson J. F., Yengo L., Hovhannisyan N. A., Patterson N., Pinhasi R., Reich D., Genomic insights into the origin of farming in the ancient Near East. Nature 536, 419–424 (2016). [DOI] [PMC free article] [PubMed] [Google Scholar]
- 2.Gallego-Llorente M., Connell S., Jones E. R., Merrett D. C., Jeon Y., Eriksson A., Siska V., Gamba C., Meiklejohn C., Beyer R., Jeon S., Cho Y. S., Hofreiter M., Bhak J., Manica A., Pinhasi R., The genetics of an early Neolithic pastoralist from the Zagros, Iran. Sci. Rep. 6, 31326 (2016). [DOI] [PMC free article] [PubMed] [Google Scholar]
- 3.Lazaridis I., Patterson N., Mittnik A., Renaud G., Mallick S., Kirsanow K., Sudmant P. H., Schraiber J. G., Castellano S., Lipson M., Berger B., Economou C., Bollongino R., Fu Q., Bos K. I., Nordenfelt S., Li H., de Filippo C., Prüfer K., Sawyer S., Posth C., Haak W., Hallgren F., Fornander E., Rohland N., Delsate D., Francken M., Guinet J.-M., Wahl J., Ayodo G., Babiker H. A., Bailliet G., Balanovska E., Balanovsky O., Barrantes R., Bedoya G., Ben-Ami H., Bene J., Berrada F., Bravi C. M., Brisighelli F., Busby G. B. J., Cali F., Churnosov M., Cole D. E. C., Corach D., Damba L., van Driem G., Dryomov S., Dugoujon J.-M., Fedorova S. A., Gallego Romero I., Gubina M., Hammer M., Henn B. M., Hervig T., Hodoglugil U., Jha A. R., Karachanak-Yankova S., Khusainova R., Khusnutdinova E., Kittles R., Kivisild T., Klitz W., Kučinskas V., Kushniarevich A., Laredj L., Litvinov S., Loukidis T., Mahley R. W., Melegh B., Metspalu E., Molina J., Mountain J., Näkkäläjärvi K., Nesheva D., Nyambo T., Osipova L., Parik J., Platonov F., Posukh O., Romano V., Rothhammer F., Rudan I., Ruizbakiev R., Sahakyan H., Sajantila A., Salas A., Starikovskaya E. B., Tarekegn A., Toncheva D., Turdikulova S., Uktveryte I., Utevska O., Vasquez R., Villena M., Voevoda M., Winkler C. A., Yepiskoposyan L., Zalloua P., Zemunik T., Cooper A., Capelli C., Thomas M. G., Ruiz-Linares A., Tishkoff S. A., Singh L., Thangaraj K., Villems R., Comas D., Sukernik R., Metspalu M., Meyer M., Eichler E. E., Burger J., Slatkin M., Pääbo S., Kelso J., Reich D., Krause J., Ancient human genomes suggest three ancestral populations for present-day Europeans. Nature 513, 409–413 (2014). [DOI] [PMC free article] [PubMed] [Google Scholar]
- 4.Haak W., Lazaridis I., Patterson N., Rohland N., Mallick S., Llamas B., Brandt G., Nordenfelt S., Harney E., Stewardson K., Fu Q., Mittnik A., Bánffy E., Economou C., Francken M., Friederich S., Garrido Pena R., Hallgren F., Khartanovich V., Khokhlov A., Kunst M., Kuznetsov P., Meller H., Mochalov O., Moiseyev V., Nicklisch N., Pichler S. L., Risch R., Rojo Guerra M. A., Roth C., Szécsényi-Nagy A., Wahl J., Meyer M., Krause J., Brown D., Anthony D., Cooper A., Werner Alt K., Reich D., Massive migration from the steppe was a source for Indo-European languages in Europe. Nature 522, 207–211 (2015). [DOI] [PMC free article] [PubMed] [Google Scholar]
- 5.Jones E. R., Gonzalez-Fortes G., Connell S., Siska V., Eriksson A., Martiniano R., McLaughlin R. L., Gallego Llorente M., Cassidy L. M., Gamba C., Meshveliani T., Bar-Yosef O., Müller W., Belfer-Cohen A., Matskevich Z., Jakeli N., Higham T. F. G., Currat M., Lordkipanidze D., Hofreiter M., Manica A., Pinhasi R., Bradley D. G., Upper Palaeolithic genomes reveal deep roots of modern Eurasians. Nat. Commun. 6, 8912 (2015). [DOI] [PMC free article] [PubMed] [Google Scholar]
- 6.Raghavan M., DeGiorgio M., Albrechtsen A., Moltke I., Skoglund P., Korneliussen T. S., Grønnow B., Appelt M., Christian Gulløv H., Max Friesen T., Fitzhugh W., Malmström H., Rasmussen S., Olsen J., Melchior L., Fuller B. T., Fahrni S. M., Stafford T. Jr, Grimes V., Renouf M. A. P., Cybulski J., Lynnerup N., Lahr M. M., Britton K., Knecht R., Arneborg J., Metspalu M., Cornejo O. E., Malaspinas A.-S., Wang Y., Rasmussen M., Raghavan V., Hansen T. V. O., Khusnutdinova E., Pierre T., Dneprovsky K., Andreasen C., Lange H., Hayes M. G., Coltrain J., Spitsyn V. A., Götherström A., Orlando L., Kivisild T., Villems R., Crawford M. H., Nielsen F. C., Dissing J., Heinemeier J., Meldgaard M., Bustamante C., O’Rourke D. H., Jakobsson M., Gilbert M. T. P., Nielsen R., Willerslev E., The genetic prehistory of the New World Arctic. Science 345, 1255832 (2014). [DOI] [PubMed] [Google Scholar]
- 7.Raghavan M., Steinrücken M., Harris K., Schiffels S., Rasmussen S., DeGiorgio M., Albrechtsen A., Valdiosera C., Ávila-Arcos M. C., Malaspinas A.-S., Eriksson A., Moltke I., Metspalu M., Homburger J. R., Wall J., Cornejo O. E., Víctor Moreno-Mayar J., Korneliussen T. S., Pierre T., Rasmussen M., Campos P. F., de Barros Damgaard P., Allentoft M. E., Lindo J., Metspalu E., Rodríguez-Varela R., Mansilla J., Henrickson C., Seguin-Orlando A., Malmström H., Stafford T. Jr, Shringarpure S. S., Moreno-Estrada A., Karmin M., Tambets K., Bergström A., Xue Y., Warmuth V., Friend A. D., Singarayer J., Valdes P., Balloux F., Leboreiro I., Vera J. L., Rangel-Villalobos H., Pettener D., Luiselli D., Davis L. G., Heyer E., Zollikofer C. P. E., Ponce de León M. S., Smith C. I., Grimes V., Pike K.-A., Deal M., Fuller B. T., Arriaza B., Standen V., Luz M. F., Ricaut F., Guidon N., Osipova L., Voevoda M. I., Posukh O. L., Balanovsky O., Lavryashina M., Bogunov Y., Khusnutdinova E., Gubina M., Balanovska E., Fedorova S., Litvinov S., Malyarchuk B., Derenko M., Mosher M. J., Archer D., Cybulski J., Petzelt B., Mitchell J., Worl R., Norman P. J., Parham P., Kemp B. M., Kivisild T., Tyler-Smith C., Sandhu M. S., Crawford M., Villems R., Smith D. G., Waters M. R., Goebel T., Johnson J. R., Malhi R. S., Jakobsson M., Meltzer D. J., Manica A., Durbin R., Bustamante C. D., Song Y. S., Nielsen R., Willerslev E., Genomic evidence for the Pleistocene and recent population history of native Americans. Science 349, aab3884 (2015). [DOI] [PMC free article] [PubMed] [Google Scholar]
- 8.Kuzmin Y., The Paleolithic-to-Neolithic transition and the origin of pottery production in the Russian Far East: A geoarchaeological approach. Archaeol. Ethnol. Anthropol. Eurasia 4, 16–26 (2003). [Google Scholar]
- 9.Z. Chi, H. Hsiao-chun, The Encyclopedia of Global Human Migration (Blackwell Publishing Ltd., 2013). [Google Scholar]
- 10.Kuzmin Y. V., Keally C. T., Jull A. J. T., Burr G. S., Klyuev N. A., The earliest surviving textiles in East Asia from Chertovy Vorota Cave, Primorye province, Russian Far East. Antiquity 86, 325–337 (2012). [Google Scholar]
- 11.Tanaka M., Cabrera V. M., González A. M., Larruga J. M., Takeyasu T., Fuku N., Guo L.-J., Hirose R., Fujita Y., Kurata M., Shinoda K.-i., Umetsu K., Yamada Y., Oshida Y., Sato Y., Hattori N., Mizuno Y., Arai Y., Hirose N., Ohta S., Ogawa O., Tanaka Y., Kawamori R., Shamoto-Nagai M., Maruyama W., Shimokata H., Suzuki R., Shimodaira H., Mitochondrial genome variation in eastern Asia and the peopling of Japan. Genome Res. 14, 1832–1850 (2004). [DOI] [PMC free article] [PubMed] [Google Scholar]
- 12.Renaud G., Slon V., Duggan A. T., Kelso J., Schmutzi: Estimation of contamination and endogenous mitochondrial consensus calling for ancient DNA. Genome Biol. 16, 224 (2015). [DOI] [PMC free article] [PubMed] [Google Scholar]
- 13.Skoglund P., Northoff B. H., Shunkov M. V., Derevianko A. P., Pääbo S., Krause J., Jakobsson M., Separating endogenous ancient DNA from modern day contamination in a Siberian Neandertal. Proc. Natl. Acad. Sci. U.S.A. 111, 2229–2234 (2014). [DOI] [PMC free article] [PubMed] [Google Scholar]
- 14.Fu Q., Li H., Moorjani P., Jay F., Slepchenko S. M., Bondarev A. A., Johnson P. L. F., Aximu-Petri A., Prüfer K., de Filippo C., Meyer M., Zwyns N., Salazar-García D. C., Kuzmin Y. V., Keates S. G., Kosintsev P. A., Razhev D. I., Richards M. P., Peristov N. V., Lachmann M., Douka K., Higham T. F. G., Slatkin M., Hublin J.-J., Reich D., Kelso J., Bence Viola T., Pääbo S., Genome sequence of a 45,000-year-old modern human from western Siberia. Nature 514, 445–449 (2014). [DOI] [PMC free article] [PubMed] [Google Scholar]
- 15.Raghavan M., Skoglund P., Graf K. E., Metspalu M., Albrechtsen A., Moltke I., Rasmussen S., Stafford T. W. Jr, Orlando L., Metspalu E., Karmin M., Tambets K., Rootsi S., Mägi R., Campos P. F., Balanovska E., Balanovsky O., Khusnutdinova E., Litvinov S., Osipova L. P., Fedorova S. A., Voevoda M. I., DeGiorgio M., Sicheritz-Ponten T., Brunak S., Demeshchenko S., Kivisild T., Villems R., Nielsen R., Jakobsson M., Willerslev E., Upper Palaeolithic Siberian genome reveals dual ancestry of Native Americans. Nature 505, 87–91 (2014). [DOI] [PMC free article] [PubMed] [Google Scholar]
- 16.Allentoft M. E., Sikora M., Sjögren K.-G., Rasmussen S., Rasmussen M., Stenderup J., Damgaard P. B., Schroeder H., Ahlström T., Vinner L., Malaspinas A.-S., Margaryan A., Higham T., Chivall D., Lynnerup N., Harvig L., Baron J., Della Casa P., Dąbrowski P., Duffy P. R., Ebel A. V., Epimakhov A., Frei K., Furmanek M., Gralak T., Gromov A., Gronkiewicz S., Grupe G., Hajdu T., Jarysz R., Khartanovich V., Khokhlov A., Kiss V., Kolář J., Kriiska A., Lasak I., Longhi C., McGlynn G., Merkevicius A., Merkyte I., Metspalu M., Mkrtchyan R., Moiseyev V., Paja L., Pálfi G., Pokutta D., Pospieszny Ł., Douglas Price T., Saag L., Sablin M., Shishlina N., Smrčka V., Soenov V. I., Szeverényi V., Tóth G., Trifanova S. V., Varul L., Vicze M., Yepiskoposyan L., Zhitenev V., Orlando L., Sicheritz-Pontén T., Brunak S., Nielsen R., Kristiansen K., Willerslev E., Population genomics of Bronze Age Eurasia. Nature 522, 167–172 (2015). [DOI] [PubMed] [Google Scholar]
- 17.Gamba C., Jones E. R., Teasdale M. D., McLaughlin R. L., Gonzalez-Fortes G., Mattiangeli V., Domboróczki L., Kővári I., Pap I., Anders A., Whittle A., Dani J., Raczky P., Higham T. F. G., Hofreiter M., Bradley D. G., Pinhasi R., Genome flux and stasis in a five millennium transect of European prehistory. Nat. Commun. 5, 5257 (2014). [DOI] [PMC free article] [PubMed] [Google Scholar]
- 18.Patterson N., Price A. L., Reich D., Population structure and eigenanalysis. PLOS Genet. 2, e190 (2006). [DOI] [PMC free article] [PubMed] [Google Scholar]
- 19.Alexander D. H., Novembre J., Lange K., Fast model-based estimation of ancestry in unrelated individuals. Genome Res. 9, 1655–1664 (2009). [DOI] [PMC free article] [PubMed] [Google Scholar]
- 20.Sánchez-Quinto F., Schroeder H., Ramirez O., Ávila-Arcos M. C., Pybus M., Olalde I., Velazquez A. M. V., Marcos M. E. P., Encinas J. M. V., Bertranpetit J., Orlando L., Gilbert M. T. P., Lalueza-Fox C., Genomic affinities of two 7,000-year-old Iberian hunter-gatherers. Curr. Biol. 22, 1494–1499 (2012). [DOI] [PubMed] [Google Scholar]
- 21.K. Imamura, Prehistoric Japan: New Perspectives on Insular East Asia (Univ. Hawaii Press, 1996). [Google Scholar]
- 22.Jinam T. A., Kanzawa-Kiriyama H., Saitou N., Human genetic diversity in the Japanese Archipelago: Dual structure and beyond. Genes Genet. Syst. 90, 147–152 (2015). [DOI] [PubMed] [Google Scholar]
- 23.Rasteiro R., Chikhi L., Revisiting the peopling of Japan: An admixture perspective. J. Hum. Genet. 54, 349–354 (2009). [DOI] [PubMed] [Google Scholar]
- 24.He Y., Wang W. R., Xu S., Jin L.; Pan-Asia SNP Consortium, Paleolithic contingent in modern Japanese: Estimation and inference using genome-wide data. Sci. Rep. 2, 355 (2012). [DOI] [PMC free article] [PubMed] [Google Scholar]
- 25.Jinam T. A., Kanzawa-Kiriyama H., Inoue I., Tokunaga K., Omoto K., Saitou N., Unique characteristics of the Ainu population in Northern Japan. J. Hum. Genet. 60, 565–571 (2015). [DOI] [PubMed] [Google Scholar]
- 26.Adachi N., Shinoda K.-i., Umetsu K., Matsumura H., Mitochondrial DNA analysis of Jomon skeletons from the Funadomari site, Hokkaido, and its implication for the origins of Native American. Am. J. Phys. Anthropol. 138, 255–265 (2009). [DOI] [PubMed] [Google Scholar]
- 27.Adachi N., Shinoda K.-i., Umetsu K., Kitano T., Matsumura H., Fujiyama R., Sawada J., Tanaka M., Mitochondrial DNA analysis of Hokkaido Jomon skeletons: Remnants of archaic maternal lineages at the southwestern edge of former Beringia. Am. J. Phys. Anthropol. 146, 346–360 (2011). [DOI] [PubMed] [Google Scholar]
- 28.Kanzawa-Kiriyama H., Kryukov K., Jinam T. A., Hosomichi K., Saso A., Suwa G., Ueda S., Yoneda M., Tajima A., Shinoda K.-i., Inoue I., Saitou N., A partial nuclear genome of the Jomons who lived 3000 years ago in Fukushima, Japan. J. Hum. Genet. 10.1038/jhg.2016.110 (2016). [DOI] [PMC free article] [PubMed] [Google Scholar]
- 29.HUGO Pan-Asian SNP Consortium, Mapping human genetic diversity in Asia. Science 326, 1541–1545 (2009). [DOI] [PubMed] [Google Scholar]
- 30.Jin H.-J., Tyler-Smith C., Kim W., The peopling of Korea revealed by analyses of mitochondrial DNA and Y-chromosomal markers. PLOS ONE 4, e4210 (2009). [DOI] [PMC free article] [PubMed] [Google Scholar]
- 31.Jin H.-J., Kwak K.-D., Hammer M. F., Nakahori Y., Shinka T., Lee J.-W., Jin F., Jia X., Tyler-Smith C., Kim W., Y-chromosomal DNA haplogroups and their implications for the dual origins of the Koreans. Hum. Genet. 114, 27–35 (2003). [DOI] [PubMed] [Google Scholar]
- 32.Sturm R. A., Duffy D. L., Human pigmentation genes under environmental selection. Genome Biol. 13, 248 (2012). [DOI] [PMC free article] [PubMed] [Google Scholar]
- 33.Fujimoto A., Kimura R., Ohashi J., Omi K., Yuliwulandari R., Batubara L., Mustofa M. S., Samakkarn U., Settheetham-Ishida W., Ishida T., Morishita Y., Furusawa T., Nakazawa M., Ohtsuka R., Tokunaga K., A scan for genetic determinants of human hair morphology: EDAR is associated with Asian hair thickness. Hum. Mol. Genet. 17, 835–843 (2008). [DOI] [PubMed] [Google Scholar]
- 34.Park J.-H., Yamaguchi T., Watanabe C., Kawaguchi A., Haneji K., Takeda M., Kim Y.-I., Tomoyasu Y., Watanabe M., Oota H., Hanihara T., Ishida H., Maki K., Park S.-B., Kimura R., Effects of an Asian-specific nonsynonymous EDAR variant on multiple dental traits. J. Hum. Genet. 57, 508–514 (2012). [DOI] [PubMed] [Google Scholar]
- 35.Itan Y., Powell A., Beaumont M. A., Burger J., Thomas M. G., The origins of lactase persistence in Europe. PLOS Comput. Biol. 5, e1000491 (2009). [DOI] [PMC free article] [PubMed] [Google Scholar]
- 36.Crabb D. W., Edenberg H. J., Bosron W. F., Li T. K., Genotypes for aldehyde dehydrogenase deficiency and alcohol sensitivity. The inactive ALDH22 allele is dominant. J. Clin. Invest. 83, 314–316 (1989). [DOI] [PMC free article] [PubMed] [Google Scholar]
- 37.Yang D. Y., Eng B., Waye J. S., Dudar J. C., Saunders S. R., Improved DNA extraction from ancient bones using silica-based spin columns. Am. J. Phys. Anthropol. 105, 539–543 (1998). [DOI] [PubMed] [Google Scholar]
- 38.Meyer M., Kircher M., Illumina sequencing library preparation for highly multiplexed target capture and sequencing. Cold Spring Harb. Protoc. 2010, pdb.prot5448 (2010). [DOI] [PubMed] [Google Scholar]
- 39.Martin M., Cutadapt removes adapter sequences from high-throughput sequencing reads. EMBnet.journal 17, 10–12 (2011). [Google Scholar]
- 40.Renaud G., Stenzel U., Kelso J., leeHom: Adaptor trimming and merging for Illumina sequencing reads. Nucleic Acids Res. 42, e141 (2014). [DOI] [PMC free article] [PubMed] [Google Scholar]
- 41.Li H., Durbin R., Fast and accurate short read alignment with Burrows-Wheeler transform. Bioinformatics 25, 1754–1760 (2009). [DOI] [PMC free article] [PubMed] [Google Scholar]
- 42.Li H., Handsaker B., Wysoker A., Fennell T., Ruan J., Homer N., Marth G., Abecasis G., Durbin R.; 1000 Genome Project Data, The sequence alignment/map format and SAMtools. Bioinformatics 25, 2078–2079 (2009). [DOI] [PMC free article] [PubMed] [Google Scholar]
- 43.McKenna A., Hanna M., Banks E., Sivachenko A., Cibulskis K., Kernytsky A., Garimella K., Altshuler D., Gabriel S., Daly M., DePristo M. A., The genome analysis toolkit: A MapReduce framework for analyzing next-generation DNA sequencing data. Genome Res. 20, 1297–1303 (2010). [DOI] [PMC free article] [PubMed] [Google Scholar]
- 44.Jónsson H., Ginolhac A., Schubert M., Johnson P. L. F., Orlando L., mapDamage2.0: Fast approximate Bayesian estimates of ancient DNA damage parameters. Bioinformatics 29, 1682–1684 (2013). [DOI] [PMC free article] [PubMed] [Google Scholar]
- 45.Quinlan A. R., Hall I. M., BEDTools: A flexible suite of utilities for comparing genomic features. Bioinformatics 26, 841–842 (2010). [DOI] [PMC free article] [PubMed] [Google Scholar]
- 46.Korneliussen T. S., Albrechtsen A., Nielsen R., ANGSD: Analysis of next generation sequencing data. BMC Bioinformatics 15, 356 (2014). [DOI] [PMC free article] [PubMed] [Google Scholar]
- 47.Vianello D., Sevini F., Castellani G., Lomartire L., Capri M., Franceschi C., HAPLOFIND: A new method for high-throughput mtDNA haplogroup assignment. Hum. Mutat. 34, 1189–1194 (2013). [DOI] [PubMed] [Google Scholar]
- 48.Skoglund P., Malmström H., Omrak A., Raghavan M., Valdiosera C., Günther T., Hall P., Tambets K., Parik J., Sjögren K.-G., Apel J., Willerslev E., Storå J., Götherström A., Jakobsson M., Genomic diversity and admixture differs for stone-age Scandinavian foragers and farmers. Science 344, 747–750 (2014). [DOI] [PubMed] [Google Scholar]
- 49.Patterson N., Moorjani P., Luo Y., Mallick S., Rohland N., Zhan Y., Genschoreck T., Webster T., Reich D., Ancient admixture in human history. Genetics 192, 1065–1093 (2012). [DOI] [PMC free article] [PubMed] [Google Scholar]
- 50.Purcell S., Neale B., Todd-Brown K., Thomas L., Ferreira M. A. R., Bender D., Maller J., Sklar P., de Bakker P. I. W., Daly M. J., Sham P. C., PLINK: A tool set for whole-genome association and population-based linkage analyses. Am. J. Hum. Genet. 81, 559–575 (2007). [DOI] [PMC free article] [PubMed] [Google Scholar]
- 51.Sikora M., Carpenter M. L., Moreno-Estrada A., Henn B. M., Underhill P. A., Sánchez-Quinto F., Zara I., Pitzalis M., Sidore C., Busonero F., Maschio A., Angius A., Jones C., Mendoza-Revilla J., Nekhrizov G., Dimitrova D., Theodossiev N., Harkins T. T., Keller A., Maixner F., Zink A., Abecasis G., Sanna S., Cucca F., Bustamante C. D., Population genomic analysis of ancient and modern genomes yields new insights into the genetic ancestry of the Tyrolean iceman and the genetic structure of Europe. PLOS Genet. 10, e1004353 (2014). [DOI] [PMC free article] [PubMed] [Google Scholar]
- 52.Green R. E., Krause J., Briggs A. W., Maricic T., Stenzel U., Kircher M., Patterson N., Li H., Zhai W., Fritz M. H.-Y., Hansen N. F., Durand E. Y., Malaspinas A.-S., Jensen J. D., Marques-Bonet T., Alkan C., Prüfer K., Meyer M., Burbano H. A., Good J. M., Schultz R., Aximu-Petri A., Butthof A., Höber B., Höffner B., Siegemund M., Weihmann A., Nusbaum C., Lander E. S., Russ C., Novod N., Affourtit J., Egholm M., Verna C., Rudan P., Brajkovic D., Kucan Ž., Gušic I., Doronichev V. B., Golovanova L. V., Lalueza-Fox C., de la Rasilla M., Fortea J., Rosas A., Schmitz R. W., Johnson P. L. F., Eichler E. E., Falush D., Birney E., Mullikin J. C., Slatkin M., Nielsen R., Kelso J., Lachmann M., Reich D., Pääbo S., A draft sequence of the Neandertal genome. Science 328, 710–722 (2010). [DOI] [PMC free article] [PubMed] [Google Scholar]
- 53.Reich D., Thangaraj K., Patterson N., Price A. L., Singh L., Reconstructing Indian population history. Nature 461, 489–494 (2009). [DOI] [PMC free article] [PubMed] [Google Scholar]
- 54.Browning B. L., Browning S. R., Genotype imputation with millions of reference samples. Am. J. Hum. Genet. 98, 116–126 (2016). [DOI] [PMC free article] [PubMed] [Google Scholar]
- 55.Andreeva Z. V., Tatarnikov V., Peshera “Chertovy Vorota v Primor’e”. Arheol. Otkrytiya 1973 Goda Cave Devils Gate Primorye 1973 Excav. Seas. Mosc., 180–181 (1974). [Google Scholar]
- 56.I. S. Zhushchikhovskaya, Archaeology of the Russian Far East: Essays in Stone Age Prehistory, S. M. Nelson, A. P. Derevianko, Y. V. Kuzmin, R. L. Bland, Eds. (Archaeopress, 2006), pp. 101–122. [Google Scholar]
- 57.Kuznecov A., The ancient settlement in a cave Devil’s Gate and some problems of the Neolithic of Primorye. Ross. Arheol. 2, 17–19 (2002). [Google Scholar]
- 58.Balueva T. S., Cranial samples from a Neolithic layer from Devil’s Gate Cave, Primorye. Vopr. Antropol. 58, 184–187 (1978). [Google Scholar]
- 59.Llorente M. G., Jones E. R., Eriksson A., Siska V., Arthur K. W., Arthur J. W., Curtis M. C., Stock J. T., Coltorti M., Pieruccini P., Stretton S., Brock F., Higham T., Park Y., Hofreiter M., Bradley D. G., Bhak J., Pinhasi R., Manica A., Ancient Ethiopian genome reveals extensive Eurasian admixture throughout the African continent. Science 350, 820–822 (2015). [DOI] [PubMed] [Google Scholar]
- 60.Shapiro B., Hofreiter M., A paleogenomic perspective on evolution and gene function: New insights from ancient DNA. Science 343, 1236573 (2014). [DOI] [PubMed] [Google Scholar]
- 61.Manica A., Amos W., Balloux F., Hanihara T., The effect of ancient population bottlenecks on human phenotypic variation. Nature 448, 346–348 (2007). [DOI] [PMC free article] [PubMed] [Google Scholar]
- 62.Lamason R. L., Mohideen M.-A. P. K., Mest J. R., Wong A. C., Norton H. L., Aros M. C., Jurynec M. J., Mao X., Humphreville V. R., Humbert J. E., Sinha S., Moore J. L., Jagadeeswaran P., Zhao W., Ning G., Makalowska I., McKeigue P. M., O’Donnell D., Kittles R., Parra E. J., Mangini N. J., Grunwald D. J., Shriver M. D., Canfield V. A., Cheng K. C., SLC24A5, a putative cation exchanger, affects pigmentation in zebrafish and humans. Science 310, 1782–1786 (2005). [DOI] [PubMed] [Google Scholar]
- 63.Sturm R. A., Molecular genetics of human pigmentation diversity. Hum. Mol. Genet. 18, R9–R17 (2009). [DOI] [PubMed] [Google Scholar]
- 64.Canfield V. A., Berg A., Peckins S., Wentzel S. M., Chung Ang K., Oppenheimer S., Cheng K. C., Molecular phylogeography of a human autosomal skin color locus under natural selection. G3 3, 2059–2067 (2013). [DOI] [PMC free article] [PubMed] [Google Scholar]
- 65.Basu Mallick C., Mircea Iliescu F., Möls M., Hill S., Tamang R., Chaubey G., Goto R., Ho S. Y. W., Gallego Romero I., Crivellaro F., Hudjashov G., Rai N., Metspalu M., Mascie-Taylor C. G. N., Pitchappan R., Singh L., Mirazon-Lahr M., Thangaraj K., Villems R., Kivisild T., The light skin allele of SLC24A5 in south Asians and Europeans shares identity by descent. PLOS Genet. 9, e1003912 (2013). [DOI] [PMC free article] [PubMed] [Google Scholar]
- 66.Wilde S., Timpson A., Kirsanow K., Kaiser E., Kayser M., Unterländer M., Hollfelder N., Potekhina I. D., Schier W., Thomas M. G., Burger J., Direct evidence for positive selection of skin, hair, and eye pigmentation in Europeans during the last 5,000 y. Proc. Natl. Acad. Sci. U.S.A. 111, 4832–4837 (2014). [DOI] [PMC free article] [PubMed] [Google Scholar]
- 67.Norton H. L., Kittles R. A., Parra E., McKeigue P., Mao X., Cheng K., Canfield V. A., Bradley D. G., McEvoy B., Shriver M. D., Genetic evidence for the convergent evolution of light skin in Europeans and East Asians. Mol. Biol. Evol. 24, 710–722 (2007). [DOI] [PubMed] [Google Scholar]
- 68.Donnelly M. P., Paschou P., Grigorenko E., Gurwitz D., Barta C., Lu R.-B., Zhukova O. V., Kim J.-J., Siniscalco M., New M., Li H., Kajuna S. L. B., Manolopoulos V. G., Speed W. C., Pakstis A. J., Kidd J. R., Kidd K. K., A global view of the OCA2-HERC2 region and pigmentation. Hum. Genet. 131, 683–696 (2011). [DOI] [PMC free article] [PubMed] [Google Scholar]
- 69.Hider J. L., Gittelman R. M., Shah T., Edwards M., Rosenbloom A., Akey J. M., Parra E. J., Exploring signatures of positive selection in pigmentation candidate genes in populations of East Asian ancestry. BMC Evol. Biol. 13, 150 (2013). [DOI] [PMC free article] [PubMed] [Google Scholar]
- 70.Yuasa I., Umetsu K., Harihara S., Kido A., Miyoshi A., Saitou N., Dashnyam B., Jin F., Lucotte G., Chattopadhyay P. K., Henke L., Henke J., Distribution of two Asian-related coding SNPs in the MC1R and OCA2 genes. Biochem. Genet. 45, 535–542 (2007). [DOI] [PubMed] [Google Scholar]
- 71.Yuasa I., Umetsu K., Harihara S., Miyoshi A., Saitou N., Sook Park K., Dashnyam B., Jin F., Lucotte G., Chattopadhyay P. K., Henke L., Henke J., OCA2*481Thr, a hypofunctional allele in pigmentation, is characteristic of northeastern Asian populations. J. Hum. Genet. 52, 690–693 (2007). [DOI] [PubMed] [Google Scholar]
- 72.Yuasa I., Harihara S., Jin F., Nishimukai H., Fujihara J., Fukumori Y., Takeshita H., Umetsu K., Saitou N., Distribution of OCA2∗481Thr and OCA2∗615Arg, associated with hypopigmentation, in several additional populations. Leg. Med. 13, 215–217 (2011). [DOI] [PubMed] [Google Scholar]
- 73.Ramos E. M., Hoffman D., Junkins H. A., Maglott D., Phan L., Sherry S. T., Feolo M., Hindorff L. A., Phenotype–Genotype Integrator (PheGenI): Synthesizing genome-wide association study (GWAS) data with existing genomic resources. Eur. J. Hum. Genet. 22, 144–147 (2014). [DOI] [PMC free article] [PubMed] [Google Scholar]
- 74.Fujimoto A., Ohashi J., Nishida N., Miyagawa T., Morishita Y., Tsunoda T., Kimura R., Tokunaga K., A replication study confirmed the EDAR gene to be a major contributor to population differentiation regarding head hair thickness in Asia. Hum. Genet. 124, 179–185 (2008). [DOI] [PubMed] [Google Scholar]
- 75.Kamberov Y. G., Wang S., Tan J., Gerbault P., Wark A., Tan L., Yang Y., Li S., Tang K., Chen H., Powell A., Itan Y., Fuller D., Lohmueller J., Mao J., Schachar A., Paymer M., Hostetter E., Byrne E., Burnett M., McMahon A. P., Thomas M. G., Lieberman D. E., Jin L., Tabin C. J., Morgan B. A., Sabeti P. C., Modeling recent human evolution in mice by expression of a selected EDAR variant. Cell 152, 691–702 (2013). [DOI] [PMC free article] [PubMed] [Google Scholar]
- 76.Goedde H. W., Agarwal D. P., Fritze G., Meier-Tackmann D., Singh S., Beckmann G., Bhatia K., Chen L. Z., Fang B., Lisker R., Paik Y. K., Rothhammer F., Saha N., Segal B., Srivastava L. M., Czeizel A., Distribution of ADH2 and ALDH2 genotypes in different populations. Hum. Genet. 88, 344–346 (1992). [DOI] [PubMed] [Google Scholar]
- 77.Li H., Borinskaya S., Yoshimura K., Kal’ina N., Marusin A., Stepanov V. A., Qin Z., Khaliq S., Lee M.-Y., Yang Y., Mohyuddin A., Gurwitz D., Mehdi S. Q., Rogaev E., Jin L., Yankovsky N. K., Kidd J. R., Kidd K. K., Refined geographic distribution of the oriental ALDH2*504Lys (nee 487Lys) variant. Ann. Hum. Genet. 73, 335–345 (2009). [DOI] [PMC free article] [PubMed] [Google Scholar]
- 78.Matsuo K., Hamajima N., Shinoda M., Hatooka S., Inoue M., Takezaki T., Tajima K., Gene–environment interaction between an aldehyde dehydrogenase-2 (ALDH2) polymorphism and alcohol consumption for the risk of esophageal cancer. Carcinogenesis 22, 913–916 (2001). [DOI] [PubMed] [Google Scholar]
- 79.Cusi D., Barlassina C., Azzani T., Casari G., Citterio L., Devoto M., Glorioso N., Lanzani C., Manunta P., Righetti M., Rivera R., Stella P., Troffa C., Zagato L., Bianchi G., Polymorphisms of α-adducin and salt sensitivity in patients with essential hypertension. Lancet 349, 1353–1357 (1997). [DOI] [PubMed] [Google Scholar]
- 80.van den Wildenberg E., Wiers R. W., Dessers J., Janssen R. G. J. H., Lambrichs E. H., Smeets H. J. M., van Breukelen G. J. P., A functional polymorphism of the μ-opioid receptor gene (OPRM1) influences cue-induced craving for alcohol in male heavy drinkers. Alcohol. Clin. Exp. Res. 31, 1–10 (2007). [DOI] [PubMed] [Google Scholar]
- 81.Haerian B. S., Haerian M. S., OPRM1 rs1799971 polymorphism and opioid dependence: Evidence from a meta-analysis. Pharmacogenomics 14, 813–824 (2013). [DOI] [PubMed] [Google Scholar]
- 82.Rodriguez S., Steer C. D., Farrow A., Golding J., Day I. N. M., Dependence of deodorant usage on ABCC11 genotype: Scope for personalized genetics in personal hygiene. J. Invest. Dermatol. 133, 1760–1767 (2013). [DOI] [PMC free article] [PubMed] [Google Scholar]
- 83.Yoshiura K.-i., Kinoshita A., Ishida T., Ninokata A., Ishikawa T., Kaname T., Bannai M., Tokunaga K., Sonoda S., Komaki R., Ihara M., Saenko V. A., Alipov G. K., Sekine I., Komatsu K., Takahashi H., Nakashima M., Sosonkina N., Mapendano C. K., Ghadami M., Nomura M., Liang D.-S., Miwa N., Kim D.-K., Garidkhuu A., Natsume N., Ohta T., Tomita H., Kaneko A., Kikuchi M., Russomando G., Hirayama K., Ishibashi M., Takahashi A., Saitou N., Murray J. C., Saito S., Nakamura Y., Niikawa N., A SNP in the ABCC11 gene is the determinant of human earwax type. Nat. Genet. 38, 324–330 (2006). [DOI] [PubMed] [Google Scholar]
- 84.Cho Y. S., Chen C.-H., Hu C., Long J., Ong R. T. H., Sim X., Takeuchi F., Wu Y., Jin Go M., Yamauchi T., Chang Y.-C., Kwak S. H., Ma R. C. W., Yamamoto K., Adair L. S., Aung T., Cai Q., Chang L.-C., Chen Y.-T., Gao Y., Hu F. B., Kim H.-L., Kim S., Kim Y. J., Lee J. J.-M., Lee N. R., Li Y., Liu J. J., Lu W., Nakamura J., Nakashima E., Ng D. P.-K., Tay W. T., Tsai F.-J., Wong T. Y., Yokota M., Zheng W., Zhang R., Wang C., So W. Y., Ohnaka K., Ikegami H., Hara K., Cho Y. M., Cho N. H., Chang T.-J., Bao Y., Hedman Å. K., Morris A. P., McCarthy M. I.; DIAGRAM Consortium; MuTHER Consortium, Takayanagi R., Park K. S., Jia W., Chuang L.-M., Chan J. C. N., Maeda S., Kadowaki T., Lee J.-Y., Wu J.-Y., Teo Y. Y., Tai E. S., Shu X. O., Mohlke K. L., Kato N., Han B.-G., Seielstad M., Meta-analysis of genome-wide association studies identifies eight new loci for type 2 diabetes in East Asians. Nat. Genet. 44, 67–72 (2012). [DOI] [PMC free article] [PubMed] [Google Scholar]
Associated Data
This section collects any data citations, data availability statements, or supplementary materials included in this article.
Supplementary Materials
Supplementary material for this article is available at http://advances.sciencemag.org/cgi/content/full/3/2/e1601877/DC1
Supplementary Materials and Methods
fig. S1. Calibrated age range of the two human specimens from Devil’s Gate (OxCal version 4.2.4).
fig. S2. Damage patterns for samples from Devil’s Gate.
fig. S3. Sequence length distribution for samples from Devil’s Gate.
fig. S4. Outgroup f3 statistics on PMDtools-filtered data.
fig. S5. PCA on all SNPs using the worldwide panel.
fig. S6. PCA on transversion SNPs using the worldwide panel.
fig. S7. PCA on all SNPs using the regional panel.
fig. S8. PCA on transversion SNPs using the regional panel.
fig. S9. ADMIXTURE analysis cross-validation (CV) error as a function of the number of clusters (K) for the regional panel using all SNPs (top row) or transversions only (bottom row) and with (left column) or without (right column) MapDamage treatment.
fig. S10. ADMIXTURE analysis CV error as a function of the number of clusters (K) for the world panel using all SNPs (top row) or transversions only (bottom row) and with (left column) or without (right column) MapDamage treatment.
fig. S11. Outgroup f3 scores of the form f3(X, MA1; Khomani), with modern populations and selected ancient samples (DevilsGate1, DevilsGate2, Ust’-Ishim, Kotias, Loschbour, and Stuttgart), using all SNPs, with f3 > 0.15 displayed.
fig. S12. D scores of the form D(X, Khomani; MA1, DevilsGate1), with all modern populations in our panel and selected ancient samples, using all SNPs.
fig. S13. D scores of the form D(X, Khomani; MA1, DevilsGate1), with all modern populations in our panel and selected ancient samples, using all SNPs.
fig. S14. Outgroup f3 scores of the form f3(X, Ust’-Ishim; Khomani), with modern populations and selected ancient samples (MA1, Kotias, Loschbour, and Stuttgart), using all SNPs, with f3 > 0.15 displayed.
fig. S15. D scores of the form D(X, Khomani; Ust’-Ishim, DevilsGate1), with all modern populations in our panel and selected ancient samples, using all SNPs.
fig. S16. D scores of the form D(X, Khomani; Ust’-Ishim, DevilsGate2), with all modern populations in our panel and selected ancient samples, using all SNPs.
fig. S17. Comparison of Devil’s Gate–related ancestry in the Ulchi and European hunter-gatherer–related ancestry in European populations.
fig. S18. Comparison of Devil’s Gate–related ancestry in the Ulchi and Early European farmer–related ancestry in European populations.
fig. S19. Comparison of Devil’s Gate–related ancestry in the Ulchi and Bronze Age Steppe–related ancestry in European populations.
table S1. Details of sample preparation and sequencing.
table S2. mtDNA contamination estimates.
table S3. Admixture f3(Source1, Source2; Target) for the Ulchi with z < −1 using all SNPs.
table S4. Admixture f3(Source1, Source2; Target) for the Ulchi with z < −1 using only transversion SNPs.
table S5. Admixture f3(Source1, Source2; Target) for the Sardinians using all SNPs and showing the 10 most significantly negative pairs.
table S6. Admixture f3(Source1, Source2; Target) for the Lithuanians using all SNPs and showing the 10 most significantly negative pairs.
extended data fig. S1. Results from ADMIXTURE analysis using the regional panel, all SNPs, and MapDamage treatment on samples from Devil’s Gate and setting the number of clusters to K = 2 to 10.
extended data fig. S2. Results from ADMIXTURE analysis using the regional panel, transversion SNPs, and MapDamage treatment on samples from Devil’s Gate and setting the number of clusters to K = 2 to 10.
extended data fig. S3. Results from ADMIXTURE analysis using the regional panel, all SNPs, and no MapDamage treatment on samples from Devil’s Gate and setting the number of clusters to K = 2 to 10.
extended data fig. S4. Results from ADMIXTURE analysis using the regional panel, transversion SNPs, and no MapDamage treatment on samples from Devil’s Gate and setting the number of clusters to K = 2 to 10.
extended data fig. S5. Results from ADMIXTURE analysis using the total panel, all SNPs, and MapDamage treatment on samples from Devil’s Gate and setting the number of clusters to K = 2 to 20.
extended data fig. S6. Results from ADMIXTURE analysis using the total panel, transversion SNPs, and MapDamage treatment on samples from Devil’s Gate and setting the number of clusters to K = 2 to 20.
extended data fig. S7. Results from ADMIXTURE analysis using the total panel, all SNPs, and no MapDamage treatment on samples from Devil’s Gate and setting the number of clusters to K = 2 to 20.
extended data fig. S8. Results from ADMIXTURE analysis using the total panel, transversion SNPs, and no MapDamage treatment on samples from Devil’s Gate and setting the number of clusters to K = 2 to 20.
extended data table S1. Sample information.
extended data table S2. ADMIXTURE proportions.
extended data table S3. Outgroup f3 statistics for Devil’s Gate.
extended data table S4. Outgroup f3 and space.
extended data table S5. Outgroup f3 for MA1 and Ust’-Ishim.
extended data table S6. D scores for MA1 and Ust’-Ishim.
extended data table S7. D scores for the Ulchi.
extended data table S8. Admixture f3 for the Koreans and the Japanese.
extended data table S9. Phenotypes of interest.