Abstract
Tumor control rates of pituitary adenomas (PAs) receiving adjuvant CyberKnife stereotactic radiosurgery (CK SRS) are high. However, there is currently no uniform way to estimate the time course of the disease. The aim of this study was to analyze the volumetric responses of PAs after CK SRS and investigate the application of an exponential decay model in calculating an accurate time course and estimation of the eventual outcome.
A retrospective review of 34 patients with PAs who received adjuvant CK SRS between 2006 and 2013 was performed. Tumor volume was calculated using the planimetric method. The percent change in tumor volume and tumor volume rate of change were compared at median 4-, 10-, 20-, and 36-month intervals. Tumor responses were classified as: progression for >15% volume increase, regression for ≤15% decrease, and stabilization for ±15% of the baseline volume at the time of last follow-up. For each patient, the volumetric change versus time was fitted with an exponential model.
The overall tumor control rate was 94.1% in the 36-month (range 18–87 months) follow-up period (mean volume change of −43.3%). Volume regression (mean decrease of −50.5%) was demonstrated in 27 (79%) patients, tumor stabilization (mean change of −3.7%) in 5 (15%) patients, and tumor progression (mean increase of 28.1%) in 2 (6%) patients (P = 0.001). Tumors that eventually regressed or stabilized had a temporary volume increase of 1.07% and 41.5% at 4 months after CK SRS, respectively (P = 0.017). The tumor volume estimated using the exponential fitting equation demonstrated high positive correlation with the actual volume calculated by magnetic resonance imaging (MRI) as tested by Pearson correlation coefficient (0.9).
Transient progression of PAs post-CK SRS was seen in 62.5% of the patients receiving CK SRS, and it was not predictive of eventual volume regression or progression. A three-point exponential model is of potential predictive value according to relative distribution. An exponential decay model can be used to calculate the time course of tumors that are ultimately controlled.
Keywords: CyberKnife, exponential fit, pituitary adenoma, stereotactic radiosurgery, transient swelling
1. Introduction
Pituitary adenomas (PAs) are a diverse group of tumors arising from the pituitary gland that account for approximately 20% of primary central nervous system tumors.[1,2] They are classified as nonfunctional or functional pituitary adenomas (FPAs) depending on the symptoms or signs secondary to hormonal hypersecretion by the tumor. According to previous studies, the ratio of non-functional pituitary adenomas (NFPAs) to FPAs is approximately 3:7.[3] PAs usually remain silent until the appearance of symptoms such as hormonal imbalance, chronic headache, and visual loss due to an increase in volume and even pituitary apoplexy.[4] The goal of treatment is to correct endocrine abnormalities and reduce the mass effect with preservation of vision.[5–8] Transsphenoidal surgery is considered to be the treatment of choice, and significant tumor debulking improves visual field disorders in 40% to 80% of patients.[9,10] However, even after complete or near complete surgical resection, NFPAs recurred in 12% to 58% of patients within 5 years.[11–14] In addition, the relapse rate of FPAs has been reported to be 20% to 45% depending on various endocrine functions.[15–17] Radiotherapy (RT) is frequently used in patients with residual or recurrent PAs with excellent rates of tumor control and remission of hormonal hypersecretion. Compared with conventional RT, CyberKnife stereotactic radiosurgery (CK SRS) allows for the delivery of a high dose of irradiation to the tumor while sparing critical radiosensitive structures, and it is widely used as postoperative adjuvant treatment of PAs. Previous studies have reported a tumor control rate of more than 90% with CK SRS for PAs.[18,19] However, as the use of adjuvant CK SRS has increased; clinicians have found it sometimes difficult to assess the therapeutic effect, especially when temporary enlargement occurs after CK SRS before eventual regression or progression. The aim of this study was to analyze the volumetric responses of PAs after CK SRS and to determine the relationship between volumetric changes and long-term outcomes using an exponential decay model, thus providing a more accurate and mathematical point of view for clinicians when assessing the clinical course.
2. Materials and methods
2.1. Study population
This study was approved by the Institutional Review Board of Tri-Service General Hospital, National Defense Medical Center (2–104–05–132). We performed a retrospective study using records from our database of 78 patients who underwent CK SRS for sellar tumors from January 2006 to December 2013 at Tri-Service General Hospital, National Defense Medical Center. Only patients with PAs confirmed histologically and who received adjuvant CK SRS following previous transsphenoidal surgery were included. Those with malignancy and those without histological confirmation were excluded. The patients were also required to have at least 3 follow-up MRI scans suitable for volumetric analysis in an electronic imaging system (UniWeb Viewer, EBM Technologies, Version 7.2). Patients who had previously undergone CK SRS or RT and then repeat CK SRS due to tumor recurrence and those without available or appropriate images in the imaging system were excluded. Clinical data were obtained through a review of the patients’ electronic medical records, the CyberKnife database, and available imaging studies. Data collected included demographic information, endocrine function, previous treatments, and parameters of the radiosurgical dose plan.
2.2. Volumetric analysis and tumor imaging
Radiographic images suitable for volumetric analysis included T1-weighted, gadolinium-enhanced MRI with complete axial, sagittal, or coronal sequences. With the planimetric method,[20] the tumor slice area was calculated by delineating a freehand region of interest around the contrast-enhanced lesion on each image slice through the EBM Viewer. After encircling all areas, the tumor volume was subsequently calculated as the sum of the areas multiplied by the slice thickness (range 1–6 mm) in centimeters (Fig. 1A). The volume was calculated on the day before CK SRS as the baseline volume (V0), and then on each follow-up MRI at median 4-, 10-, 20-, and 36-month time points according to the condition of the individual patient. A similar methodology used previously in meningiomas was adopted for quantitative volumetric analysis of PAs.[21] Volumetric statistics calculated at each follow-up time point included the percent change in volume (ΔV%) from baseline, the rate of volume change (RVC) in cm3/mo, and the percent rate of change (PRC) in percent/mo (Fig. 1B–D). The tumors were classified into 3 outcome groups according to the eventual percent volume change from the baseline volume. Tumors that ultimately progressed were defined as those having a volume >15% above the baseline volume on the final available follow-up image (ΔV% > 15). Tumors that remained stable were defined as those within a range of ±15% of the baseline volume (−15 ≤ ΔV% ≤ 15). Tumors that had regressed on the final available image were defined as those achieving a ΔV% > 15 below the baseline volume (ΔV% < −15). Transient volume progression was defined as immediate enlargement after CK SRS followed by volume regression regardless of the eventual outcome.
Figure 1.
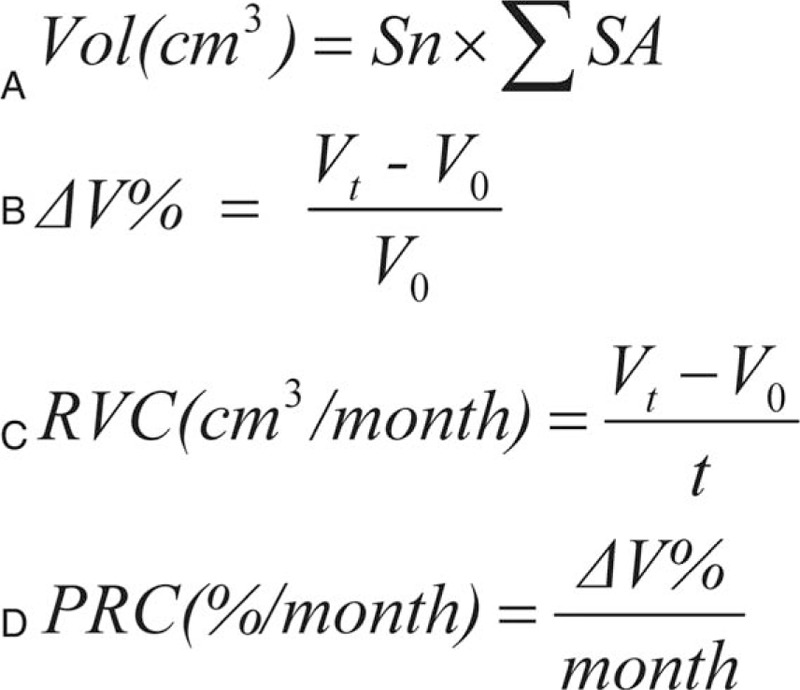
(A) Formulas used to calculate volumetric parameters. Sn = slice thickness; SA = slice area (B) percent of volume change from the initial volume at the time of treatment. V0 = baseline volume. (C) Rate of volume change. Vt = volume at the time of treatment; t = time. (D) Percent rate change.
2.3. CK SRS technique
The patients wore a thermoplastic facial mask and the treatment was delivered in a hypofractionated manner. Single isocenter was used for spherical lesions, whereas irregularly shaped lesions were usually treated with a non-isocentric technique. All of the CK SRS procedures were planned by the same principle according to tumor lesion shown on T1-weighted contrast-enhanced MRI and computed tomography. After CK SRS, the patients were typically discharged on the same day. Initial follow-up MRI was planned for 3 to 6 months after radiosurgery, then at about 1-year interval for the next 3 years, and at intervals of 3 to 4 years thereafter. Earlier or later imaging was obtained based on clinical judgment or at the patient's request.
2.4. Statistical analysis
Statistical analyses were performed using Excel (Microsoft, 2003) and MedCalc (Version 11.4.2.0, MedCalc Software). Descriptive statistics were applied to describe the patient population, tumor characteristics, and volumetric change. A P value <0.05 was considered to indicate statistical significance. To compare volumetric statistics between groups at different time points, the Kruskal-Wallis test (for continuous variables) was applied. The nonparametric Wilcoxon test (for continuous variables) and Fisher exact test (for categorical variables) were used to correlate demographic and treatment covariates with each group.
2.5. Analysis of tumor regression/progression
The demographics and clinical characteristics were further analyzed when considering the data as a binomial outcome ([regression + stable] versus progression) for primary predictors of volume regression/progression. The parameters included in the analysis were age, sex, immediate volumetric response after CK SRS, endocrine function, cavernous sinus invasion, preoperative apoplexy, baseline volume, relative position of the 10-month dataset to the exponential curve, SRS parameters, and follow-up time.
2.6. Analysis of transient volume progression after CK SRS
Univariate analysis was performed after the tumors had been further grouped as those with initial transient progression or regression after CK SRS. The parameters included in the analysis were age, sex, initial follow-up time, SRS parameters, endocrine function, cavernous sinus invasion, preoperative apoplexy, and initial volume. Parameters that were statistically significant were further analyzed in multivariate logistic regression analysis after adjusting for other clinical covariates.
2.7. Exponential fitting model
For each patient, the volume of the PA at each time point (including baseline volume) were plotted over time (days after CK SRS) to construct an exponential fitting model using the method of least squares (x = days after CK SRS, y = volume at each time point).[22,23] The relative goodness-of-fit was determined by Akaike information criterion[24] and Bayesian information criterion.[25] The coefficients of adjusted R2 were calculated to describe the proportion of variability for each individual data set accounting for the statistical model (Fig. 2A–C).
Figure 2.
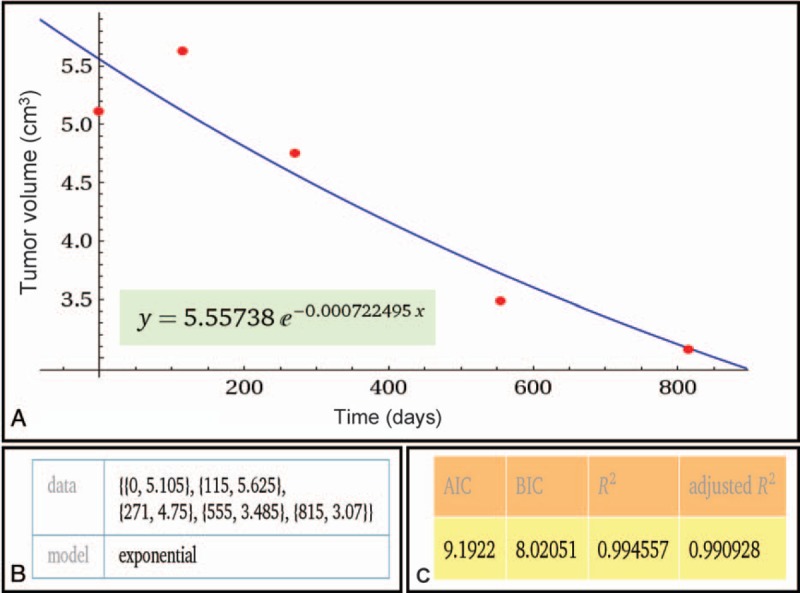
(A) Representative exponential fitting curve of a pituitary adenoma with eventual regression. The fitting formula is listed below. Wolfram Alpha LLC; 2015. Available at: http://www.wolframalpha.com/input/?i=exponential+fit+%7B0%2C+5.105%7D%2C+%7B115%2C+5.625%7D%2C+%7B271%2C+4.75%7D%2C+%7B555%2C+3.485%7D%2C+%7B815%2C+3.07%7D (accessed November 20, 2015). (B) The input data of the fitting model: {x, y} = {Days after SRS, volume}. (C) Parameters testing the relative goodness-of-fit demonstrating a good fit.
2.8. Predicting the trend of volume change with the exponential fitting model at an early stage
To test the feasibility of the model to predict future volumetric changes at an early stage of treatment, the volume and number of days including the first 2 follow-up visits (baseline, 4 months and 10 months) were used to construct the exponential fitting model. The trend of each curve and relative position of each point to the regression curve were recorded and examined using Fisher exact test.
2.9. Estimating future volume using the exponential fitting model
To test the feasibility of using the exponential model to estimate future volume, a model composed of volume and number of days at baseline, 1st, 2nd, and 3rd post-CK SRS follow-up visit was created, and the estimated volume at the 4th follow-up visit was calculated by entering the actual number of days at the 4th follow-up visit (x) into the fitting equation (Fig. 2A). The estimated volume was then compared with the actual volume acquired on the 4th follow-up MRI using Pearson correlation test and linear regression analysis.
2.10. Estimating the time course of volumetric change
To test the feasibility of using the model to calculate the volume at a specific time point, a model including the volume and number of days at the 4th and 20th month (not including the 10th month time point) was constructed. The number of days (x) at the 10th month time point was then input back into the formula. The estimated volume (y) was then compared with the actual volume acquired from the 10th month MRI using linear regression and Pearson correlation test. To estimate the time point of each tumor when regression, stabilization, or progression occurred, the estimated volume (y = 85%, 100%, or 115% V0) was input back into the exponential fitting formula constructed between the known interval, therefore revealing the specific time point (x).
3. Results
3.1. Clinical characteristics of the study population
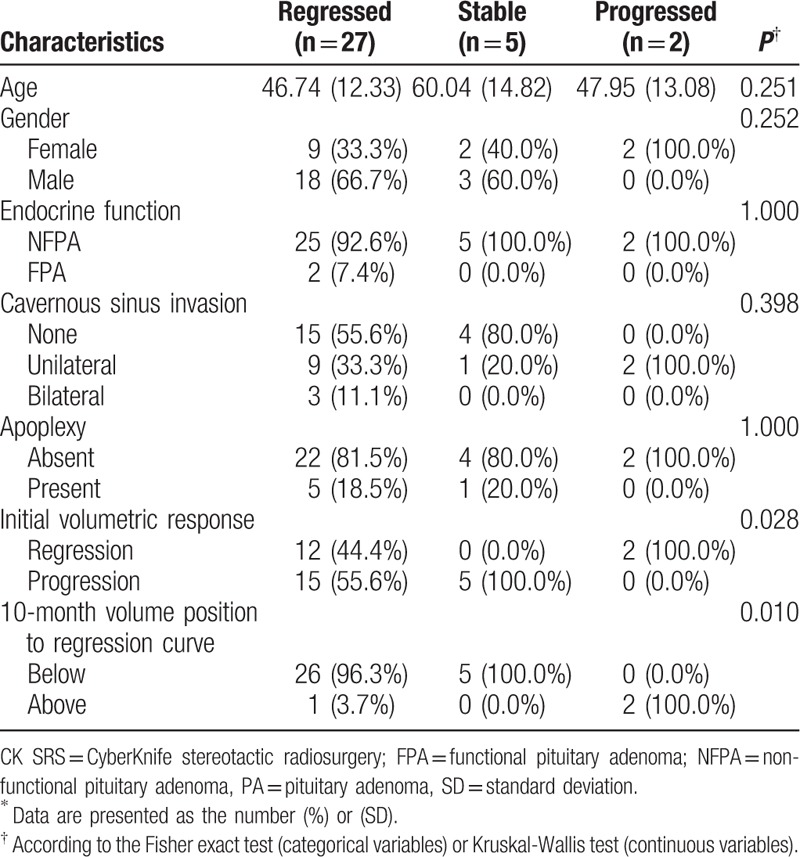
A total of 78 patients who underwent CK SRS for sellar tumors between January 2006 and December 2013 were identified, of whom 34 (44%) met the inclusion criteria. The mean age of the included patients was 48.8 years (range 22.7–76.4 years), and 38.2% were men and 61.8% were women. The characteristics of the PAs included endocrine function (94.1% were NFPAs), cavernous sinus invasion (55.9% patients without invasion, 35.3% had unilateral invasion, and 8.8% had bilateral invasion), and apoplexy (17.6%) (Table 1). The SRS parameters are summarized in Table 2. A representative case showing dose planning and the region of interest is described in Fig. 3. The demographics and clinical characteristics grouped by regression, stabilization, and progression are listed in Table 3.
Table 1.
Demographic and clinical characteristics of 34 patients with pituitary adenoma∗.
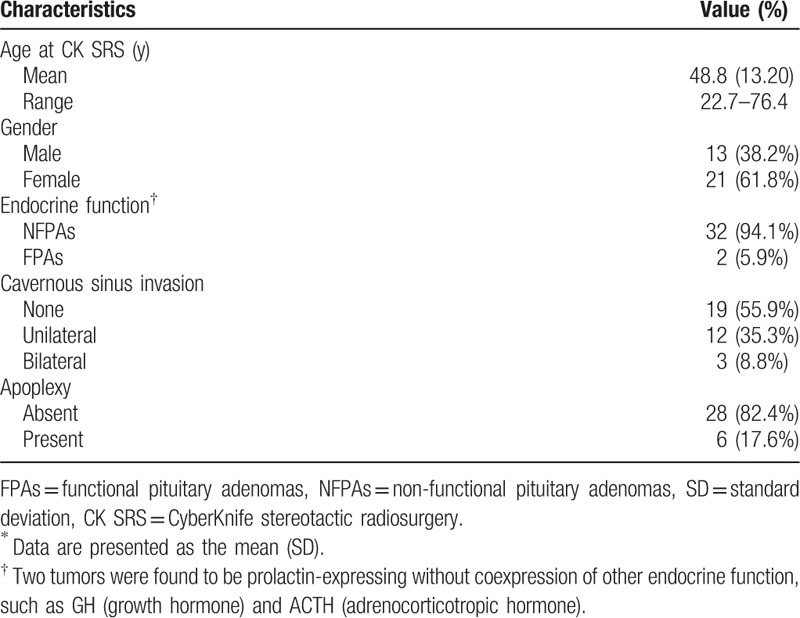
Table 2.
Summary of SRS parameters for 34 PAs∗.

Figure 3.
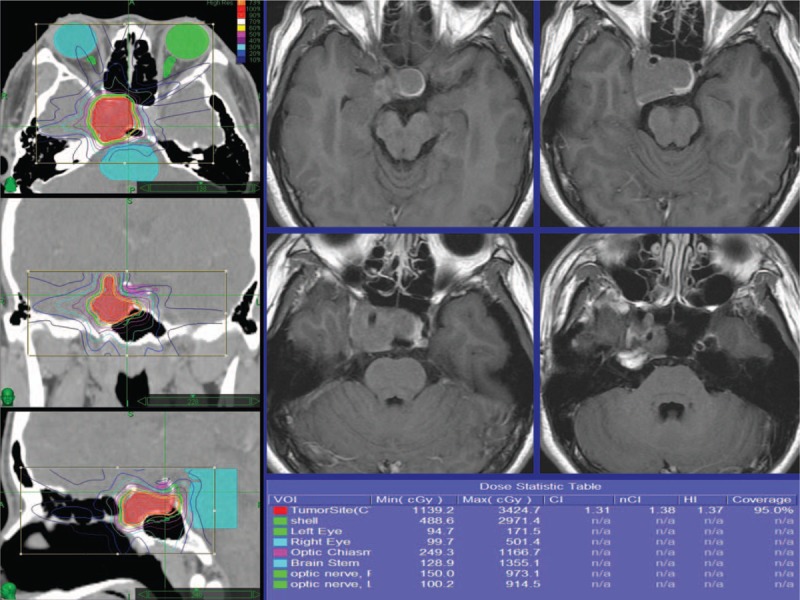
Radiosurgery dose plan images demonstrating a pituitary adenoma which was eventually controlled. The radiosurgery dose planning is shown with contours of the tumor and brainstem and optic chiasm.
Table 3.
Analysis for 34 patients with PA receiving post-op CK SRS in different groups∗.
3.2. Descriptive volumetric analysis
In total, 34 observations were available for analysis at the 4-, 10-, and 20-month time points, and 28 observations at the 36-month time point. The mean baseline tumor volume was 4.67 cm3 (SD 3.33, range 0.97–15.37 cm3). A transient increase in mean ΔV% (6.6%, SD 26.72) was observed 4 months post-CK SRS, followed by −17.93% of the mean ΔV% at 10 months, −33.9% at 20 months, and a mean reduction of −38.2% (SD 29.35, range −85.3% to −43.3%) in the tumor volume after a median follow-up of 36 months (range 18–87 months) for a mean final tumor volume of 2.93 cm3 (SD 3.00, range 0.5–10.6 cm3). The tumors were further categorized as those that regressed (Vfinal < 85%V0), were stable (85%V0 ≤ Vfinal ≤ 115%V0) and progressed (Vfinal > 115%) according to the observed volume on the final available follow-up image. Baseline volumes were similar in all groups (P = 0.161). Of the 34 patients who received adjuvant CK SRS, the tumor volume of 27 patients (79%) eventually regressed, 5 (15%) remained stable, and 2 (6%) progressed. In the progressed group, the tumors demonstrated a temporary decrease in volume (ΔV% = −5.76%, P = 0.015) at 4 months of follow-up, followed by a mean increase of 20.56% by 10 months (P = 0.002). The final change in volume was significantly larger than 15% in the tumors that progressed (ΔV% = 28.08%, P = 0.001), supporting the use of a ΔV of 15% as the cutoff value for progression. The mean increase in volume was 2 cm3 at 36 months of follow-up in the progressed group. In all tumors that stabilized, a transient increase in volume (ΔV% = 41.53%, P = 0.017) was observed at 4 months of follow-up, followed by 29.44% at 10 months, 2.75% at 20 months, and −3.71% at 36 months. In the tumors that ultimately regressed, a transient increase in tumor volume (ΔV% = 1.07%, P = 0.017) at 4 months of follow-up was observed, and a mean decrease of −29.55% was observed at 10 months (P = 0.002). The eventual mean decrease in volume was 2.52 cm3 (ΔV% = −50.52%, P = 0.001) at 36 months of follow-up (Table 4). The trend of volumetric change post-CK SRS of each group is shown in Fig. 4.
Table 4.
Volumetric statistics for 34 patients with PA receiving adjuvant CK SRS∗.
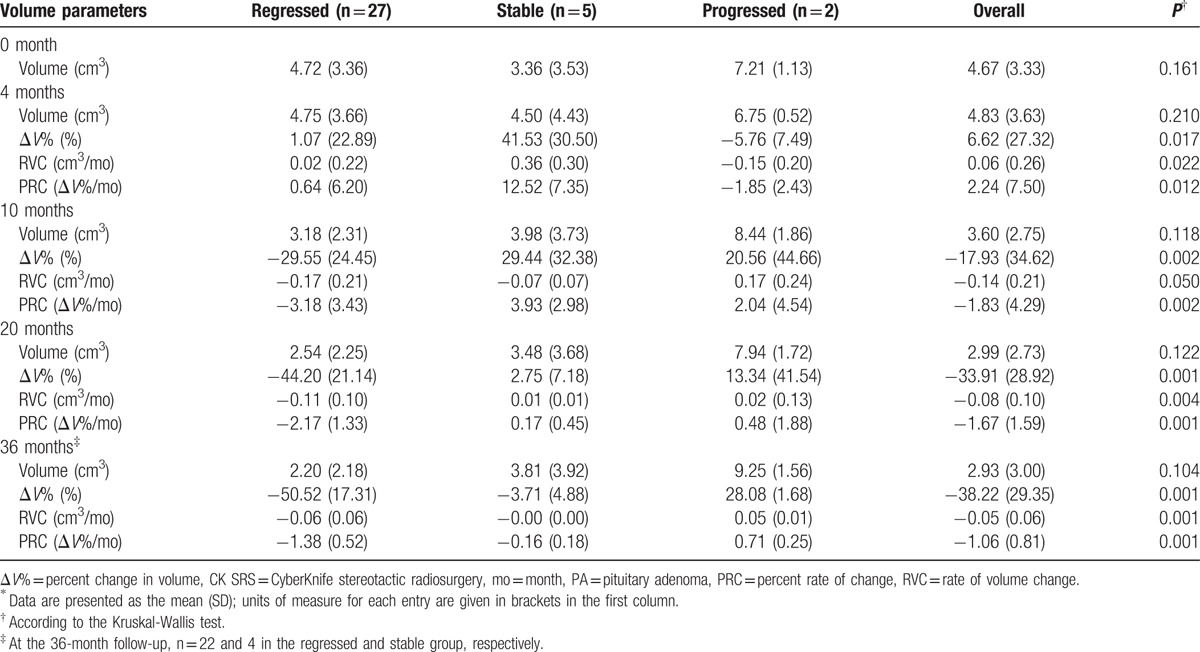
Figure 4.
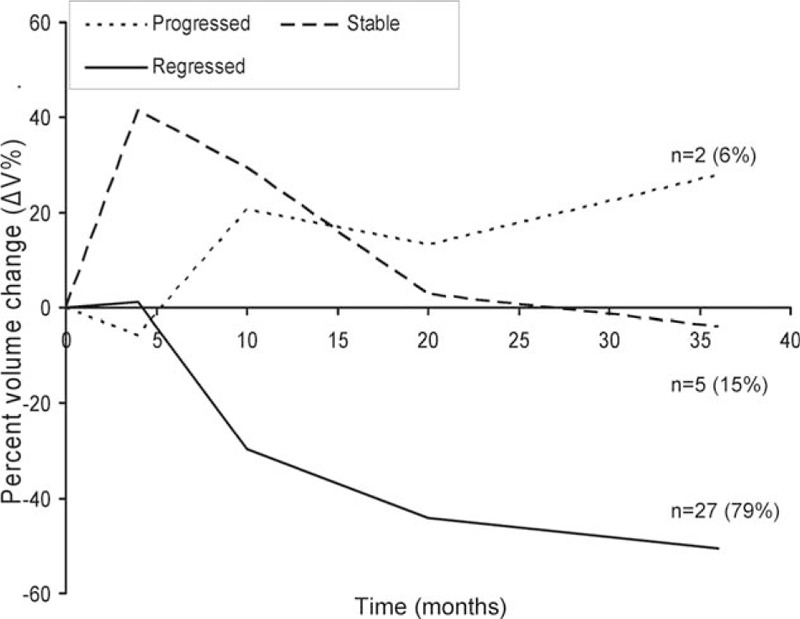
The mean ΔV% of different groups of outcomes. The mean ΔV% from the initial volume after CyberKnife stereotactic radiosurgery separated by tumors that ultimately regressed (solid line, n = 27) to <85% of the initial volume; stable (dashed line, n = 5) within ±15% of the initial volume; and those that progressed (dotted line, n = 2) to >115% of the initial volume. Tumor volume changes became significantly different at 4 months, with continued divergence until the 36th month of follow-up.
3.3. Rate of volumetric change
The PAs in the regressed group demonstrated a mean rate of volume change of 0.02 cm3/mo (SD 0.22, range −0.37 to 0.85) in the first 4 months post-SRS. A stabilization of the regression rate was observed after 4 months (Fig. 4). In contrast, the PAs in the progressed group demonstrated a slightly earlier response to CK SRS, with a mean rate of −0.15 cm3/mo (SD 0.2, P = 0.022) in the first 4 months post-SRS, and then exhibited a positive rate of change (0.17 cm3/mo, range 0.0004–0.34) by 10 months. Transient enlargement was observed in 5 tumors (100%) that stabilized and in 15 out of 27 (55.6%) that eventually regressed. Early regression was observed in 2 tumors (100%) before eventual volume progression. Variability in the rate of change was highest in the months immediately after surgery, with a trend toward stability at 10 to 20 months post-SRS, and nearly zero at 36 months (Fig. 5).
Figure 5.
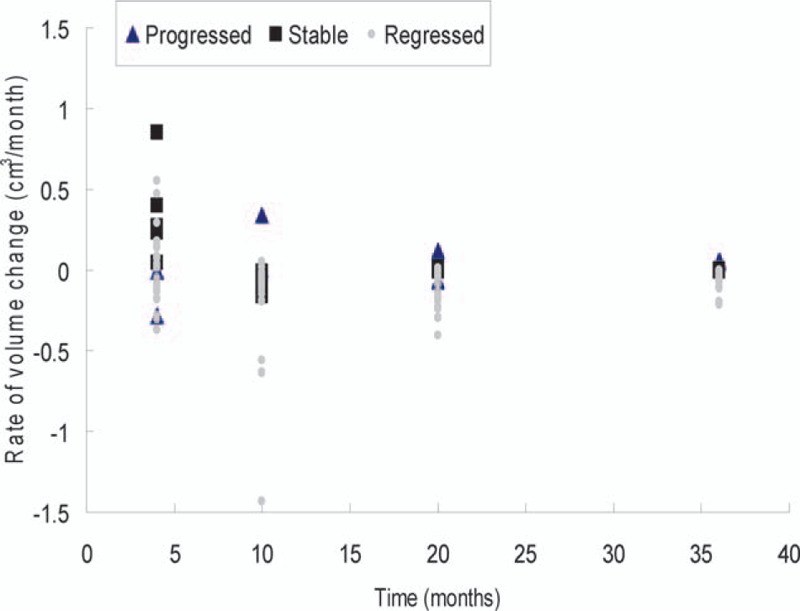
Scatter plot demonstrating the rate of volume change (cm3/mo) of the whole follow-up course separated by different outcome groups. There was increased variability in rate in the first 4 months, with stabilization after 10 months. All tumors gained a stable rate in the 36th month (mean −0.05 cm3/mo, P = 0.001).
3.4. Analysis of tumor regression/progression
When the tumors were grouped as controlled (regressed + stabilized) versus progressed, there was no statistical difference in age and baseline volume between the two groups. The only statistically significant parameter for eventual volume progression was the 10-month volume position to the exponential fitting curve (P = 0.005), demonstrating a correlation with eventual tumor control when located below the curve. The mean time for the tumors to eventually progress according to a greater volume was 26 months (range 6–45 months). An initial volume response was not related to eventual volume regression or progression.
3.5. Analysis of transient volume progression after CK SRS
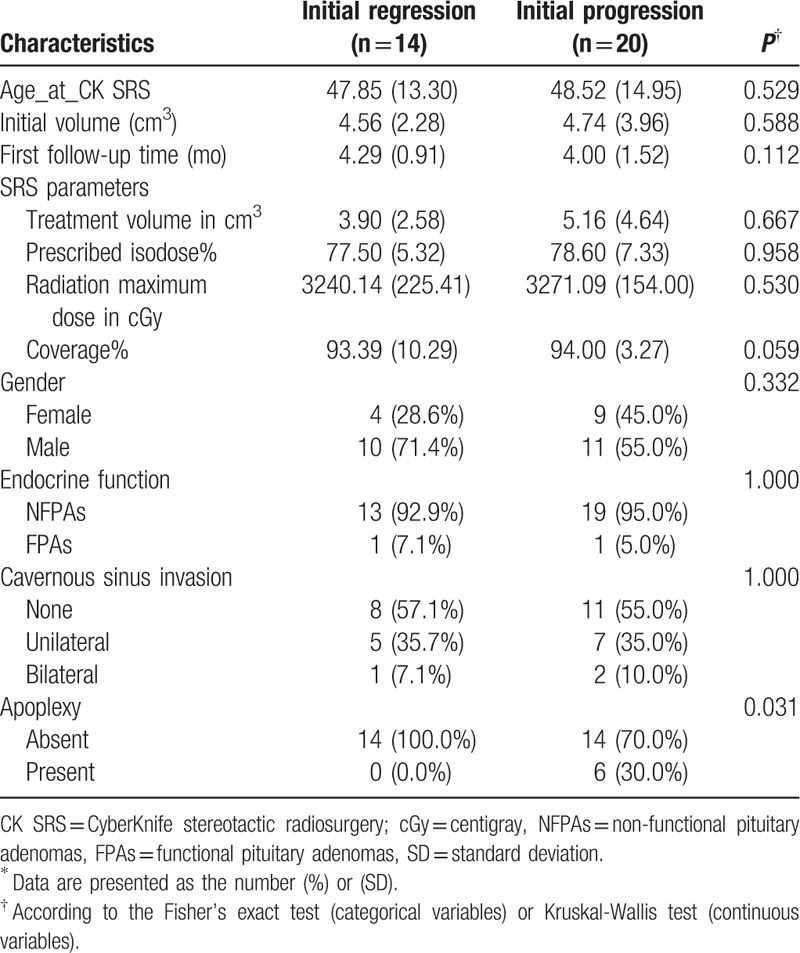
The mean age at SRS was 48.5 years (SD 14.95) in the group with initial tumor progression and 47.9 years (SD 13.30) in the group with initial regression (P = 0.529). The baseline volumes were 4.56 cm3 (SD 2.28) and 4.74 cm3 (SD 3.96) in the groups with initial tumor progression and initial regression, respectively (P = 0.588). There was no difference in the first follow-up time between the initial regression (4.29 months) and progression groups (4.00 months, P = 0.160) and baseline volume, suggesting that transient enlargement post-CK SRS was not volume- or time-dependent. There were also no statistical differences in any of the SRS parameters. Eighteen tumors (90%) reached the maximum volume enlargement by 4 months and 2 by 10 months (10%). The mean transient progression volume was 23.8% of the initial volume (SD 22.01, range 2.9–92.9%) for all tumors with initial progression. The mean enlarged volume was statistically higher in the stable group (41.5%, SD 15.56) than in the regressed group (16.86%, SD 30.50; 95% CI 2.08–45.20, P = 0.02, unpaired t test) (Fig. 6). The median time for a tumor that initially progressed to achieve stable volume control was 9.2 months (range 4–32 months). Of all the demographic and clinical variables, only preoperative apoplexy reached statistical significance (70% in the initially progressed group, P = 0.031), suggesting a correlation with initial tumor progression (Table 5). No flare-ups of tumor volume were observed after initial volume progression.
Figure 6.
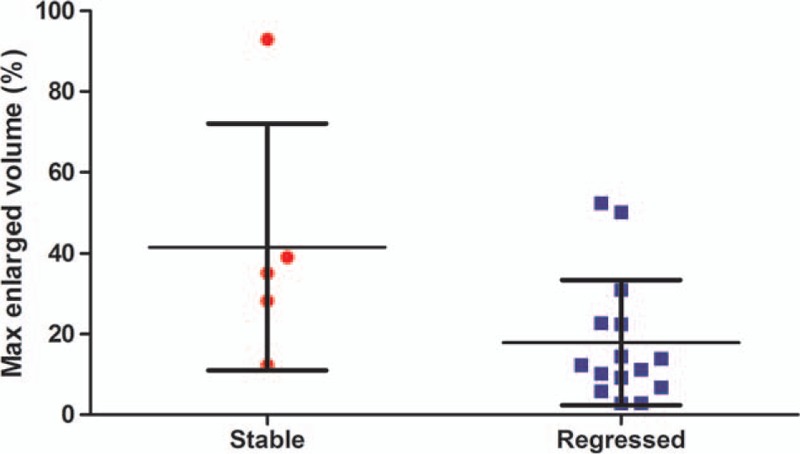
Scatter plot demonstrating max progressed volume (%) ± 1 SD after CyberKnife stereotactic radiosurgery in tumors with transient progression divided into regressed (solid square) and stabilized (solid circle) groups (95% CI 2.08–45.20, P = 0.0334, unpaired t test). CI = confidence interval.
Table 5.
Statistical analysis of tumors with initial progression/ regression after CK SRS∗.
3.6. Analysis of volumetric change using the exponential fitting model
Based on the findings that stable tumor decay developed by 10 months post-CK SRS regardless of the initial response, the exponential fitting model consisted of volumes and the number of days at baseline, 4 and 10 months. The results demonstrated a good fit for all groups tested using Akaike information criterion, Bayesian information criterion, R2, and adjusted R2. The 10-month point was located below the exponential fitting curve in 26 (96.3%) and 5 patients (100%) in the regressed and stable groups, respectively, showing a triangular distribution (Fig. 7 upper). Whereas in the progressed group, the 10-month point was located above the exponential fitting curve in both patients (100%, P = 0.01), demonstrating an inverted triangular pattern (Fig. 7 lower).
Figure 7.
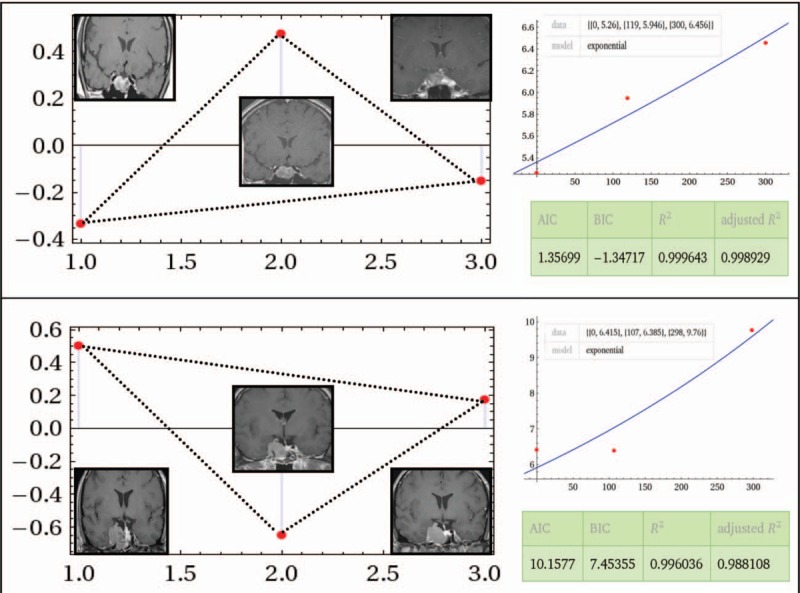
Upper: Exponential model constructed with baseline, 4- and 10-month datasets of pituitary adenomas with eventual regression. The relative position of each dataset demonstrated a below-above-below (triangular) manner with representative magnetic resonance imaging at each time point. Wolfram Alpha LLC; 2015. Available at: http://www.wolframalpha.com/input/?i=exponential+fit+%7B0%2C+5.26%7D%2C+%7B119%2C+5.946%7D%2C+%7B300%2C+6.456%7D (accessed November 20, 2015). Lower: The relative position of each dataset in a tumor that eventually progressed demonstrating an above-below-above (inverted triangular) manner with representative magnetic resonance imaging at each time point. The relative goodness-of-fit is demonstrated on the right side in both figures. Wolfram Alpha LLC; 2015. Available at: http://www.wolframalpha.com/input/?i=exponential+fit+%7B0%2C+6.415%7D%2C+%7B107%2C+6.385%7D%2C+%7B298%2C+9.76%7D (accessed October 7, 2015).
3.7. Estimating future volume using the exponential fitting model
The exponential fitting model constructed with baseline, 1st, 2nd, and 3rd datasets was used to predict the 4th follow-up volume. The mean estimated volume was 2.47 cm3 (SD 2.88), and the average actual volume acquired via MRI was 2.93 cm3 (SD 3.00). In the group that regressed, the estimated volume was 1.68 cm3 (SD 1.95) compared with the actual volume of 2.20 cm3 (SD 2.18). In the stabilized group, the estimated volume was 4.16 cm3 (SD 3.85) compared with the actual volume of 3.81 cm3 (SD 3.92). In the group that progressed, the mean estimated volume was 7.83 cm3 (SD 3.98) compared with an actual volume of 9.25 cm3 (SD 1.56) (Table 6). The two datasets demonstrated a high correlation with each other using linear regression and Pearson correlation test (R2 = 0.81, correlation coefficient = 0.9) (Fig. 8). If the tumors that ultimately progressed were excluded, the estimated volume and actual volume in the controlled group demonstrated an even higher correlation with each other after linear correlation and Pearson correlation test (R2 = 0.9, correlation coefficient = 0.95) (Fig. 9).
Table 6.
Comparison of true and estimated 36th-month volume using exponential curve fitting equation∗.

Figure 8.
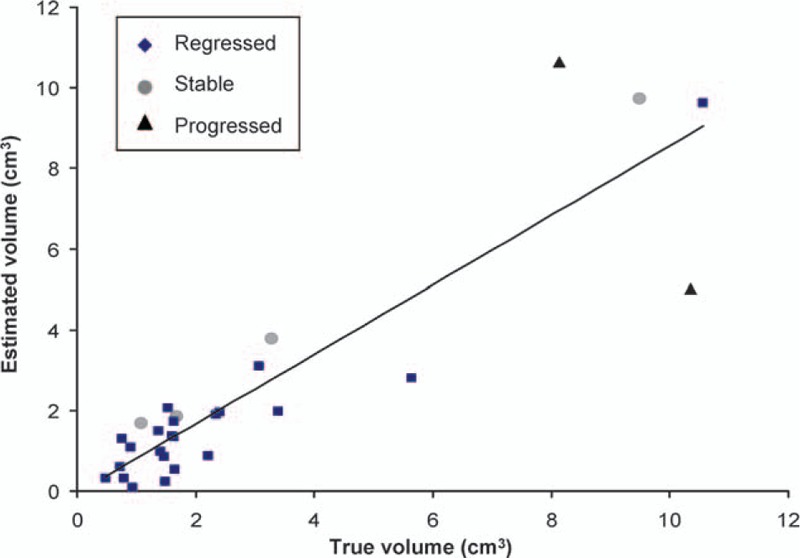
Linear regression demonstrating a high correlation between the estimated volume using the exponential fitting formula and the measured volume through magnetic resonance imaging at the 36th month in the tumors overall (R2 = 0.8; Pearson correlation coefficient = 0.9).
Figure 9.
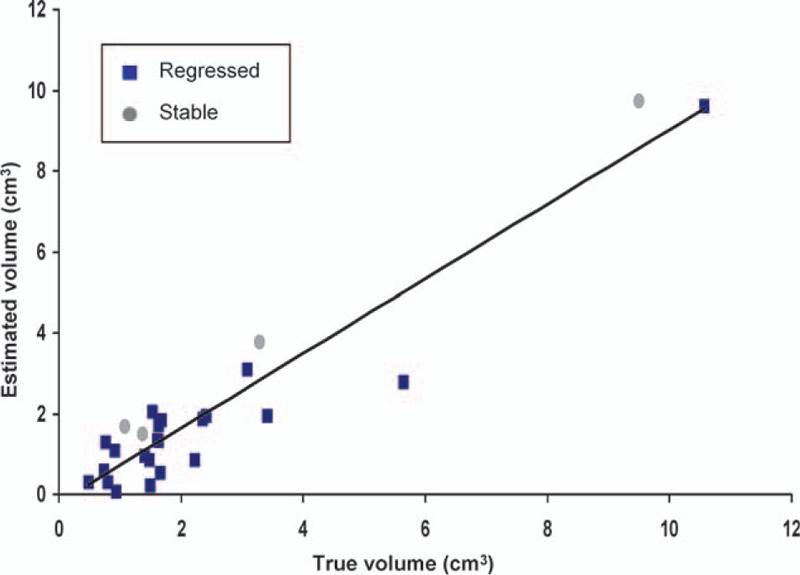
Linear regression demonstrating a higher correlation between the estimated volume using the exponential fitting formula and the measured volume through magnetic resonance imaging at the 36th month in the regressed plus stabilized group after excluding the tumors that progressed (R2 = 0.9; Pearson correlation coefficient = 0.95), suggesting a better feasibility in the application of the exponential model.
3.8. Calculating volumetric change between two existing time point
An exponential fitting model composed of data from 4 to 20 months was used to calculate the volume at 10 months. The mean estimated volume was 3.92 cm3 (SD 3.01), and the mean volume acquired via MRI at 10 months was 3.60 cm3 (SD 2.75). The two datasets demonstrated a high correlation with each other after further analysis using linear regression and Pearson correlation test (R2 = 0.84, correlation coefficient = 0.92) (Table 7 and Fig. 10). After excluding the tumors that ultimately progressed, the estimated volume and actual volume in the controlled group demonstrated an even higher correlation with each other after linear correlation and Pearson correlation test (R2 = 0.87, correlation coefficient = 0.93) (Fig. 11).
Table 7.
Comparison of true and estimated 10-month volume using exponential curve fitting equation∗.

Figure 10.
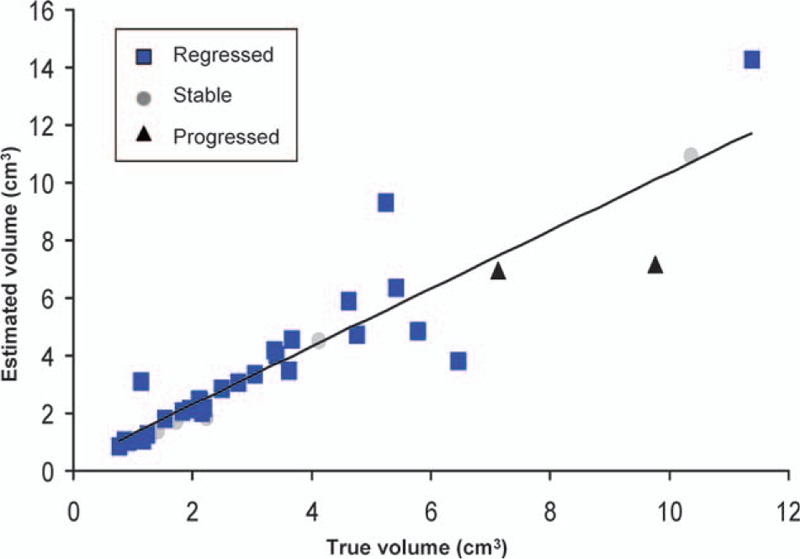
Linear regression demonstrating a high correlation between the estimated volume using the exponential fitting formula and the measured volume through magnetic resonance imaging at the 10th month in all tumors regardless of outcome (R2 = 0.84; Pearson correlation coefficient = 0.92).
Figure 11.
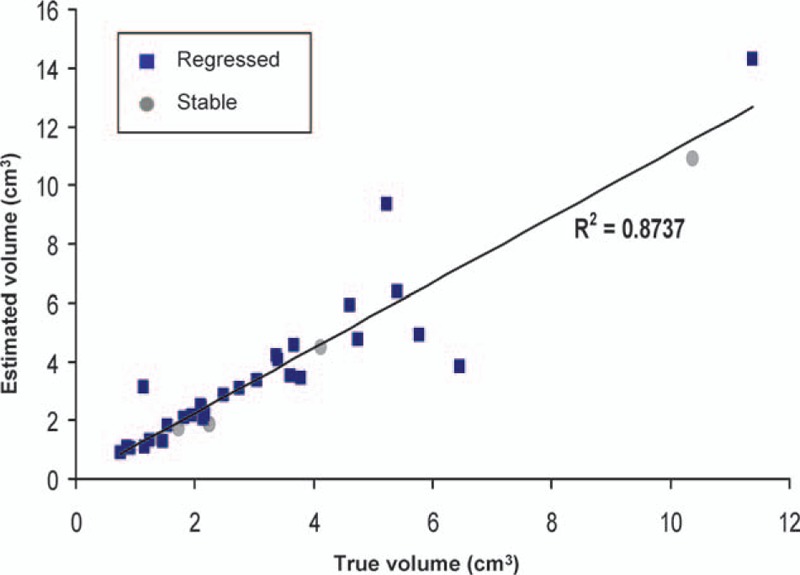
Linear regression demonstrating a higher correlation between the estimated volume using the exponential fitting formula and the measured volume through magnetic resonance imaging at the 10th month in the regressed plus stabilized group after excluding those that progressed (R2 = 0.87; Pearson correlation coefficient = 0.93), suggesting a better feasibility in the application of the exponential model.
4. Discussion
4.1. Initial volumetric response and tumor progression/regression
As a PA grows, the tumor exerts a mass effect on surrounding structures which can induce focal neurological deficits such as an impaired visual field or visual acuity and even blindness.[26] Owing to improvements in operating microscopes, endoscopy, and microneurosurgical techniques, the surgical treatment for PA has become less invasive, however, this has also contributed to the potential for incomplete resection of the tumors. Invasion into the cavernous sinuses or the property of the tumor itself may also contribute to difficulty in total resection. CK SRS is widely accepted to be a highly safe and effective adjuvant treatment for PAs, with a greater than 90% 5-year tumor control rate reported in most series, which is also consistent with the current series.[27] Transient enlargement of tumor volume (also termed transient swelling or cyst enlargement) is not unusual in clinical practice, and this may mislead clinicians and cause anxiety for the patients in the early stages of treatment or even cause transient worsening of visual acuity.[18] Besides PAs, this biological phenomenon has also been reported for other brain tumors post-radiosurgery including meningiomas, metastatic tumors, vestibular schwannomas, and craniopharyngiomas.[28–32] Wowra and Stummer[33] first described this phenomenon in NFPAs with a rate of 9% in patients treated with gamma knife radiosurgery. Iwata et al[34] also described cyst enlargement in NFPAs treated with hypofractionated CK SRS at a rate of 3%. However, neither study investigated possible contributing factors or associations with the final outcomes. In the current study, there was a higher rate of transient enlargement (58.8%) for the patients who received adjuvant CK SRS. We also demonstrated a temporary volume increase in FPAs as well as in NFPAs, with a ratio of NFPAs to FPAs of about 19:1. To the best of our knowledge, this study is the first to report a temporary volume increase in FPAs. The tumors with transient enlargement had a median time to stable volumetric control of 9.2 months (range 4–32 months). This suggests that an initial volumetric progression can be predicted during this period, and that patients with initial progression do not need to undergo additional follow-up MRI before 4 months to differentiate any progressive swelling from genuine progression. We also investigated the possible contributing factors for initial tumor progression. However, none of the demographic or clinical characteristics reached statistical significance in the univariate analysis except for preoperative apoplexy (P = 0.031). We also observed increased hypointensity areas in the transiently enlarged tumors after CK SRS under gadolinium enhanced MRI (Fig. 12A–D). This implies that there is less contrast flow into the tumors, suggesting a reduction in blood flow into the tumors. The possible mechanism may be radiation-promoted hyalinization of arterioles and myointimal cell injury, which then leads to gradual myointimal proliferation and mural hyalinization, eventually resulting in small arteries and arteriolar occlusion.[35,36] Loss of blood supply (mimicking a pituitary infarct) can lead to tumor cell death and sudden tumor swelling.[37] Hence, PAs with richer vasculature (apoplexy) tend to present with temporary enlargement after CK SRS due to the more serious ischemic cell swelling after vascular occlusion. However, the issue that concerns clinicians and patients most is whether this phenomenon correlates with eventual tumor progression or recurrence. In the current study, when grouped by a binomial outcome (controlled vs. progressed), the initial volume response was not statistically significant (P = 0.162). This suggests that an immediate increase in volume after CK SRS does not indicate eventual recurrence or progression. On the other hand, an immediate decrease in volume after CK SRS does not guarantee final control or regression of the tumor. Risk factors associated with recurrence of PAs without radiotherapy have been widely studied, and include invasion of the cavernous sinus, maximum tumor diameter, absence of tumor apoplexy and hormones other than gonadotropins.[38,39] In this study, we analyzed the parameters in post-CK SRS patients including age, sex, immediate volumetric response after CK SRS, endocrine function, cavernous sinus invasion, apoplexy and baseline volume, none of which reached clinical significance after univariate analysis, which is again consistent with previous studies on the necessity of radiotherapy for tumor control.[39] CK SRS is a treatment of choice due to a high control rate and preservation of critical adjacent structures.
Figure 12.
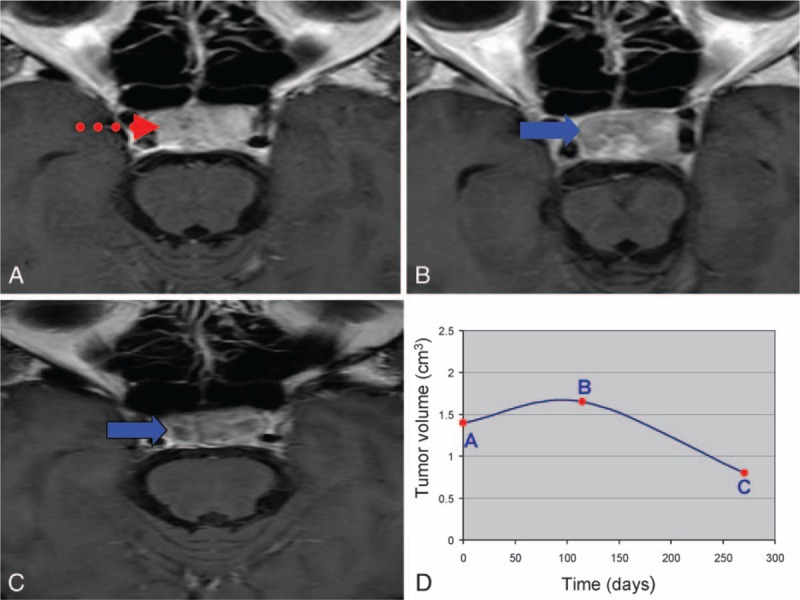
(A) Baseline magnetic resonance imaging (MRI) of pituitary adenomas before CyberKnife stereotactic radiosurgery (CK SRS). The dotted arrow indicates the contrast enhanced area. (B) Follow-up MRI at the 4th month post-CK SRS demonstrated transient progression and reduced flow of gadolinium contrast (solid arrow). (C) Follow-up MRI at the 10th month post-CK SRS demonstrated volume regression and reduced flow of gadolinium contrast (solid arrow). (D) The curve of volumetric change corresponded to different time points A, B, and C.
4.2. Exponential fitting model
Constructing applicable growth models mimicking natural tumor dynamics is an ongoing area of medical research. The Gompertzian tumor growth model, exponential growth models, and models constructed in other fashions have been widely investigated for the accuracy in simulating the natural growth of cerebral and other neoplasms around the body.[40–43] However, a model for post-radiotherapy PAs has not yet been reported. In this study, an exponential fitting model was constructed for all 34 patients with various outcomes using the tumor volume acquired via MRI and the number of days after CK SRS. The reliability of the model was then tested by comparing the estimated volume and the actual volume acquired by MRI. There was a high correlation between the two datasets (correlation efficient: 0.9 and 0.92, respectively; Tables 6 and 7). When excluding the dataset of the tumors that progressed, the fitting became better between the two datasets, suggesting better application for those with stable volume control (regressed or stable) than those with eventual progression. Based on the finding that stable tumor decay developed by 10 months post-CK SRS regardless of the initial response (median 9.2 months), we further constructed an exponential fitting model using datasets from the baseline, 4 and 10 months. Interestingly, the relative positions of the 10-month datasets of the controlled group were all located below the fitting curve except for one (31/32). In contrast, in the progressed group, the positions of the 10-month datasets were located below the curve (Table 8). This parameter was statistically significant after grouping the tumors into controlled and progressed (P = 0.005). Due to the limited number of progressed patients (n = 2), we could not conclude that a 10-month dataset above the fitting curve was a strong indicator of tumor progression or recurrence. However, a 10-month dataset below the fitting curve was potentially correlated with eventual volume control. For the exponential fitting model constructed with only 3 datasets, the relative position of the 3 points was either below-above-below (triangular) or above-below-above (inverted triangular) (Fig. 7). To investigate the fundamentals underlying this phenomenon from a mathematical point of view, we started from the process of volume change after CK SRS. The dynamic of tumor volume decay is an accelerating/decelerating process where the rate of volume change at a specific time point is the slope (S) of the actual growth curve at the specific point (St = dV/dt). According to the accelerating/decelerating process, we divided the volume change into four phases. For example, in a tumor that eventually regressed after initial enlargement after CK SRS, the tumor (V0) went through an initial progression of volume (V1) during which it actually decelerated (S0 > 0, transient swelling phase) until the rate of volume increase reached zero (assumed vertex, S1 = 0). The tumor then started to shrink in an accelerating manner (Sx < 0, fast-shrinking phase) until V2 was reached. As V2 was reached, the tumor continued to shrink in a decelerating manner (slow-shrinking phase, Sy < 0) until V3 was reached. When V3 was reached, the volume of the tumor had nearly stabilized but still kept shrinking in a decelerating manner until V4 was reached, at which point the rate of volume change was approximately zero (S4, steady phase) and the tumor had fully stabilized (Fig. 13). This model corresponded with our previous volumetric analysis in which the RVC was 0.02 cm3/mo in the first 4 months (transient swelling phase), followed by −0.17 cm3/mo at the 10th month (rapid-shrinking phase), and then −0.11 cm3/mo at the 20th month (slow-shrinking phase) and −0.06 cm3/mo at the 36th month (steady phase) after CK SRS (Fig. 14 and Table 4). As illustrated above, a patient whose V2 is located below the curve, demonstrating a below-above-below pattern, implies that tumor decay already outweighs the volume of transient swelling and the average estimated decay (V2E), where the tumor is about to enter the slow-shrinking phase, suggesting the potential of eventual volume regression/stabilization (Fig. 13). However, an exponential model is not always valid for all individual tumors, and many factors need to be considered including cell cycle time, growth fraction, availability of oxygen, cell proliferation rate, cell loss rate, and tumor-related systemic factors.[43–47] Thus, there are still some limitations in the application of an exponential model, the most apparent of which is that an exponential model reflects only a single trend (accelerating or decelerating). In a tumor with different phases of volume decay, the initial swelling phase tends to be missed, and thus the actual vertex of transient volume increase can never be estimated using the model. Another important limitation is that an exponential fitting curve constructed according to an individual patient is more likely to reflect the average tumor growth or decay rather than a “real” tumor growth curve. Thus, in the estimation of time course, there will be an “underestimated area” and an “overestimated area” that make the estimation imprecise, as shown in Fig. 13. However, in our case analysis, the application is still feasible for tumors that achieve stable control to estimate the prognosis and time course as shown by linear regression and Pearson correlation test.
Table 8.
Analysis of tumors when grouped as controlled/progressed∗.
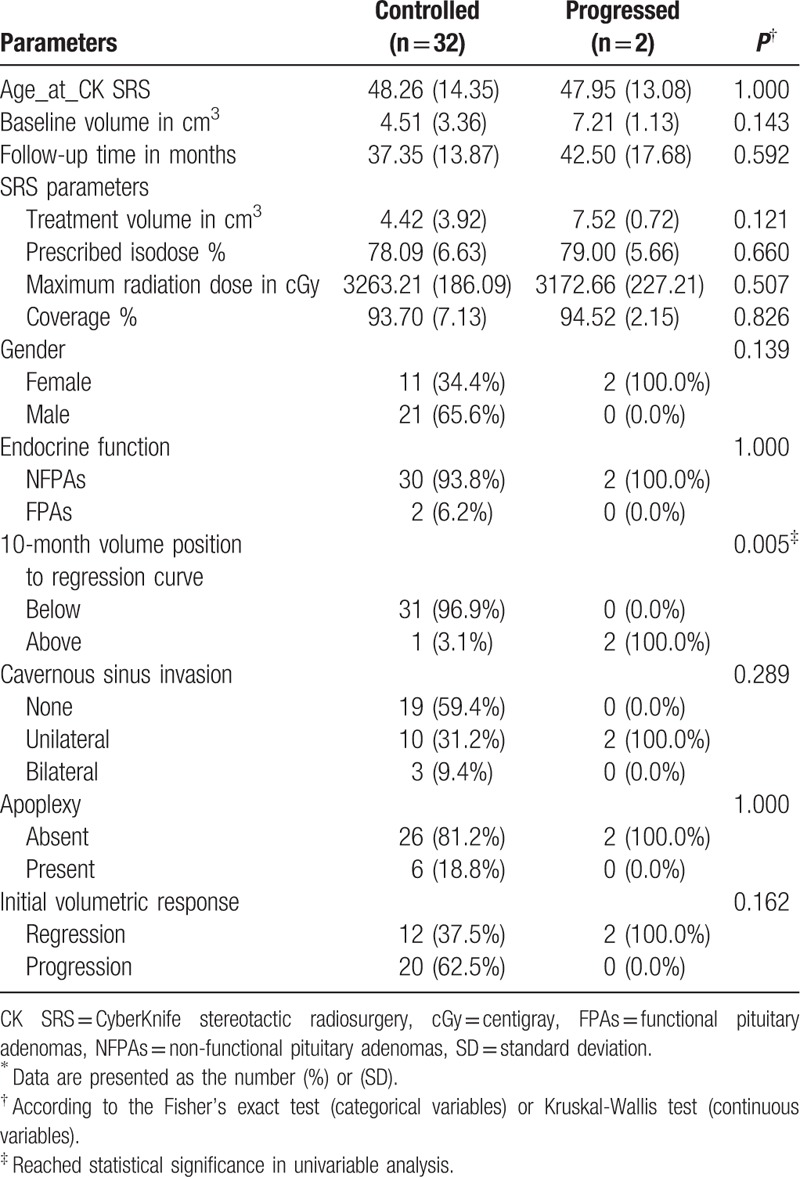
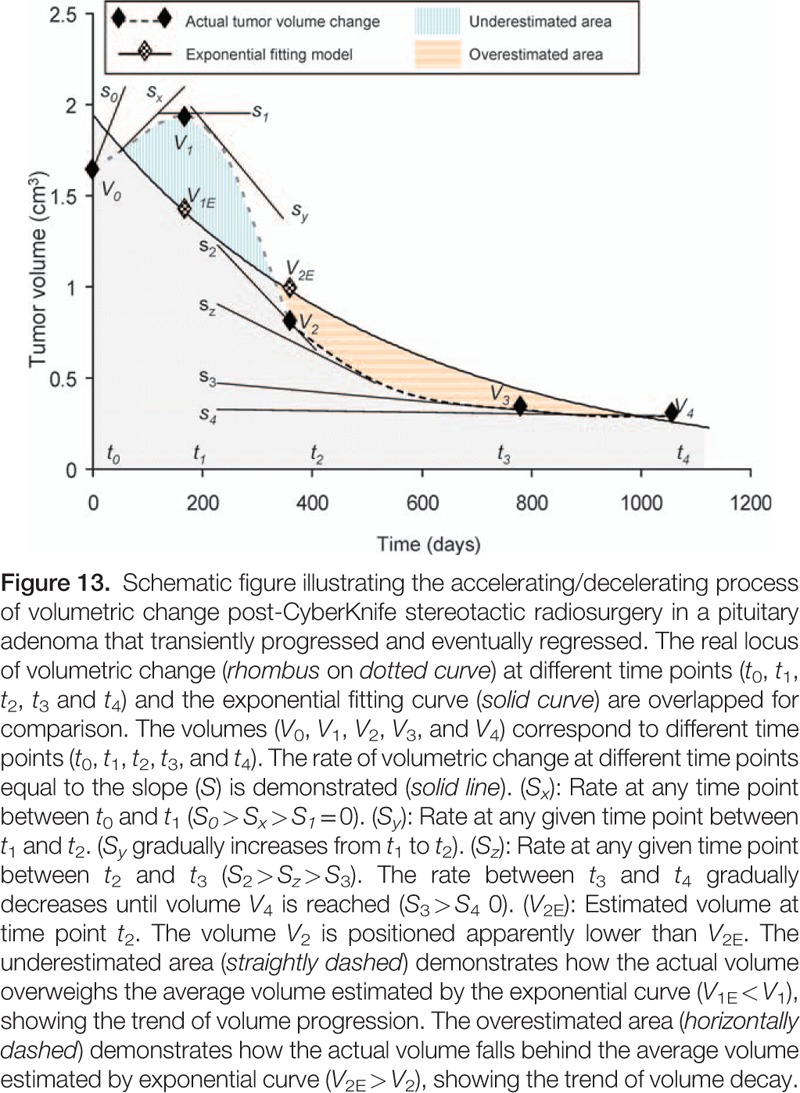
Figure 14.
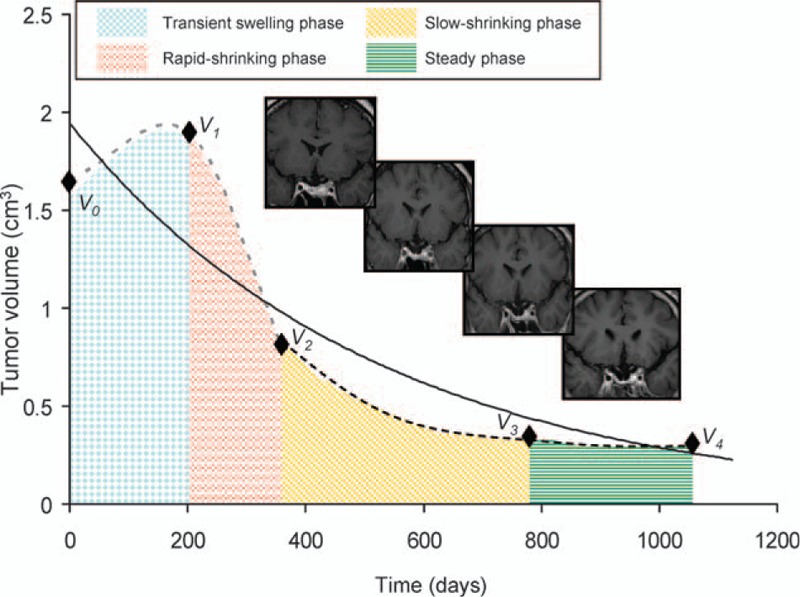
Schematic figure showing the accelerating/decelerating process of volumetric change in a pituitary adenoma that initially progressed and finally regressed. The process is divided into a transient swelling phase (checkerboard), rapid-shrinking phase (broken-lined), slow-shrinking (obliquely dashed) and steady phase (transversely dashed). Magnetic resonance images corresponding to each phase are demonstrated from left to right. In the steady phase the rate of volume change became approximately zero with time.
4.3. Study limitations
As noted above, only two patients ultimately had progression, limiting the accuracy of the time course estimation and the application of the exponential fitting model in those patients. There were also technical limitations secondary to a retrospective image analysis. Different image sequences (axial, coronal, or sagittal), slice thicknesses or doses of contrast injection can cause variability. None of these factors could be controlled retrospectively. Furthermore, an irregular shape and smaller number of slices have been correlated with increased errors.[48]
5. Conclusions
Transient swelling of PAs post-CK SRS is often seen (61.1%) in clinical practice, however this is not predictive of eventual volume regression or progression. The median time for a tumor that initially progressed to stable volume control was 9.2 months. Follow-up MRI around this time was predictive of eventual tumor control if the relative position was located below the exponential fitting curve in the three-point exponential model. An exponential decay model is also feasible to calculate the time course in tumors that are ultimately controlled.
Footnotes
Abbreviations: ΔV% = percent change in volume, CK SRS = CyberKnife stereotactic radiosurgery, FPAs = functional pituitary adenomas, MRI = magnetic resonance imaging, NFPAs = non-functional pituitary adenomas, PAs = pituitary adenomas, PRC = percent rate of change, RT = radiotherapy, RVC = rate of volume change, SD = standard deviation, V0 = baseline volume, Vfinal = final volume.
D-YH and D-TJ have contributed equally to this study.
The authors report no conflicts of interest.
Funding: Tri-Service General Hospital TSGH-C104-081, TSGH-C104-186, and TSGH-C104-008-S04.
References
- [1].Milker-Zabel S, Debus J, Thilmann C, et al. Fractionated stereotactically guided radiotherapy and radiosurgery in the treatment of functional and nonfunctional adenomas of the pituitary gland. Int J Radiat Oncol Biol Phys 2001;50:1279–86. [DOI] [PubMed] [Google Scholar]
- [2].Yoon S-C, Suh T-S, Jang H-S, et al. Clinical results of 24 pituitary macroadenomas with linac-based stereotactic radiosurgery. Int J Radiat Oncol Biol Phys 1998;41:849–53. [DOI] [PubMed] [Google Scholar]
- [3].Buurman H, Saeger W. Subclinical adenomas in postmortem pituitaries: classification and correlations to clinical data. Eur J Endocrinol 2006;154:753–8. [DOI] [PubMed] [Google Scholar]
- [4].Randeva HS, Schoebel J, Byrne J, et al. Classical pituitary apoplexy: clinical features, management and outcome. Clin Endocrinol 1999;51:181–8. [DOI] [PubMed] [Google Scholar]
- [5].Joshi SM, Hewitt RJD, Storr HL, et al. Cushing's disease in children and adolescents: 20 years of experience in a single neurosurgical center. Neurosurgery 2005;57:281–5. [DOI] [PubMed] [Google Scholar]
- [6].Laws ER, Sheehan JP, Sheehan JM, et al. Stereotactic radiosurgery for pituitary adenomas: a review of the literature. J Neurooncol 2004;69:257–72. [DOI] [PubMed] [Google Scholar]
- [7].Sheehan JP, Kondziolka D, Flickinger J, et al. Radiosurgery for residual or recurrent nonfunctioning pituitary adenoma. J Neurosurg 2002;97:408–14. [DOI] [PubMed] [Google Scholar]
- [8].Sheehan JP, Niranjan A, Sheehan JM, et al. Stereotactic radiosurgery for pituitary adenomas: an intermediate review of its safety, efficacy, and role in the neurosurgical treatment armamentarium. J Neurosurg 2005;102:678–91. [DOI] [PubMed] [Google Scholar]
- [9].Mortini P, Barzaghi R, Losa M, et al. Surgical treatment of giant pituitary adenomas: strategies and results in a series of 95 consecutive patients. Neurosurgery 2007;60:993–1004. [DOI] [PubMed] [Google Scholar]
- [10].Mortini P, Losa M, Barzaghi R, et al. Results of transsphenoidal surgery in a large series of patients with pituitary adenoma. Neurosurgery 2005;56:1222–33. [DOI] [PubMed] [Google Scholar]
- [11].Dekkers O, Pereira A, Roelfsema F, et al. Observation alone after transsphenoidal surgery for nonfunctioning pituitary macroadenoma. J Clin Endocrinol Metab 2006;91:1796–801. [DOI] [PubMed] [Google Scholar]
- [12].Ferrante E, Ferraroni M, Castrignanò T, et al. Non-functioning pituitary adenoma database: a useful resource to improve the clinical management of pituitary tumors. Eur J Endocrinol 2006;155:823–9. [DOI] [PubMed] [Google Scholar]
- [13].Greenman Y, Ouaknine G, Veshchev I, et al. Postoperative surveillance of clinically nonfunctioning pituitary macroadenomas: markers of tumour quiescence and regrowth. Clin Endocrinol 2003;58:763–9. [DOI] [PubMed] [Google Scholar]
- [14].O'Sullivan EP, Woods C, Glynn N, et al. The natural history of surgically treated but radiotherapy-naïve nonfunctioning pituitary adenomas. Clin Endocrinol 2009;71:709–14. [DOI] [PubMed] [Google Scholar]
- [15].Beauregard C, Dickstein G, Lacroix A. Classic and recent etiologies of Cushing's syndrome. Treat Endocrinol 2002;1:79–94. [DOI] [PubMed] [Google Scholar]
- [16].Jan M, Dufour H, Brue T, Jaquet P. Prolactinoma surgery. Ann Endocrinol 2007; 68:118–119. [DOI] [PubMed] [Google Scholar]
- [17].INTECH Open Access Publisher, Sharif-Alhoseini M, Laws ER, Rahimi-Movaghar V. Functioning Pituitary Adenoma. 2012. [Google Scholar]
- [18].Cho CB, Park HK, Joo WI, et al. Stereotactic radiosurgery with the CyberKnife for pituitary adenomas. Korean Neurosurg Soc 2009;45:157–63. [DOI] [PMC free article] [PubMed] [Google Scholar]
- [19].Kajiwara K, Saito K, Yoshikawa K, et al. Image-guided stereotactic radiosurgery with the CyberKnife for pituitary adenomas. Minim Invasive Neurosurg 2005;48:91–6. [DOI] [PubMed] [Google Scholar]
- [20].Peck DJ, Windham JP, Emery LL, et al. Cerebral tumor volume calculations using planimetric and eigenimage analysis. Med Phys 1996;23:2035–42. [DOI] [PubMed] [Google Scholar]
- [21].Harrison G, Kano H, Lunsford LD, et al. Quantitative tumor volumetric responses after Gamma Knife radiosurgery for meningiomas. J Neurosurg 2016;124:146–54. [DOI] [PubMed] [Google Scholar]
- [22].LLC WA. WolframAlpha; 2015. Available at: http://www.wolframalpha.com Accessed 18 March, 2014. [Google Scholar]
- [23].Marquardt DW. An algorithm for least-squares estimation of nonlinear parameters. J Soc Ind Appl Math 1963;11:431–41. [Google Scholar]
- [24].Akaike H. A new look at the statistical model identification. IEEE Trans Automat Contr 1974;19:716–23. [Google Scholar]
- [25].Schwarz G. Estimating the dimension of a model. Ann Stat 1978;6:461–4. [Google Scholar]
- [26].Pandey P, Ojha B, Mahapatra A. Pediatric pituitary adenoma: a series of 42 patients. J Clin Neurosci 2005;12:124–7. [DOI] [PubMed] [Google Scholar]
- [27].Loeffler JS, Shih HA. Radiation therapy in the management of pituitary adenomas. J Clin Endocrinol Metab 2011;96:1992–2003. [DOI] [PubMed] [Google Scholar]
- [28].Hamamoto Y, Niino K, Adachi M, et al. MR and CT findings of craniopharyngioma during and after radiation therapy. Neuroradiology 2002;44:118–22. [DOI] [PubMed] [Google Scholar]
- [29].Meijer O, Weijmans E, Knol D, et al. Tumor-volume changes after radiosurgery for vestibular schwannoma: implications for follow-up MR imaging protocol. AJNR Am J Neuroradiol 2008;29:906–10. [DOI] [PMC free article] [PubMed] [Google Scholar]
- [30].Minniti G, Saran F, Traish D, et al. Fractionated stereotactic conformal radiotherapy following conservative surgery in the control of craniopharyngiomas. Radiother Oncol 2007;82:90–5. [DOI] [PubMed] [Google Scholar]
- [31].Peterson AM, Meltzer CC, Evanson EJ, et al. MR imaging response of brain metastases after gamma knife stereotactic radiosurgery 1. Radiology 1999;211:807–14. [DOI] [PubMed] [Google Scholar]
- [32].Yu CP, Cheung JYC, Leung S, et al. Sequential volume mapping for confirmation of negative growth in vestibular schwannomas treated by gamma knife radiosurgery. J Neurosurg 2000;93:82–9. [DOI] [PubMed] [Google Scholar]
- [33].Wowra B, Stummer W. Efficacy of gamma knife radiosurgery for nonfunctioning pituitary adenomas: a quantitative follow up with magnetic resonance imaging-based volumetric analysis. J Neurosurg 2002;97:429–32. [DOI] [PubMed] [Google Scholar]
- [34].Iwata H, Sato K, Tatewaki K, et al. Hypofractionated stereotactic radiotherapy with CyberKnife for nonfunctioning pituitary adenoma: high local control with low toxicity. Neuro Oncol 2011;13:916–22. [DOI] [PMC free article] [PubMed] [Google Scholar]
- [35].O’Connor MM, Mayberg MR. Effects of radiation on cerebral vasculature: a review. Neurosurgery 2000;46:138–51. [DOI] [PubMed] [Google Scholar]
- [36].Thomas C, Di Maio S, Ma R, et al. Hearing preservation following fractionated stereotactic radiotherapy for vestibular schwannomas: prognostic implications of cochlear dose. J Neurosurg 2007;107:917–26. [DOI] [PubMed] [Google Scholar]
- [37].UCLA Pituitary Tumor Program; 2015. Available at: http://pituitary.ucla.edu/pituitary-apoplexy. Published July 21, 2015 Accessed November 22, 2015. [Google Scholar]
- [38].Brochier S, Galland F, Kujas M, et al. Factors predicting relapse of nonfunctioning pituitary macroadenomas after neurosurgery: a study of 142 patients. Eur J Endocrinol 2010;163:193–200. [DOI] [PubMed] [Google Scholar]
- [39].Losa M, Mortini P, Barzaghi R, et al. Early results of surgery in patients with nonfunctioning pituitary adenoma and analysis of the risk of tumor recurrence. J Neurosurg 2008;108:525–32. [DOI] [PubMed] [Google Scholar]
- [40].Coumans J-V, Walcott BP, Butler WE, et al. Volumetric analysis of syringomyelia following hindbrain decompression for Chiari malformation Type I: syringomyelia resolution follows exponential kinetics. Neurosurg Focus 2011;31:E4. [DOI] [PMC free article] [PubMed] [Google Scholar]
- [41].Kansal A, Torquato S, Harsh Iv G, et al. Cellular automaton of idealized brain tumor growth dynamics. Biosystems 2000;55:119–27. [DOI] [PubMed] [Google Scholar]
- [42].Mehrara E, Forssell-Aronsson E. Analysis of inter-patient variations in tumour growth rate. Theor Biol Med Model 2014;11:21. [DOI] [PMC free article] [PubMed] [Google Scholar]
- [43].Retsky M, Swartzendruber D, Wardwell R, et al. Is Gompertzian or exponential kinetics a valid description of individual human cancer growth? Med Hypothes 1990;33:95–106. [DOI] [PubMed] [Google Scholar]
- [44].Bassukas I, Maurer-Schultze B. Mechanism of growth retardation of the adenocarcinoma EO 771. Radiat Environ Biophys 1987;26:125–41. [DOI] [PubMed] [Google Scholar]
- [45].DeWys WD. Studies correlating the growth rate of a tumor and its metastases and providing evidence for tumor-related systemic growth-retarding factors. Cancer Res 1972;32:374–9. [PubMed] [Google Scholar]
- [46].Pavelic ZP, Porter CW, Allen LM, et al. Cell population kinetics of fast-and slow-growing transplantable tumors derived from spontaneous mammary tumors of the DBA/2 Ha-DD mouse. Cancer Res 1978;38:1533–8. [PubMed] [Google Scholar]
- [47].Prehn RT. The inhibition of tumor growth by tumor mass. Cancer Res 1991;51:2–4. [PubMed] [Google Scholar]
- [48].Yang D-Y, Sheehan J, Liu Y-S, et al. Analysis of factors associated with volumetric data errors in gamma knife radiosurgery. Stereotact Funct Neurosurg 2009;87:1–7. [DOI] [PubMed] [Google Scholar]


