

Abstract
Background Microvascular decompression (MVD) utilizes brainstem auditory evoked potential (BAEP) intraoperative monitoring to reduce the risk of iatrogenic hearing loss. Studies report varying efficacy and hearing loss rates during MVD with intraoperative monitoring.
Objectives This study aims to perform a comprehensive review and study of diagnostic accuracy of BAEPs during MVD to predict hearing loss in studies published from January 1984 to December 2013.
Methods The PubMed/MEDLINE and World Science databases were searched. Studies performed MVD for trigeminal neuralgia, hemifacial spasm, glossopharyngeal neuralgia or geniculate neuralgia and monitored intraoperative BAEPs to prevent hearing loss. Retrospectively, BAEP parameters were compared with postoperative hearing. The diagnostic accuracy of significant change in BAEPs, which includes loss of response, was tested using summary receiver operative curve and diagnostic odds ratio (DOR).
Results A total of 13 studies were included in the analysis with a total of 2,540 cases. Loss of response pooled sensitivity, specificity, and DOR with 95% confidence interval being 74% (60–84%), 98% (88–100%), and 69.3 (18.2–263%), respectively. The similar significant change results were 88% (77–94%), 63% (40–81%), and 9.1 (3.9–21.6%).
Conclusion Patients with hearing loss after MVD are more likely to have shown loss of BAEP responses intraoperatively. Loss of responses has high specificity in evaluating hearing loss. Patients undergoing MVD should have BAEP monitoring to prevent hearing loss.
Keywords: evoked potentials, auditory, brainstem, hemifacial spasm, trigeminal neuralgia, glossopharyngeal nerve diseases, hearing loss
Introduction
Microvascular decompression (MVD) successfully treats trigeminal neuralgia (TGN), hemifacial spasm (HFS), glossopharyngeal neuralgia (GPN), and geniculate neuralgia (GN) by relieving root exit zone) vascular compression on cranial nerve (CN) V, CN VII, CN IX, and the nervous intermedius.1 2 3 The retraction at the cerebellopontine angle or brainstem ischemia damages CN VIII leading to postoperative hearing loss (HL)4 at a rate of 1 to 23.8%.2 5 6 7 Monitoring intraoperative brainstem auditory evoked potential (BAEP) reduces postoperative CN VIII morbidity and remains the most effective method to prevent HL during MVD.8 The American Clinical Neurophysiology Society (ACNS) and American Society of Neurophysiological Monitoring recommend alerting the surgeon when significant changes (SCs) in BAEPs occur to prevent HL. SCs happen when wave V latency increases ≥ 1.0 ms and/or amplitude decreases ≥ 50%.9 10 Currently, no pharmacological therapeutic options are available to treat the patients based on BAEP changes. Our primary objective is to perform a comprehensive systematic review of published studies to evaluate the diagnostic accuracy of BAEP during MVD to predict HL. We calculated the sensitivity, specificity, diagnostic odds ratio (DOR), and summary receiver operating curves (SROC) to quantify diagnostic accuracy. The secondary objective was to assess heterogeneity amongst studies qualitatively using Quality assessment of diagnostic accuracy studies-2 (QUADAS-2) and quantitatively using I2. This information will establish BAEPs are a real-time biomarker of HL during MVD.
Methods
Literature Search and Strategy
The Preferred Reporting Items for Systematic Reviews and Meta-Analyses (PRISMA) guidelines for a meta-analysis were followed. The PubMed/MEDLINE and World Science databases were searched systematically for articles using BAEPs to detect HL after MVD. Eligible studies were published through February 14, 2014. The following keywords and Boolean operators were used: “auditory evoked response, auditory evoked potentials, brainstem auditory evoked potentials, brainstem auditory evoked response, intraoperative monitoring, or intraoperative neurophysiological monitoring” and “microvascular decompression, or MVD” and “hemifacial spasm, HFS, trigeminal neuralgia, TGN, tic douloureux, geniculate neuralgia, GN, nervus intermedius neuralgia, or glossopharyngeal neuralgia.” Found article's reference lists were cross-checked for additional articles. We specified search, inclusion, and exclusion criteria a priori. Two investigators independently extracted data to minimize and prevent sources of bias common in observational studies.11
Study Selection
Included studies were randomized controlled trials, prospective or retrospective cohort reviews using BAEPs. All studies report hearing outcomes. The most detailed study data, or most recently published article, were chosen if studies presented duplicate data so that all cases were distinct. Excluded from this study are reviews, case reports, comments, editorials, and letters which did not report raw data. All studies with a diagnosis of HL not directly related to MVD surgery were excluded. All studies were published in English. Exclusion of non-English studies likely had no effect on the core findings and this criterion was adopted only for practical reasons with no intended bias toward international studies. Study participants were ≥ 18 years of age.
Target Conditions
TGN presents as intense pain on the ipsilateral side of the face. HFS presents as tonic and clonic contractions of the muscles innervated by the facial nerve. GPN patients suffer from severe nervous pain in the tongue, throat, ear, and tonsils. GN patients have severe pain in the deep ear, which may radiate outwards.
Data Extraction and Analysis
Two investigators (P. D. T. and G. C. C.) independently extracted relevant data from selected articles on the design and results of each study using a standardized form, which included first authors, year of publication, study population, region, BAEP use method, hearing evaluation, and methods quality. A final list of articles that met the study inclusion criteria for both the investigators was assembled. Our primary outcome for the study was HL 0 to 90 days postoperatively. We evaluated the BAEP changes during MVD to predict HL, the outcomes recorded from the studies.
We extracted data on the number of: True positives (TP), patients with postoperative HL and loss of response (LR) in intraoperative BAEPs; false negatives (FN), patients with HL, but normal BAEPs; true negatives (TN), patients without HL and normal BAEPs; false positives (FP), patients without HL but with abnormal BAEPs.
The data were used to construct 2 × 2 tables. For each individual study, sensitivity and specificity BAEP changes to identify HL were calculated after categorizing patients into no change, and LR or SCs. In all studies, the threshold for LR was defined as a 100% Amplitude of Wave V (AwV) loss. Our previous study categorized BAEP changes with significant benefits to sensitivity and specificity.12 Categorical discrimination was used because BAEP waveform latency and amplitude dynamically change during MVD, secondary to the degree of retraction and/or compression affecting the auditory nerve or its vasculature. Individual study's definition of the SC threshold was treated as valid. Studies using a threshold above the lowest value used by any study were not retroactively parsed.
Hearing Loss
Hearing loss was defined in several different ways among studies. Most studies used pre- and postoperative pure tone audiometry and/or speech discrimination scores (SDS) to determine HL. Bond et al (2010) used patient self-reporting to classify HL and Huang et al (2009) did not specify how they determined HL; in both cases, no HL was reported. Audiometric testing was not always stated as conducted by an audiologist, and in these cases, no reference to who conducted the testing was given. These two studies were excluded from the quantitative analysis. When a time frame was reported, testing occurred 2 to 90 days preoperatively and 0 to 90 days postoperatively. Among studies that reported a cutoff value for HL, the absolute value varied from 20 to 50 dB for pure tone audiometry (PTA) scores and 20 to 50% of SDS.
Assessment of Methodological Quality
The review authors used the QUADAS-2 tool to assess the included studies' susceptibility to bias.13 The QUADAS-2 tool assessed four domains: patient selection, index test, reference standard, and flow and timing. Patient selection refers to avoiding nonconsecutive or nonrandom sampling, case–control, or inappropriate exclusion. The index test refers to BAEP monitoring, which indicates continuous BAEP recording during MVD. The reference standard refers to proper testing for HL, which indicates pre- and postoperative audiogram testing. Flow and timing refer to the interval between the index and reference tests, whether all patients received the same reference test, and whether all patients were included in the analysis. If the answers to all signaling questions in a domain are “yes” then the “low” risk grade is given. If the answer to any signaling question is “no” then a “high” risk grade is given. The “unclear” category was only used where the reported data was insufficient to permit a judgment. The methodological quality of the included studies was assessed independently by two review authors and disagreement was resolved by reexamination of the primary literature.
Statistical Analysis
We used Stata 13 for the statistical analyses (Stata statistical software: release 13, StataCorp LP, College Station, Texas, United States). All p values were set at p = 0.05. The primary analysis of this review was to fit the data into a hierarchical SROC (HSROC) model using the bivariate model, which has been demonstrated to yield useful summary measures of diagnostic test performance.14 We were also able to obtain area under the receiver operating curve (AUROC), pooled sensitivity, and pooled sensitivity through the same bivariate model used in generating the HSROC. For pooled estimates of DOR, we used the Der-Simonian Laird random effects meta-analysis. A Fagan nomogram was constructed to assess the positive likelihood ratio (+LR), negative likelihood ratio (−LR), positive posterior probability, and negative posterior probability.
We did not include datasets in the pooled analysis if either TP + FN = 0 or TN + FP = 0, because it was not possible to accurately estimate sensitivity or specificity. In other instances, we corrected zero cell counts by adding a 0.5 continuity correction to the study data.
Heterogeneity
The amount of heterogeneity between the included studies was quantified with the I2 statistic. In general, I2 (> 50%) shows that there is substantial variability or inconsistency in the results amongst the whole set of studies, whereas I2 (< 50%) shows the included studies had consistent findings.
Results
Study Selection and Characteristics
The electronic search yielded a total of 121 publications (Fig. 1). We rejected 94 publications as they did not meet the inclusion criteria. Of the two authors who screened the results, one author selected 25 studies for potential inclusion and one author selected 40 studies. After discrepancies were discussed, the full-text copies of 27 studies were included. Of these, 14 studies were excluded for reasons stated in the flow diagram (Fig. 1) and 13 studies met the inclusion criteria for our review since they used an appropriate index and reference test in patients having MVD surgery.
Fig. 1.

Results from searching studies for inclusion in the review.
Risk of Bias within Studies and Results of Individual Studies
Radtke and colleagues (1991) included 151 unmonitored patients, which made their selection of monitored patients, used in our meta-analysis, unclear.8 Patient selection had a high risk of bias in Sindou et al (1992) due to nonrandom or consecutive sampling of patients.15 One study had a high patient applicability concern because some patients in the analysis did not undergo MVD.16 Seven out of 13 studies had a high-risk index test because they did not specify a threshold or a cutoff value for significant BAEP changes before surgery.3 5 8 17 18 19 20 One study had a high applicability concern because not all patients received intraoperative monitoring.8 The hearing evaluation risk of bias was unclear in three studies because no cutoff value in PTA scores or SDS was used to classify HL.5 18 21 The hearing evaluation risk of bias was high in two studies because they evaluated HL clinically, or did not specify their method.15 16 The hearing evaluation applicability was unclear in two studies because HL criteria was not reported as PTA or SDS.18 21 The hearing evaluation applicability was of high concern in one study because patients subjectively requested auditory tests.8 Flow and timing had an unclear risk in two studies5 18 and a high risk of bias in four studies.15 16 17 21 The high risk was due to three studies that did not include all patients in their analysis and one that did not give a hearing evaluation to all patients. Only Thirumala et al (2014) adopted the diagnostic accuracy paradigm in their analysis and the other studies used individual cases to show BAEP change's correlation to postoperative HL. Methodological quality is presented in Table 1. Characteristics of included studies are presented in Tables 2 and 3.
Table 1. Summary of methodological quality.
| Study | Risk of bias | Applicability concerns | |||||
|---|---|---|---|---|---|---|---|
| Patient selection | Index test | Reference standard | Flow and timing | Patient selection | Index test | Reference standard | |
| Bond et al (2010) |

|
|

|

|
|
|
|
| Bricolo et al (2004) |
|
|
|
|
|
|
|
| Brock et al (2004) |
|
|
|
|
|
|
|
| Huang et al (2009) |
|
|
|
|
|
|
|
| James et al (2005) |
|
|
|
|
|
|
|
| Jo et al (2011) |
|
|
|
|
|
|
|
| Jo et al (2013) |
|
|
|
|
|
|
|
| Lee et al (2009) |
|
|
|
|
|
|
|
| Ramnarayan et al (2006) |
|
|
|
|
|
|
|
| Rizvi et al (1999) |
|
|
|
|
|
|
|
| Radtke and colleagues (1991) |
|
|
|
|
|
|
|
| Sindou et al (1992) |
|
|
|
|
|
|
|
| Thirumala et al (2014) |
|
|
|
|
|
|
|
Note: Green, low; red, high; yellow, unclear.
Table 2. Study profile and characteristics.
| Study | Study design | Condition | Alarm criteria | HL criteria | Baseline BAEP | Length of follow-up |
|---|---|---|---|---|---|---|
| Bond et al (2010) | Retrospective cohort | TGN | Yes, transient changes of absolute or IPL in excess of 10% baseline value | Self-reporting | Yes (after anesthesia) | Not stated |
| Bricolo et al (2004) | Retrospective cohort | HFS | Yes, > 0.5 ms delay in the peak of wave V, or if there were marked changes in amplitude or form of wave I or V | Mild 26–40 dB, moderate 41–55 dB, intermediate 56–70 dB, severe 71–90 dB, profound > 90 dB | Yes (after anesthesia) | Before discharge |
| Brock et al (2004) | Retrospective cohort | TGN | No, scores were considered abnormal if the IPL exceeded baseline by 2.5 standard deviations | Slight 20–30 dB, moderate 35–40 dB, severe hypoacusia or anacusia | Yes, (after anesthesia) | Not stated |
| Huang et al (2009) | Retrospective cohort | HFS | No, > 50% wave V amplitude decrease | Not stated | Yes (after anesthesia) | Not stated |
| James et al (2005) | Retrospective cohort | HFS/TGN/CPA surgery | Yes, a 1.0 ms latency increase or 50% amplitude decrease of wave V | PTA cutoff 50 dB, SDS cutoff 50% | Yes (after anesthesia) | Immediately postoperative and upon discharge |
| Jo et al (2011) | Retrospective cohort | HFS | Yes, a 1.0 ms latency increase or 50% amplitude decrease of wave V | PTA cutoff 15 dB, SDS > 20% | Yes (before anesthesia) | 3–10 d postoperative |
| Jo et al (2013) | Retrospective cohort | HFS | No, > 0.5 ms delay in the peak of wave V, or if there were marked changes in amplitude or form of wave I or V | PTA cutoff 15 dB, SDS > 20% | Yes (before anesthesia) | 2–13 d postoperative |
| Lee et al (2009) | Retrospective cohort | HFS | No, 0.4 ms (watch), 0.6 ms (warn), 1.0 ms (critical) wave V latency delay, and a 50% amplitude reduction with a latency increase | Cutoff > 25 dB | Yes (after anesthesia) | 3–10 d postoperative |
| Ramnarayan et al (2006) | Retrospective cohort | TGN | No, greater than three standard deviations over the normal mean value latency of wave V (4.77 ± 0.23 ms) | > 20 dB | Yes (after anesthesia) | 48 h |
| Rizvi et al (1999) | Retrospective cohort | TGN | No, increase in IPL of 1.5 ms or an increase more than three standard deviations | No cutoff value, given distribution shows no major changes | Yes (after anesthesia) | N/A |
| Radtke and colleagues (1991) | Retrospective cohort | HFS,TGN | No, wave V latency increase ≥ 1.0 ms or rapid changes > 0.1 ms/min | > 30 dB | Yes (before anesthesia) | Immediately postoperative and 1 mo out |
| Sindou et al (1992) | Retrospective cohort | HFS,TGN | Yes, 1 ms in 10 min or drastic modification, for voltage a decrease in amplitude of wave V > 50% | > 20 dB | Yes (after anesthesia) | Immediately postoperative |
| Thirumala et al (2014) | Retrospective cohort | HFS,TGN,GN,GPN | Yes, a 1.0 ms latency increase or 50% amplitude decrease of wave V | < 50% SDS. > 50 dB PTA | Yes (after anesthesia) | 1–90 d postoperatively |
Abbreviations: BAEP, brainstem auditory evoked potential; CPA, cerbello pontine angle; GN, geniculate neuralgia; GPN, glossopharyngeal neuralgia; HFS, hemifacial spasm; IPL, interpeak latency; N/A, not applicable; PTA, pure tone audiometry; SDS, speech discrimination score; TGN, trigeminal neuralgia.
Table 3. Patient demographics.
| Study | Sample size for analysis | Patient age (average) | Hearing loss | No monitoring | No changes (HL/total) |
Significant changes (HL/total) |
Loss of response (HL/total) |
|---|---|---|---|---|---|---|---|
| Bond et al (2010) | 119 | 60 | 0 | 0 | 0/110 | 0/9 | 0/0 |
| Bricolo et al (2004) | 84 | 53 | 9 | 0 | 1/43 | 3/19 | 5/22 |
| Brock et al (2004) | 45 | 55.5 | 8 | 3 | 1/18 | 3/19 | 4/5 |
| Huang et al (2009) | 36 | N/A | 0 | 0 | 0/33 | 0/1 | 0/2 |
| James et al (2005) | 130 | N/A | 3 | 0 | 0/78 | 1/22 | 2/30 |
| Jo et al (2011) | 1,156 | 48.7 | 46 | 0 | 22/876 | 12/268 | 12/12 |
| Jo et al (2013) | 331 | N/A | 4 | 0 | 1/324 | 1/3 | 2/4 |
| Lee et al (2009) | 22 | 61 | 3 | 0 | 0/8 | 2/8 | 1/6 |
| Ramnarayan et al (2006) | 75 | N/A | 9 | 0 | 0/50 | 7/12 | 2/13 |
| Rizvi et al (1999) | 9 | N/A | 4 | 0 | 0/3 | 3/3 | 1/3 |
| Radtke and colleagues (1991) | 261 | 53.9 | 9 | 152 | 3/68 | 2/26 | 4/15 |
| Sindou et al (1992) | 34 | 51 | 8 | 0 | 2/4 | 1/10 | 5/20 |
| Thirumala et al (2014) | 238 | 52.41 | 21 | 0 | 2/154 | 5/49 | 14/35 |
| Total | 2,540 | 51 | 124 | 155 | 32/1,772 | 40/446 | 52/167 |
Abbreviations: BAEP, brainstem auditory evoked potential; HL, hearing loss; N/A, not applicable.
Note: A N/A indicates data was not collected on age. For BAEP changes, a line of—indicates data was not recorded. Several studies did not comment on transient losses and their difference from significant changes or permanent loss. In the studies by Bond et al (2010) and Huang et al (2009), no change in BAEP was recorded and therefore there can be no discrimination between BAEP change categories.
Synthesis of Results and Risk of Bias
The total incidence of HL in our study is 4.88%. The incidence of HL was 1.81% in patients with no change to BAEPs, 15.01% with any changes (92/613), 8.97% with SCs (40/446), and 31.14% with LR (52/167). These values can be deduced from Table 3. Alarm criteria were specified before surgery in six studies and in the seven others were determined during the course of study (Table 2).
The first analysis was loss of BAEP responses and their relationship with HL (10 studies). The I2 value was 63%. Study sensitivities ranged from 50 to 90%, and specificities ranged from 44 to 100%. Combining data from all studies using the bivariate model, loss of BAEP response exhibited strong specificity (average 95% confidence interval [CI]: 98% [88, 100%]) but weaker sensitivity (average 95% CI: 74% [60, 84%]). There was substantial heterogeneity in the whole dataset (I2 = 94%). A graph of the estimated SROC along with the summary point, 95% confidence ellipse, and prediction ellipse for BAEPs is shown in Fig. 2A. The AUROC was 0.81 (0.78–0.84), showing that detecting loss of BAEP response had a good discriminant ability between those with and without HL. A pooled random effects estimate of the DOR for individual studies of patients with HL with loss of BAEP response was 69.3 (18.2–263).
Fig. 2.

SROC for HL in (A) patients with loss of BAEP response and (B) patients with a significant change of BAEP response. The size of the study estimate circle indicates study effect size. The larger circle indicates the combined effects of all studies. BAEP, brainstem auditory evoked potential; HL, hearing loss; SROC, summary receiver operator curve.
The second analysis was loss of BAEP response or SCs (LR + SC) and their relationship with HL (11 studies). The I2 value was 42%. Study sensitivities ranged from 67 to 91%, and specificities ranged from 14 to 99%. Combining data from all studies using the bivariate model, loss of BAEP response or SC exhibited strong sensitivity (average 95% CI: 88% [77, 94%]) but weaker specificity (average 95% CI: 63% [40, 81%]). There was substantial heterogeneity in the whole dataset (I2 = 86%). A graph of the estimated SROC along with the summary point, 95% confidence ellipse, and prediction ellipse for BAEP is shown in Fig. 2B. Overall, the AUROC was 0.88 (0.85–0.91), showing that detecting loss of BAEP response or SCs had a good discriminant ability between those with and without HL. A pooled random effects estimate of the DOR for individual studies of patients with HL with loss of BAEP response or SC was 9.1 (3.9–21.6).
Additional Analysis
The Fagan nomogram (Fig. 3) calculates the +LR and −LR of BAEP HL predictions for LR (Fig. 3A) and SC + LR (Fig. 3B). All data are reported with a 95% CI. For LR, the data indicated reliable posttest predictability with a positive likelihood of greater than 1 (8.24 [6.27, 11]) and low negative likelihood of less than 1 (0.61 [0.53, 0.71]). The positive posterior probability was 31% (26, 38%) and the negative posterior probability was 3% (3, 4%). For SC + LR, data indicated reliable posttest predictability with a positive likelihood of greater than 1 (3.22 [2.83, 3.66]) and low negative likelihood of less than 1 (0.34 [0.25, 0.54]). The positive posterior probability was 15% (13, 17%) and the negative posterior probability was 2% (1, 2%).
Fig. 3.
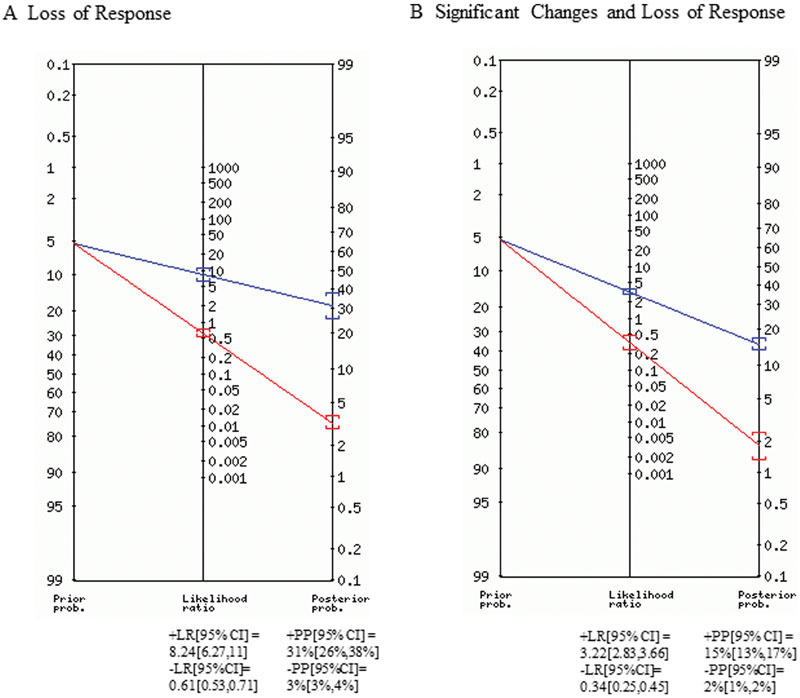
Fagan nomogram. The blue line represents positive tests. The red line indicates negative tests. All data are reported with 95% confidence intervals. +LR, positive likelihood ratio; −LR, negative likelihood ratio; +PP, positive posterior probability; −PP, negative posterior probability.
Discussion
LR is used in practice to recognize patients at a high risk for HL. Patients who experience HL are 69 times more likely to have sustained an intraoperative loss of the BAEP response according to the DOR. The pooled specificity across studies was high (98%) but the sensitivity was low (74%) of BAEPs in evaluating HL after MVD. We classified patients who had changes in BAEPs but no HL as false positives contributing to the lower sensitivity. Loss of BAEP response is often associated with excessive retraction of CN VIII. Increasing CN VIII axons' stretch causes wave form temporal dispersion and subsequently a loss of amplitude.22 However, if the stretch is reversible, the BAEP responses could be restored without significant histological changes similar to stretch in experimental peripheral nerves.
Experimental stresses on peripheral nerve for a prolonged time lead to histological changes and nerve injury.23 24 As a corollary, increasing CN VIII axons' stretch causes loss of amplitude.22 Brainstem or CN VIII blood flow changes, or direct trauma to the CN may also cause BAEP response loss,23 24 25 26 leading possibly to faster and irreversible changes. The higher specificity of HL in patients with BAEP loss indicates that, in some patients, recovery of BAEPs is desirable but not always achievable. Our results indicate that a loss of BAEP response can occur without loss of auditory function. Transient stretching of a peripheral nerve can result in temporal dispersion with or without conduction block resulting in a drop in amplitude of the response. These processes may have delayed recovery or degradation and may not be detected during the course of surgery.27 28
SCs in the latency and amplitude of BAEPs during MVD are used in practice as an alarm so that the surgeon can be aware of the changing auditory nerve function. Patients who experience HL are nine times more likely to have sustained an intraoperative change (SC and LR) in BAEP response during MVD. The pooled sensitivity was higher as compared with LR, 88 versus 74 respectively. To prevent HL, we need a good alarm criterion which is sensitive and can be communicated to the surgical team during MVD. The current ACNS guidelines recommend as an alarm ≥ 1.0 ms or ≥ 10% increase in latency of wave V and/or a decrease in the amplitude ≥ 50%.9 10 In this review, three studies alerted the surgeon at a > 0.5 ms latency delay, three used some standard deviation in latency from baseline, and the majority adopted the recommended guidelines. The varied alarm criteria adopted in clinical practice may have to be robustly evaluated to improve sensitivity. Our study found that both SC + LR and LR have +LR greater than one and −LR less than one. The +LR was higher for LR, indicating its value in predicting postoperative deficits. The –LR was higher for SC + LR, indicating its value for preventing postoperative deficits. The postoperative probability was increased from 5% in LR and SC + LR to 31 and 15%, respectively.
The overall incidence of HL in our study was 2.20%. Technical issues such as anesthetic technique, temperature of the eighth cranial nerve, lead displacement, or dislodging of the sound generator in the ear canal may cause changes in BSERs which do not reflect hearing changes and add variability to all studies. The study by Jo et al provides 1,156/2,540 patients in the study sample which includes the results of other studies in the ROC analysis. Qualitative review and individual details of published studies is included to assuage this occlusion.
Although the current study showed strengths based on a comprehensive literature review, with quality assessment using the QUADAS-2, there are several limitations that must be addressed. Most importantly, owing to study design, our analysis is at risk of publication bias because of dependence on currently published data on the topic of investigation. Another major limitation is substantial heterogeneity in the findings of the individual studies, as evidenced by the wide variations in the sensitivities and specificities obtained. Because of high heterogeneity, a funnel plot could not be constructed. Moreover, “zero” event cells were not uncommon within this set of studies, and this precluded from reliably analyzing a few of the published studies.
Conclusions
Intraoperative of BAEPs changes are highly specific in predicting HL after MVD. Lower sensitivity is due to the therapeutic surgical pause in the MVD in response to changes in BAEPs. A loss of BAEPs during the procedure can be a specific, biomarker of perioperative HL. Patients undergoing MVD should have BAEP monitoring to prevent HL.
Acknowledgment
None.
Footnotes
Study Funding No targeted funding reported. Disclosure The authors report no disclosures relevant to the article. The statistical analysis was completed by Yoon Loke, a statistician associated with the University of East Anglia, Norwich, Norfolk, United Kingdom.
References
- 1.Acevedo J C Sindou M Fischer C Vial C Microvascular decompression for the treatment of hemifacial spasm. Retrospective study of a consecutive series of 75 operated patients—electrophysiologic and anatomical surgical analysis Stereotact Funct Neurosurg 199768(1-4 Pt 1):260–265. [DOI] [PubMed] [Google Scholar]
- 2.Patel A Kassam A Horowitz M Chang Y F Microvascular decompression in the management of glossopharyngeal neuralgia: analysis of 217 cases Neurosurgery 2002504705–710., discussion 710–711 [DOI] [PubMed] [Google Scholar]
- 3.Ramnarayan R, Mackenzie I. Brain-stem auditory evoked responses during microvascular decompression for trigeminal neuralgia: predicting post-operative hearing loss. Neurol India. 2006;54(3):250–254. doi: 10.4103/0028-3886.27146. [DOI] [PubMed] [Google Scholar]
- 4.Little J R, Lesser R P, Lueders H, Furlan A J. Brain stem auditory evoked potentials in posterior circulation surgery. Neurosurgery. 1983;12(5):496–502. doi: 10.1227/00006123-198305000-00003. [DOI] [PubMed] [Google Scholar]
- 5.Rizvi S S, Goyal R N, Calder H B. Hearing preservation in microvascular decompression for trigeminal neuralgia. Laryngoscope. 1999;109(4):591–594. doi: 10.1097/00005537-199904000-00013. [DOI] [PubMed] [Google Scholar]
- 6.Shah A, Nikonow T, Thirumala P. et al. Hearing outcomes following microvascular decompression for hemifacial spasm. Clin Neurol Neurosurg. 2012;114(6):673–677. doi: 10.1016/j.clineuro.2012.01.016. [DOI] [PubMed] [Google Scholar]
- 7.Rupa V, Saunders R L, Weider D J. Geniculate neuralgia: the surgical management of primary otalgia. J Neurosurg. 1991;75(4):505–511. doi: 10.3171/jns.1991.75.4.0505. [DOI] [PubMed] [Google Scholar]
- 8.Wilkins R H, Radtke R A, Erwin C W. Value of intraoperative brainstem auditory evoked potential monitoring in reducing the auditory morbidity associated with microvascular decompression of cranial nerves. Skull Base Surg. 1991;1(2):106–109. doi: 10.1055/s-2008-1056989. [DOI] [PMC free article] [PubMed] [Google Scholar]
- 9.Martin W H, Stecker M M. ASNM position statement: intraoperative monitoring of auditory evoked potentials. J Clin Monit Comput. 2008;22(1):75–85. doi: 10.1007/s10877-007-9108-6. [DOI] [PubMed] [Google Scholar]
- 10.American Electroencephalographic Society . Guideline eleven: guidelines for intraoperative monitoring of sensory evoked potentials. J Clin Neurophysiol. 1994;11(1):77–87. [PubMed] [Google Scholar]
- 11.Simunovic N, Sprague S, Bhandari M. Methodological issues in systematic reviews and meta-analyses of observational studies in orthopaedic research. J Bone Joint Surg Am. 2009;91 03:87–94. doi: 10.2106/JBJS.H.01576. [DOI] [PMC free article] [PubMed] [Google Scholar]
- 12.Thirumala P D, Carnovale G, Habeych M E, Crammond D J, Balzer J R. Diagnostic accuracy of brainstem auditory evoked potentials during microvascular decompression. Neurology. 2014;83(19):1747–1752. doi: 10.1212/WNL.0000000000000961. [DOI] [PubMed] [Google Scholar]
- 13.Whiting P F, Rutjes A W, Westwood M E. et al. QUADAS-2: a revised tool for the quality assessment of diagnostic accuracy studies. Ann Intern Med. 2011;155(8):529–536. doi: 10.7326/0003-4819-155-8-201110180-00009. [DOI] [PubMed] [Google Scholar]
- 14.Reitsma J B, Glas A S, Rutjes A W, Scholten R J, Bossuyt P M, Zwinderman A H. Bivariate analysis of sensitivity and specificity produces informative summary measures in diagnostic reviews. J Clin Epidemiol. 2005;58(10):982–990. doi: 10.1016/j.jclinepi.2005.02.022. [DOI] [PubMed] [Google Scholar]
- 15.Sindou M, Fobé J L, Ciriano D, Fischer C. Hearing prognosis and intraoperative guidance of brainstem auditory evoked potential in microvascular decompression. Laryngoscope. 1992;102(6):678–682. doi: 10.1288/00005537-199206000-00014. [DOI] [PubMed] [Google Scholar]
- 16.James M L, Husain A M. Brainstem auditory evoked potential monitoring: when is change in wave V significant? Neurology. 2005;65(10):1551–1555. doi: 10.1212/01.wnl.0000184481.75412.2b. [DOI] [PubMed] [Google Scholar]
- 17.Brock S Scaioli V Ferroli P Broggi G Neurovascular decompression in trigeminal neuralgia: role of intraoperative neurophysiological monitoring in the learning period Stereotact Funct Neurosurg 200482(5–6):199–206. [DOI] [PubMed] [Google Scholar]
- 18.Huang B R, Chang C N, Hsu J C. Intraoperative electrophysiological monitoring in microvascular decompression for hemifacial spasm. J Clin Neurosci. 2009;16(2):209–213. doi: 10.1016/j.jocn.2008.04.016. [DOI] [PubMed] [Google Scholar]
- 19.Jo K WL, Lee J A, Park K, Cho Y S. A new possible mechanism of hearing loss after microvascular decompression for hemifacial spasm. Otol Neurotol. 2013;34(7):1247–1252. doi: 10.1097/MAO.0b013e31829b5786. [DOI] [PubMed] [Google Scholar]
- 20.Lee S H, Song D G, Kim S, Lee J H, Kang D G. Results of auditory brainstem response monitoring of microvascular decompression: a prospective study of 22 patients with hemifacial spasm. Laryngoscope. 2009;119(10):1887–1892. doi: 10.1002/lary.20605. [DOI] [PubMed] [Google Scholar]
- 21.Bond A E, Zada G, Gonzalez A A, Hansen C, Giannotta S L. Operative strategies for minimizing hearing loss and other major complications associated with microvascular decompression for trigeminal neuralgia. World Neurosurg. 2010;74(1):172–177. doi: 10.1016/j.wneu.2010.05.001. [DOI] [PubMed] [Google Scholar]
- 22.Li J, Shi R. Stretch-induced nerve conduction deficits in guinea pig ex vivo nerve. J Biomech. 2007;40(3):569–578. doi: 10.1016/j.jbiomech.2006.02.009. [DOI] [PubMed] [Google Scholar]
- 23.Ogata K, Naito M. Blood flow of peripheral nerve effects of dissection, stretching and compression. J Hand Surg [Br] 1986;11(1):10–14. doi: 10.1016/0266-7681(86)90003-3. [DOI] [PubMed] [Google Scholar]
- 24.Wall E J, Massie J B, Kwan M K, Rydevik B L, Myers R R, Garfin S R. Experimental stretch neuropathy. Changes in nerve conduction under tension. J Bone Joint Surg Br. 1992;74(1):126–129. doi: 10.1302/0301-620X.74B1.1732240. [DOI] [PubMed] [Google Scholar]
- 25.Baik M W, Branston N M, Bentivoglio P, Symon L. The effects of experimental brain-stem ischaemia on brain-stem auditory evoked potentials in primates. Electroencephalogr Clin Neurophysiol. 1990;75(5):433–443. doi: 10.1016/0013-4694(90)90088-2. [DOI] [PubMed] [Google Scholar]
- 26.Lin C D, Wei I H, Tsai M H. et al. Changes in guinea pig cochlea after transient cochlear ischemia. Neuroreport. 2010;21(15):968–975. doi: 10.1097/WNR.0b013e32833da3c3. [DOI] [PubMed] [Google Scholar]
- 27.Harner S G, Harper C M, Beatty C W, Litchy W J, Ebersold M J. Far-field auditory brainstem response in neurotologic surgery. Am J Otol. 1996;17(1):150–153. [PubMed] [Google Scholar]
- 28.Nadol J B Jr, Chiong C M, Ojemann R G. et al. Preservation of hearing and facial nerve function in resection of acoustic neuroma. Laryngoscope. 1992;102(10):1153–1158. doi: 10.1288/00005537-199210000-00010. [DOI] [PubMed] [Google Scholar]