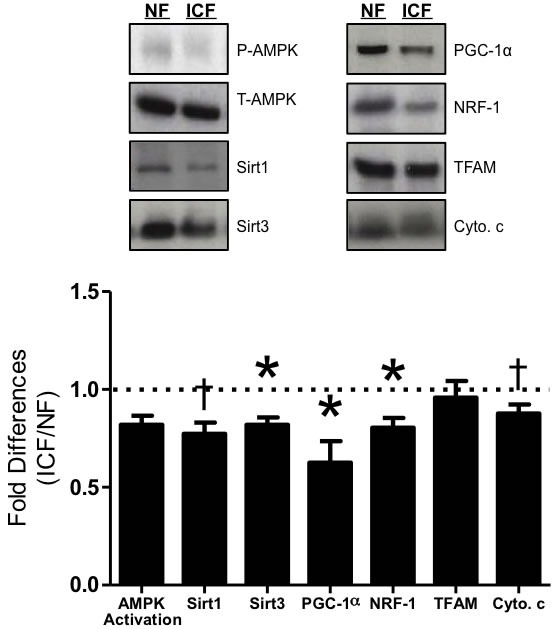
Figure 2. Mitochondrial biogenesis signaling.

Western blot analysis of key biogenesis signaling proteins including AMPK = 5' adenosine monophosphate-activated protein kinase; Sirt1 = sirtuin 1; Sirt3 = sirtuin 3; PGC-1α = peroxisome proliferator-activated receptor gamma coactivator-1 alpha; NRF-1 = nuclear respiratory factor 1; TFAM = mitochondrial transcription factor A; Cyto. c = cytochrome c. AMPK activation was determined as ratio of phosphorylated protein (p-AMPK) compared to total protein (t-AMPK). Graphical summary of repeated experiments is shown below. Values are represented as means ± SEM; n = 16-28 per group. *P < 0.05; †P < 0.10. Data are expressed as fold difference (ICF/NF).
