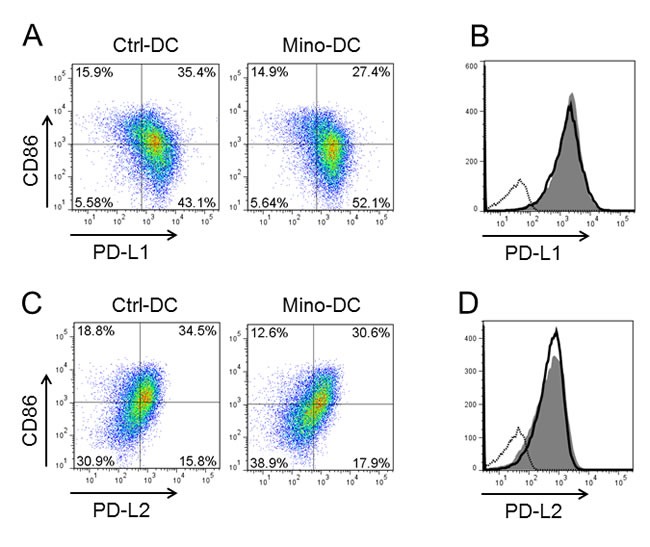
Figure 7. DCs generated in the presence of minocycline express high level of PDL-1.

Immature DCs generated from C57BL/6 mouse BM cells with (Mino-DCs) or without (Ctrl-DCs) minocycline were stimulated to maturity with IFN-γ plus TNF-α for 24 h, and analyzed for the expression of PDL-1, PDL-2 and CD86 by flow cytometry. A. Representative dot blot histograms showing PDL-1 and CD86 expression. B. Mino-DCs, shaded area; Ctrl-DCs, black line; isotype-matched control, dotted line. C. Representative dot blot histograms showing PDL-2 and CD86 expression. D. Mino-DCs, shaded area; Ctrl-DCs, black line; isotype-matched control, dotted line.
