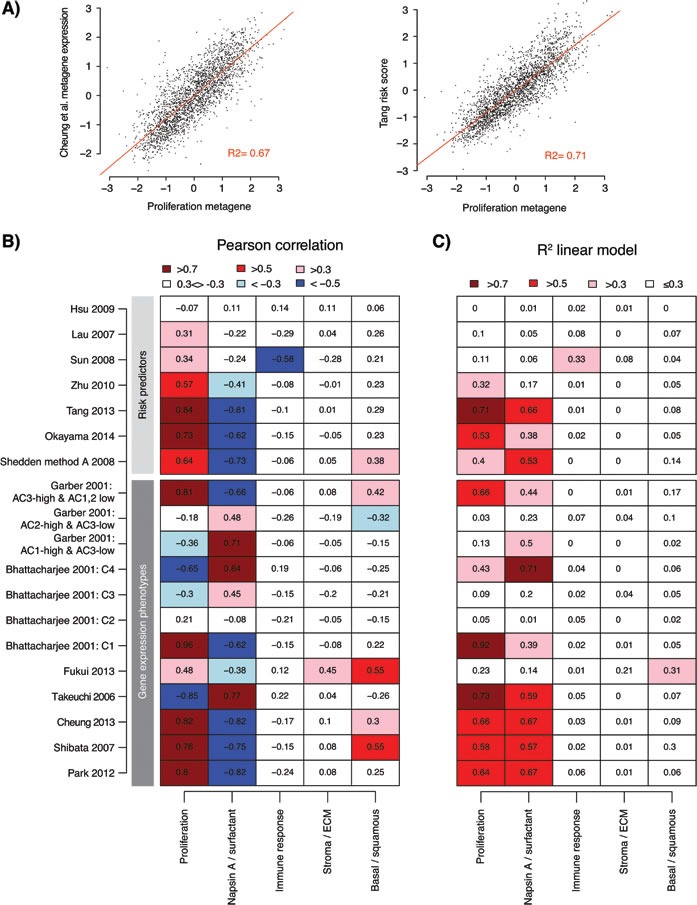
Figure 4. Association of gene expression phenotypes and risk predictor scores with transcriptional metagenes representing different biological processes.

A. Example of correlation between expression of a GEP signature metagene (Cheung et al. [37]) versus the expression of the proliferation metagene from Karlsson et al. [35] (left), and correlation between risk scores from a lung adenocarcinoma derived RP signature (Tang et al. [28]) and the proliferation metagene (right) across the 2395 adenocarcinomas (points). Red line shows the fit of a linear regression model, together with the calculated R2 value. Displayed data values represent Z-transformed expression values or risk scores to account for variability across cohorts. B. Pearson correlation of gene expression signatures with expression of five lung cancer transcriptional metagenes representing different biological processes [35] across 2395 adenocarcinomas in 17 cohorts. For each cohort and signature / process, a metagene expression value was calculated for the signature or process as described in Supplementary Methods and transformed to a Z-score. For risk predictors, risk scores were Z-transformed. Pearson correlation was calculated for the total cohort for each gene signature / predictor versus the biological processes. Some gene signatures are comprised of multiple subset signatures from the original studies. C. The fit (represented by the the R2 value) of a linear regression of Z-score values from gene signatures versus the biological processes, as exemplified in panel A, shows the strength of the linear relationship between signatures (or subcomponents of signatures) and expression of metagenes. ECM: extra cellular matrix.
