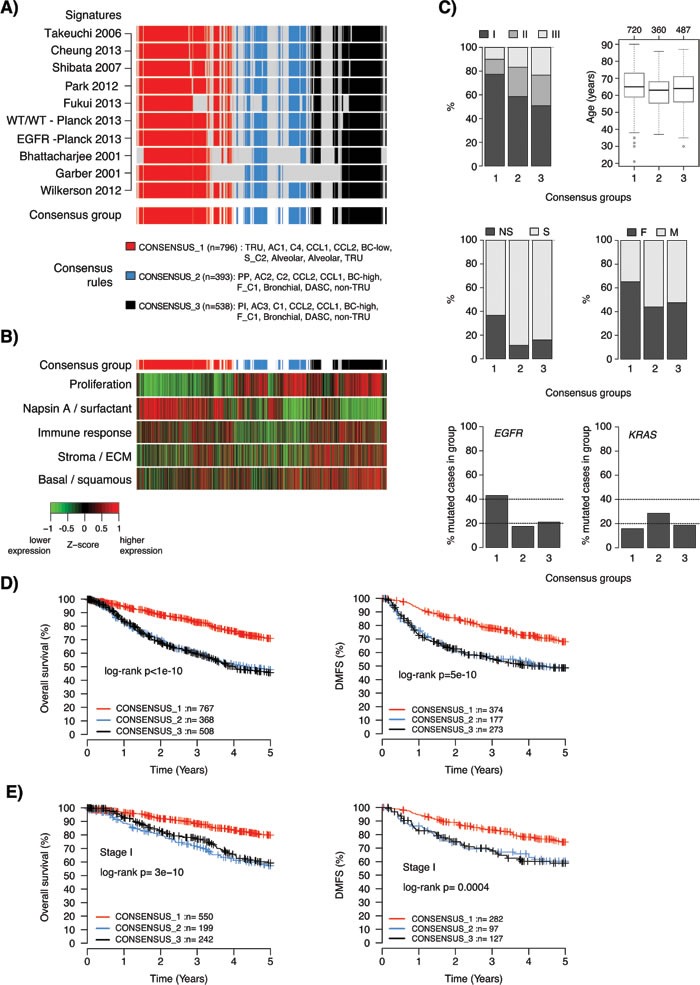
Figure 5. Characteristics of consensus samples across lung adenocarcinoma gene expression phenotypes.

A. Definition of three consensus groups across 10 reported lung adenocarcinoma GEP signatures. Rows represent individual signatures and columns represent samples. Consensus groups (bottom row) were defined as specified in the figure, and required a consensus classification in ≥8 of the 10 signatures. In total, 72% (n = 1727) of samples in the total cohort were assigned to a consensus group. B. Corresponding expression of metagene scores from five expression metagenes representing different biological processes [35]. Sample ordering (columns) corresponds to that shown in panel A. Metagene scores are shown as Z-transformed values. Z-score transformation was performed within each cohort prior to combining all samples. The top bar indicates the consensus groups according to that shown in panel A. C. Distribution of tumor stage (data for n = 1545 cases), age (n = 1567 cases), smoking status (n = 1374 cases), gender (n = 1646 cases), EGFR mutations (n = 822 cases with mutation status yes/no), and KRAS mutations (n = 885 cases with mutation status yes/no) for the three consensus groups. D. Kaplan-Meier survival plots of consensus groups for all consensus cases using overall survival (left) or distant metastasis-free survival (DMFS) (right) as endpoints. E. Kaplan-Meier survival plots of consensus groups for consensus cases with stage I disease using overall survival (left) or DMFS (right) as endpoints. TRU: terminal respiratory unit, PP: Proximal-proliferative, PI: Proximal-inflammatory, DASC: distal airway stem cell, NS: never-smoker, S: smoker, F: female, M: male.
