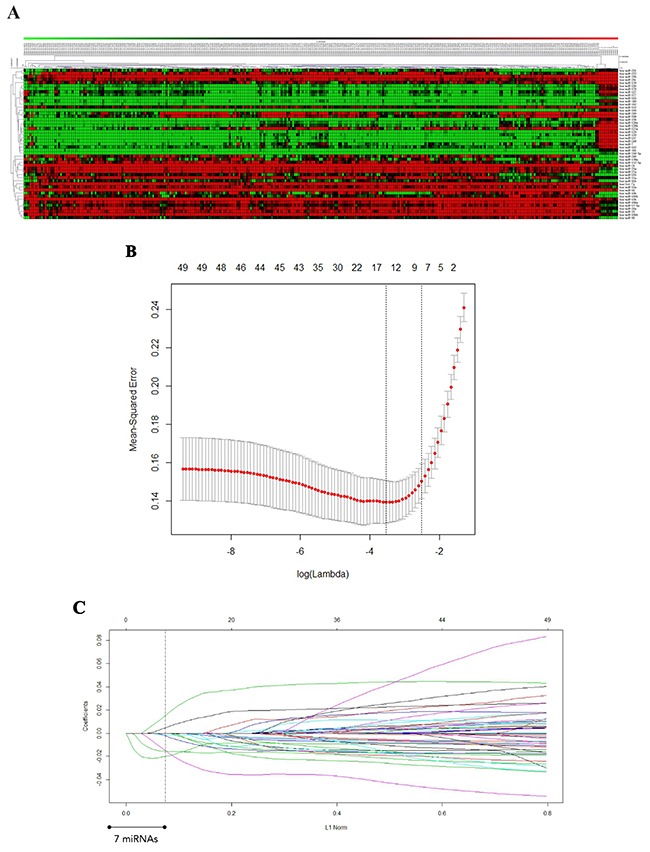
Figure 1.

A. miRNAs differentially expressed in GBM tissues compared with non-cancerous glial tissues. A heat map of the miRNAs is shown. Green represents miRNAs that are downregulated in GBM, and red represents miRNAs that are upregulated. B. Twenty-time cross-validation for tuning parameter selection in the LASSO model. C. LASSO coefficient profiles of the 49 GBM -associated miRNAs. A vertical line is drawn at the value chosen by 20-fold cross-validation.
