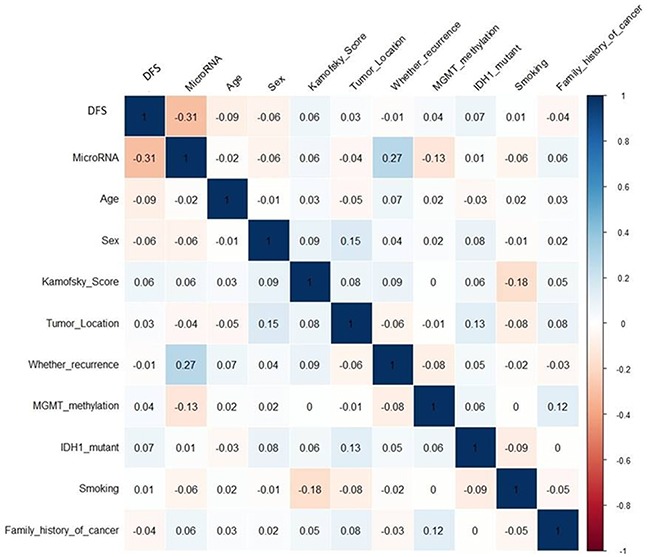
Figure 5. Correlation matrix of univariate association between miRNAs and other independent prognostic factors.

The matrix was generated by R language. The numbers in the squares indicate how the independent prognostic factors correlate with each other and seven-microRNA, the larger absolute value is the larger the correlation. Blue indicates positive correlation and read indicates negative correlation.
