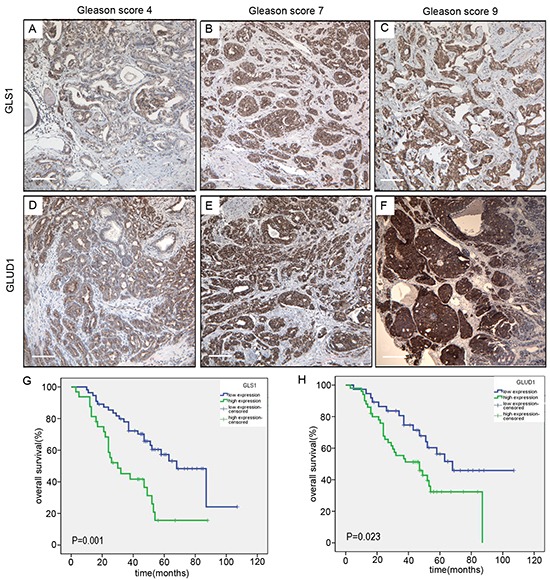
Figure 6. GLS1 and GLUD1 are over-expressed in prostate cancers and associated with poor survival.

Immunohistochemical staining of GLS1 in human prostate cancers with Gleason score 4 A., 7 B. and 9 C. Immunohistochemical staining of GLUD1 in human prostate cancers with Gleason score 4 D., 7 E. and 9 F. G. Kaplan-Meier survival curves of the 87 patients with prostate cancer expressing high (blue-line) or low (green-line) GLS1 protein. H. Kaplan-Meier survival curves of the 87 patients with prostate cancer expressing high (blue-line) or low (green-line) GLUD1 protein. Log-rank P value is shown. The scale bar in the Figure 6 3A to F is 100μm.
