

Abstract
Vertebrates exhibit extensive variation in brain size. The long‐standing assumption is that this variation is driven by ecologically mediated selection. Recent work has shown that an increase in predator‐induced mortality is associated with evolved increases and decreases in brain size. Thus, the manner in which predators induce shifts in brain size remains unclear. Increased predation early in life is a key driver of many adult traits, including life‐history and behavioral traits. Such results foreshadow a connection between age‐specific mortality and selection on adult brain size. Trinidadian killifish, Rivulus hartii, are found in sites with and without guppies, Poecilia reticulata. The densities of Rivulus drop dramatically in sites with guppies because guppies prey upon juvenile Rivulus. Previous work has shown that guppy predation is associated with the evolution of adult life‐history traits in Rivulus. In this study, we compared second‐generation laboratory‐born Rivulus from sites with and without guppies for differences in brain size and associated trade‐offs between brain size and other components of fitness. Despite the large amount of existing research on the importance of early‐life events on the evolution of adult traits, and the role of predation on both behavior and brain size, we did not find an association between the presence of guppies and evolutionary shifts in Rivulus brain size. Such results argue that increased rates of juvenile mortality may not alter selection on adult brain size.
Keywords: brain size evolution, early‐life mortality, extrinsic mortality, juvenile mortality, life‐history evolution, predator–prey interactions
1. Introduction
It has long been known that vertebrates exhibit extensive variation in brain size (Bauchot, Bauchot, Platel, & Ridet, 1977; Crile & Quiring, 1940; Jarvis et al., 2005; Mink, Blumenschine, & Adams, 1981; Striedter, 2005; Taylor & van Schaik, 2007). There are clear fitness benefits associated with a larger brain as brain size is positively correlated with increased intelligence, cognition, learning capability, population persistence, and decreased susceptibility to predation (Sol & Lefebvre, 2000; Tebbich & Bshary, 2004; Shultz & Dunbar, 2006a; Sol, Szekely, Liker, & Lefebvre, 2007; Sol, Bacher, Reader, & Lefebvre, 2008; Overington, Morand‐Ferron, Boogert, & Lefebvre, 2009; Barrickman, Bastian, Isler, & van Schaik, 2008; Amiel, Tingley, & Shine, 2011; Reader, Hager, & Laland, 2011; Kotrschal et al., 2013b; MacLean et al., 2014; Kotrschal et al., 2015a; Kotrschal, Corral‐Lopez, Amcoff, & Kolm, 2015b; Benson‐Amram, Dantzer, Stricker, Swanson, & Holekamp, 2016; but also see Drake, 2007). Key hypotheses, such as the expensive tissue hypothesis (i.e., expensive metabolic cost of brain tissue) (Aiello & Wheeler, 1995; Isler & van Schaik, 2009) and energy trade‐off hypothesis (increased encephalization leads to trade‐offs with other functions) (Isler & van Schaik, 2006a,b, 2009; Navarrete, van Schaik, & Isler, 2011; Tsuboi et al., 2015), recognize that brain tissue is costly and that fitness trade‐offs likely underlie increased encephalization (Aiello & Wheeler, 1995). Research has indeed shown that increased allocation to brain tissue leads to declines in other components of fitness (Kaufman, Hladik, & Pasquet, 2003; Kotrschal et al., 2013a; Mink et al., 1981; Navarrete et al., 2011; Raichle & Gusnard, 2002; Tsuboi et al., 2015). The observed costs and benefits of brain size, as well as the connections between brain size and fitness, foreshadow that variation in ecological factors have the potential to exert selection and influence observed patterns of brain size variation (Gittleman, 1994). Yet, the specific ecological drivers of brain size variation have largely remained elusive.
Recent work has identified a role for predation as an important selective force on the evolution of vertebrate brain size (van der Bijl, Thyselius, Kotrschal, & Kolm, 2015; Burns & Rodd, 2008; Edmunds, Laberge, & McCann, 2016; Kotrschal et al., 2015a; Shultz & Dunbar, 2006a; Walsh, Broyles, Beston, & Munch, 2016). Selection for larger brains in captive populations of guppies is associated with increased cognitive function and declines in susceptibility to predation (Kotrschal et al., 2013a,b, 2015b). However, work on natural fish populations in other species yielded the opposite trajectory of evolution. Walsh et al. (2016) compared populations of Trinidadian killifish, Rivulus hartii, from sites that differ in the presence and absence of large predators for variation in brain size. This work showed that male, but not female, Rivulus from sites with large piscivores have evolved smaller brains when compared to fish from sites that lack predators. Such sex‐specific differences may be related to known differences in fish behavior and learning abilities between sites that differ strongly in predation intensity (Archard & Braithwaite, 2011; Benson‐Amram et al., 2016; van der Bijl et al., 2015; Brydges, Heathcote, & Braithwaite, 2008; Cousyn et al., 2001; DePasquale, Wagner, Archard, Ferguson, & Braithwaite, 2014; Dingemanse et al., 2007; Fraser, Gilliam, Daley, Le, & Skalski, 2001; Gilliam & Fraser, 2001; Harris, Ramnarine, Smith, & Pettersson, 2010; Hembre & Peterson, 2013; Kotrschal et al., 2013a,b; Lima & Dill, 1990; Plijanowska, Weider, & Lampert, 1993; Tulley & Huntingford, 1988; Urban, 2007). For example, fish that experience weak levels of predation are faster learners and have better spatial cognition than fish that are exposed to higher rates of predation (Brydges et al., 2008; DePasquale et al., 2014). Male Rivulus with larger brains are potentially favored in safer environments due to the fitness benefits that may result from better problem‐solving behavior and increased cognition (Walsh et al., 2016). The current literature clearly illustrates a connection between predation regime and brain size evolution, but given the inconsistent nature of the results from this growing body of work (van der Bijl et al., 2015; Burns & Rodd, 2008; Gonda, Herczeg, & Merila, 2009a,b, 2011; Kotrschal et al., 2015a; Shultz & Dunbar, 2006b; Walsh et al., 2016), the generality of such conclusions requires further testing.
It is well known that the trajectory of evolution for many classes of traits depends upon the age and/or size classes that experience predator‐induced mortality (Brown, 2003; Charlesworth, 1980; Jonsson & Jonsson, 2014; Sih, Kats, & Maurer, 2003; Urban, 2007). For example, increased rates of juvenile predation are associated with the evolution of delayed maturation and decreased reproductive effort (Reznick & Endler, 1982; Sparkes, 1996a,b; Walsh & Reznick, 2009; Wellborn, 1994). Similarly, juvenile exposure to predation can influence adult behavior and learning (Bell & Sih, 2007; Jonsson & Jonsson, 2014; Lonnstedt, McCormick, & Chivers, 2012; Sparkes, 1996b). For instance, Bell and Sih (2007) showed that predator exposure as juveniles induces increased aggressive behavior and boldness as adults. Links between juvenile mortality and shifts in adult traits, especially adult behavior and learning, imply that mortality early in life may be an important selective force on adult brain size.
In addition to sites with large predators, Rivulus are also found in localities where juveniles are the target of predation (Fraser, Gilliam, MacGowan, Arcaro, & Guillozet, 1999; Gilliam, Fraser, & Alkinskoo, 1993; Walsh, Fraser, Bassar, & Reznick, 2011). Rivulus are located in sites with guppies Poecilia reticulata (hereafter Rivulus/guppy “RG” sites), which are located tens of meters downstream from sites in which Rivulus are the only species present (hereafter Rivulus‐only “RO” sites). The abundances of Rivulus decline dramatically at the point of contact with guppies (2–3× decline) because field and laboratory experiments have shown that adult guppies prey upon juvenile Rivulus (Fraser & Lamphere, 2013; Furness & Reznick, 2014; Walsh et al., 2011). Rivulus quickly attain a size that exceeds the gape of guppies (Furness & Reznick, 2014). Thereafter, Rivulus exhibit significantly faster rates of individual growth in RG versus RO localities (Furness & Reznick, 2014; Walsh et al., 2011). This increase in growth likely reflects increased per capita food availability in RG sites, which is likely an indirect consequence of increased gape‐limited predation by guppies (Walsh et al., 2011). Previous work has shown that these direct (larval mortality) and indirect (increased food) effects of guppies are associated with local adaptation in the life‐history traits of Rivulus between RG and RO communities (Walsh & Reznick, 2009, 2010, 2011). Such work clearly shows that increased predation by guppies can exert selection on Rivulus. Therefore, these interactions between Rivulus and guppies provide a means to test how size‐structured interactions shape the evolution of brain size when predatory mortality is presumably limited to early developmental stages in prey.
Here, we tested for genetically based differences in brain size and associated trade‐offs between brain size and other components of fitness (i.e., development rate; gut size) between Rivulus from three RG and three RO sites. We compared Rivulus from RG and RO sites for differences in brain and gut size using existing specimens stemming from previous second‐generation common garden‐reared experiments (see Walsh & Reznick, 2010, 2011). This prior work evaluated the evolutionary consequences of the direct and indirect effects of guppies by rearing all populations on two food levels that match the known differences in growth. The specimens stemming from this work thus allow us to test the effects of the direct and indirect consequences of interactions with guppies on the evolution of brain size in Rivulus. If increased juvenile mortality alters selection on adult brain size, then we predict that we will observe a similar trajectory of evolution as driven by predators capable of consuming all size classes of prey (see Walsh et al., 2016) and that male Rivulus in RG sites will exhibit smaller brains than fish from corresponding RO communities. This is due to the potential fitness benefits associated with large brain size in nonrisky environments, as well as the benefits of allocating energy elsewhere in high‐predation environments (Shultz & Dunbar, 2006b). A failure to observe this pattern may indicate that mortality early in life does not alter adult behavior or learning capabilities and, by association, brain size.
2. Materials and Methods
The experimental methodology is previously published (Walsh & Reznick, 2010, 2011) and is summarized here. Rivulus were collected from RO and RG communities from the Aripo, Guanapo, and Quare rivers in January 2007. Twenty to 25 wild‐caught males and females were used to establish laboratory populations for the common garden experiments. These wild‐caught females and males from the same locality (i.e., same river and same community) were paired in a 9‐L tank. Over the course of approximately 20 days, eggs from each pair were harvested and reared in petri dishes. Once hatched, eight to 10 larvae were placed in a 9‐L aquarium and fed a diet of liver paste and brine shrimp nauplii ad libitum. Once sex was identifiable (~50 days post hatch), fish were placed in tanks of two to four fish with equal ratios of males to females until sexual maturation was reached.
The second common garden generation was generated using six to eight randomly paired killifish from each population (see Fig. S1 of Walsh & Reznick, 2010). We then collected eggs from all pairings for 10–20 days. Upon hatching, eight to 12 larvae were placed in 9‐L aquaria and were reared under the same conditions as the previous generation. After 20 days, eight fish from each pairing were randomly selected and individually placed in 9‐L tanks until maturation. These fish were randomly allocated to either (1) high‐food (HF) or (2) low‐food (LF) treatments. Rivulus exhibit a rate of growth that is two to three times faster in RG communities when compared to RO localities (Walsh et al., 2011). The high‐food levels used in these experiments thus sustained a growth rate that approximates that observed in the RG communities, while the low‐food treatments were designed to mimic growth rates in RO communities (Fraser et al., 1999; Walsh & Reznick, 2008). All fish were then reared until maturation. Males were euthanized at maturation, while females were euthanized following a 2‐week period of egg collection after maturation (Walsh & Reznick, 2010, 2011). Each day, all fish were euthanized and preserved in the morning (~16 hours after the prior afternoon feeding). Such timing allows for sufficient processing of food, eliminating potential bias that might be associated with varying amounts of food left in the gut upon preservation (Walsh et al., 2016). Specimens were preserved in 5% formalin for approximately 8 years prior to being dissected for brain and gut size beginning in August 2015.
2.1. Brain weight and gut size measurements
We dissected the brain from each specimen by cutting from the top of each gill slit to remove the lower jaw and any tissue between the mouth and braincase. Each brain was blotted dry prior to measuring the wet weight of the brain (mg). The gut was removed by first cutting from the tip of the anus to remove the posterior end. The fish was then cut where the esophagus meets the stomach. Each gut was blotted dry and measured for wet weight (mg).
2.2. Statistical design and analyses
The dependent variables included brain and gut size. All variables were analyzed using general linear models with fish community (Rivulus‐only, Rivulus/guppy), food treatment (high, low), river (Aripo, Guanapo, Quare), and sex (male, female) and all interactions included as fixed effects (SPSS v.23, IBM Corporation). Body weight was included as a covariate in all analyses. Brain size, gut weight, and total weight were ln transformed to better linearize the data.
2.3. Trait correlations
To explore trade‐offs between brain size and gut size, and age at maturation, Pearson correlations were performed between brain size versus age at maturation and gut size versus age at maturation between RO and RG sites for each river. The data for age at maturation have been previously published (Walsh & Reznick, 2010, 2011). To correct for body size, residuals from the general linear model were used with body size as a covariate.
3. Results
3.1. Fish community effects
Differences in absolute and relative brain size and relative gut size were nonsignificant (p > .05) between RO and RG populations (Table 1; Figure 1). We observed marginally nonsignificant (p < .1) differences between RG and RO sites for absolute gut size (Table 1; Figure 1). Rivulus from RO sites exhibited a gut size that was 4% larger than RG sites (Figure 1). Differences in relative brain size between fish communities depended upon the river of origin (i.e., significant “river × population” interaction; Figure 2, Table 1). Rivulus from RG localities in the Aripo and Quare rivers exhibited a relative brain size that was 3% and 1% larger than Rivulus from RO sites, respectively (Figure 2). The opposite pattern of divergence was observed in fish from the Guanapo River, as the brain size of Rivulus from the RO site was 3% larger than the corresponding RG population (Figure 2). The “river × population” interaction was not significant for relative gut size (Table S1).
Table 1.
Analyses of brain and gut size variation. Significant terms are indicated in bold
| df | Absolute brain size (mg) | Relative brain size (mg) | Absolute gut size (mg) | Relative gut weight (mg) | |||||
|---|---|---|---|---|---|---|---|---|---|
| F | p | F | p | F | p | F | p | ||
| Covariates | |||||||||
| Fish size | 1 | ….. | ….. | 311.6 | <.001 | ….. | ….. | 161 | <.001 |
| Main effects | |||||||||
| Predation | 1 | 2.43 | .12 | 0 | .99 | 3.61 | .058 | 0.43 | .51 |
| Food | 1 | 21.95 | <.001 | 5.57 | .019 | 13.49 | <.001 | 3.71 | .055 |
| River | 1 | 15.96 | <.001 | 0.16 | .85 | 7.32 | .001 | 0.92 | .4 |
| Sex | 1 | 948.98 | <.001 | 2.16 | .14 | 400.18 | <.001 | 3.72 | .055 |
| Predation × Food | 1 | 0.85 | .36 | 0.24 | .62 | 0.76 | .39 | 0.022 | .88 |
| Predation × River | 1 | 1.14 | .32 | 3.37 | .036 | 1.38 | .25 | 0.25 | .78 |
| Predation × Sex | 1 | 2.22 | .14 | 0.24 | .62 | 1.23 | .27 | 0.033 | .86 |
| Food × River | 1 | 1.95 | .14 | 0.91 | .4 | 1.17 | .31 | 0.28 | .76 |
| Food × Sex | 1 | 3.37 | .068 | 7.12 | .008 | 0.37 | .54 | 0.74 | .39 |
| River × Sex | 1 | 5.75 | .004 | 2.07 | .13 | 10.57 | <.001 | 0.99 | .37 |
| Predation × Food × River | 1 | 0.46 | .63 | 0.74 | .48 | 0.28 | .76 | 0.59 | .56 |
| Predation × Food × Sex | 1 | 0.01 | .92 | 0.06 | .8 | 0.64 | .42 | 0.79 | .38 |
| Predation × River × Sex | 1 | 0.54 | .58 | 1.39 | .22 | 0.57 | .57 | 0.6 | .55 |
| Food × River × Sex | 1 | 0.62 | .54 | 0.83 | .44 | 0.49 | .61 | 0.47 | .63 |
| Predation × Food × River × Sex | 1 | 1.02 | .36 | 0.9 | .41 | 0.12 | .89 | 0.45 | .64 |
| Error df | 261 | 260 | 265 | 264 | |||||
F, F‐values; p, p‐values; df, numerator degrees of freedom; Error df, denominator degrees of freedom.
Figure 1.

Variation in brain and gut size between fish communities. (a) fish size versus brain size, (b) relative brain size, (c) fish size versus gut size, (d) relative gut size. Panels a, c: closed circles, solid regression line—Rivulus‐only sites; open circles, dashed regression line—Rivulus/guppy sites. Panels b, d: RG = Rivulus/guppy, RO—Rivulus‐only. Differences in absolute and relative brain and gut were not significant (p > .05) between RG and RO sites. The data points for relative brain and gut size reflect the estimated marginal means at the mean of the covariate. Error = ±1 SE
Figure 2.
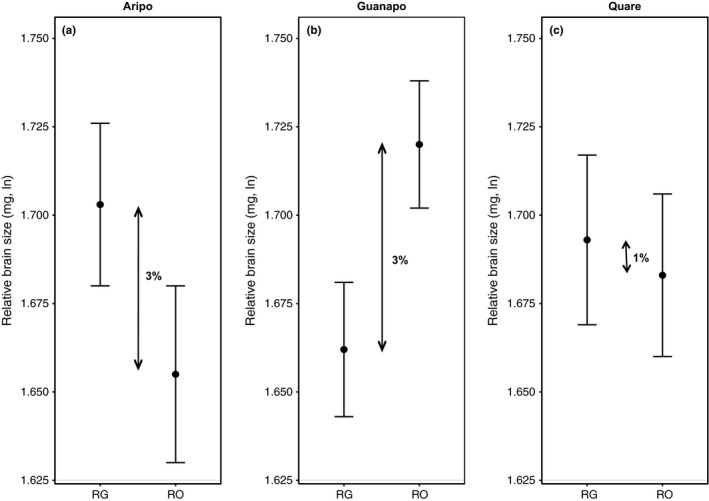
Brain size differences between fish communities depended upon river. Relative brain size of Rivulus from Rivulus/guppy (RG) and Rivulus‐only (RO) communities in the (a) Aripo, (b) Guanapo, and (c) Quare rivers
3.2. Food effects
We observed a significant effect of food level on absolute and relative brain size (Table 1; Figure 3). Absolute brain size was 8% larger in fish fed high‐food when compared with the low‐food treatments (Figure 3). This trend was reversed for relative brain size; Rivulus fed a low‐food level exhibited a relative brain size that was 3% larger than the high‐food treatments. Absolute gut size differed significantly between the food treatments (Table 1; Figure 3); absolute gut size was 7% larger in high versus low‐food treatments. The effects of food level on relative gut size were marginally nonsignificant (p < .1) (Table 1; Figure 3). Relative gut size was 3% larger in the low‐food treatment versus the high‐food level.
Figure 3.

Influence of food treatments on brain and gut size. (a) absolute brain size, (b) absolute gut size, (c) fish size versus brain size, (d) fish size versus gut size, (e) relative brain size, (f) relative gut size. HF, high food; LF, low food. Panels c, d: closed circles (solid regression line)—high food; open circles (dashed regression line)—low food. We observed significant differences between the food treatments for absolute and relative brain size and absolute gut size. Differences in relative gut size were marginally nonsignificant (p < .1). The data points for relative brain and gut size reflect the estimated marginal means at the mean of the covariate. Error = ±1 SE
3.3. Sex effects
Absolute brain and gut size differed between the sexes (Table 1). The absolute brain and gut sizes were 63% and 45% larger in females than males (average ln absolute brain size (mg) ± 1 SE: females = 2.11 ± 0.019, males = 1.29 ± 0.019; average ln absolute gut size (mg) ± 1 SE: females = 2.88 ± 0.032, males = 1.99 ± 0.031). Patterns of divergence between the sexes for relative brain size depended upon controlled food levels in the laboratory as we observed a significant (p < .05) “food × sex” interaction (Table 1; Figure 4). The brain size of males differed little between high and low‐food levels (Figure 4). Conversely, females exhibited brains that were 5% larger under low versus high‐food levels (Figure 4).
Figure 4.

Sex‐specific responses in relative brain size as a function of food level. (a) female fish size versus brain size, (b) male fish size versus brain size, (c) sex by food interaction. Panels a, b: closed circles (solid regression) = high food, open circles (dashed regression)—low food. HF—high food, LF—low food. General linear models revealed a significant (p < .05) sex × food interaction for relative brain size. Error = ±1 SE
4. Discussion
Our results show that increased rates of juvenile predation and correlated increases in resources in fish communities with guppies are not associated with consistent divergence in adult brain size of Rivulus (Table 1; Figures 1 and 3). Overall, the relative brain size between locations where Rivulus are (RG) and are not (RO) exposed to gape‐limited predation by guppies was nearly identical (Figure 1). Small differences (1%–3%) in relative brain size were observed between RG and RO sites, but these differences varied across rivers (i.e., significant population × river interaction) (Figure 2). It was recently shown that increased predation by large piscivores drives the evolution of substantially smaller brains in male (but not female) Rivulus (Walsh et al., 2016). Then: What explains the lack of consistent divergence in brain size between communities with and without guppies?
In our recent study, Walsh et al. (2016) tested the influence of predators on brain size evolution by comparing the brain size of Rivulus between sites that differ in the presence and absence of several species of large piscivorous fish (Walsh & Reznick, 2008, 2009). As described previously, Rivulus from sites with predators have evolved a smaller brain size (in males only). This is important because there are also known differences in prey behavior in this system (Fraser et al., 2001; Gilliam & Fraser, 2001). In sites with large predators, species such as Crenicichla alta and Hoplias malabaricus are capable of consuming all size classes of Rivulus. This increased predation is, in turn, associated with shifts in adult risk‐taking behavior; Rivulus are bolder in sites with large predators when compared with sites in which Rivulus are alone (Fraser et al., 2001; Gilliam & Fraser, 2001). We hypothesize that this covariation between behavior and brain size is due to the known differences in predator‐induced mortality (Fraser et al., 1999; Walsh et al., 2016).
The primary difference between the current study and previously completed work on Rivulus brain size evolution (see Walsh et al., 2016) is the nature of the predator community. In RG sites, juvenile Rivulus are subjected to predation by guppies (Fraser & Lamphere, 2013; Furness & Reznick, 2014), but quickly outgrow the gape of guppies. Rivulus also attain a much larger asymptotic size than guppies; adult guppies will grow up to 32 mm in total length (Rodd & Reznick, 1997), while Rivulus can attain a size of ~100 mm as adults (Walsh & Reznick, 2009). Life‐history theory and our subsequent empirical work clearly show that mortality targeted at immature age classes can shape adult life‐history traits (see Reznick & Endler, 1982; Stearns, 1992; Wellborn, 1994; Sparkes, 1996a; but also see Gadgil & Bossert, 1970; Law, 1979; Charlesworth, 1980; Fitzpatrick, Torres‐Dowdall, Reznick, Ghalambor, & Funk, 2014). In contrast to sites with large predators (Fraser et al., 2001; Gilliam & Fraser, 2001), guppies do not appear to alter the behavior of adult Rivulus. Rivulus in RG and RO sites are frequently observed in open water, rather than the stream margins when large predators are present (MR Walsh 2016, personal observation). As a result, we hypothesize that the lack of an association between juvenile mortality and selection on brain size is due to weak patterns of divergent selection on Rivulus learning and behavior between RG and RO sites. An alternative perspective is that cognitive demands differ when predation occurs throughout the lifetime in an organism versus when it is limited to a short duration early on in life. Regardless, these hypotheses require experimental testing.
It is important to note that we did detect small differences in brain size between RG and RO sites, but the direction of the differences varied across rivers (i.e., significant population × river interaction) (Table 1; Figures 1 and 2). For example, Rivulus from sites with guppies exhibited a relative brain size that was 3% larger than sites where Rivulus are alone in the Aripo river, but such trends were reversed in the Guanapo River (Figure 2). These small but variable responses further illustrate the lack of connection between the presence of guppies and evolutionary shifts in brain size. The cause of these variable differences in brain size between RG and RO sites across rivers is unclear. This is, in part, because we showed previously that these rivers and communities do not differ in the size of the physical habitat or in abiotic variables such as dissolved oxygen, salinity, or water temperature (Walsh & Reznick, 2009). However, it is certainly plausible that our focal streams could differ in other features that we have yet to account for (i.e., habitat complexity, flow regimes) and that may influence brain size divergence.
4.1. Brain size plasticity and resource availability
Our food treatments were designed to mimic natural variation in resource availability in the wild; Rivulus experience higher food availability in RG sites because predation by guppies is associated with declines in the abundances of Rivulus and, in turn, increased food for survivors (Fraser & Lamphere, 2013; Walsh et al., 2011). As expected, Rivulus attained a larger body size when reared on high versus low food (Figure 3). In turn, absolute brain size was significantly larger on high‐food levels when compared with low‐food levels (Table 1; Figure 3). However, such trends were reversed for relative brain size; Rivulus exhibited a larger relative brain size in the low‐food versus high‐food treatments (Table 1; Figure 3). These observed increases in brain size when food was reduced are largely due to a stronger response in females than males (Figure 4). One potential explanation for the differences in relative brain size between food treatments is that they are adaptive. For instance, increased brain size is broadly associated with higher levels of intelligence, problem‐solving abilities, and cognition across species (Benson‐Amram et al., 2016). It is thus plausible that larger brains are favored when resources are scarce because larger brains may improve foraging capabilities and ultimately fitness. Such plasticity may be adaptive as declines in foraging may foreshadow declining conditions. The divergent responses to reduced food between males and females also suggest that selection on brain size is perhaps stronger in females than males as efficient energy acquisition is likely to be especially important to maintaining high reproductive efforts.
An alternative explanation is that brain size is more canalized than body size, and thus, the differences in relative brain size between food treatments (or divergent responses to reduced food between males and females) are simply a byproduct of increased sensitivity of body size to resources. Regressions between body size and brain size revealed a positive relationship for high‐ and low‐food levels (Figure 3c), but the slope of this trend was higher for low‐food levels. Similarly, females exhibited a larger relative brain size when fed a low‐food rather than high‐food diet because brain size increased more rapidly as a function of body size in the fish fed a low‐food level versus high‐food level (Figure 4). These same regressions were nearly identical for males between the two food treatments (Figure 4). These regressions also indicate that the significant differences in relative brain size between food levels and the significant “sex × food” interaction are not likely due to increased canalization of brain size versus body size (see Fitzpatrick et al., 2012). The food treatments include fish that exhibit a similar range of variation in size, and the overall differences in body size between high‐ and low‐food levels for males and females are nearly identical (average ln male body size (g): HF = −1.28, LF = −1.52; average ln female body size (g): HF = −0.18, LF = −0.42). Our results instead foreshadow an adaptive connection between resource availability and brain–body size allometry, but such a hypothesis requires further testing.
4.2. Gut size variation
Similar to the patterns of brain size plasticity, declines in food were associated with the production of larger guts (Figure 3). This connection between gut size plasticity and food parallels much previous research (Benavides, Cancino, & Ojeda, 1994; Jackson, 1992; Korn, 1992; Olsson, Quevedo, Colson, & Svanbäck, 2007; Piersma & Lindstrom, 1997; Relyea & Auld, 2004; Siems & Sikes, 1998; Starck, 1996; Sullam et al., 2015; Wagner, McIntyre, Buels, Gilbert, & Michel, 2009). Optimal digestion theory predicts that low‐food quantities (or low‐quality food) should favor longer digestive tracts because this increase in gut size allows for an increase in resource absorbance efficiency (Kotrschal, Corral‐Lopez, Szidat, & Kolm, 2015c; Kotrschal, Szidat, & Taborsky, 2014; Relyea & Auld, 2004; Savory & Gentle, 1976; Yang & Joern, 1994).
Overall, females produced larger guts than males (Table 1). Similar to the observed differences in brain size under low‐food conditions between males and females, these differences in gut size between the sexes are potentially explained by differences in energy budgets, specifically that females allocate more energy to reproduction and may need to ensure maximal conversion of resources into reproductive tissue. Such a notion is supported by sex‐specific differences in gut size in other taxa (Hudry, Khadayate, & Miguel‐Aliaga, 2016; Reiff et al., 2015). For example, the organ responsible for absorption of nutrients in Drosophila melanogaster, the midgut, is not only longer in females when compared to male fruit flies, but increases in length following mating (Reiff et al., 2015).
4.3. Ecological drivers of brain size evolution
Interest in the relationship between ecological forces and selection on brain size is growing rapidly. Research has shown that ecological variables, such as social environment (Connor, 2007; Kotrschal, Rogell, Maklakov, & Kolm, 2012a; Shultz & Dunbar, 2006b), diet (Allen & Kay, 2012; Shultz & Dunbar, 2006a), habitat (Crispo & Chapman, 2010; Gonda et al., 2009b; Kotrschal, Sundstrom, Brelin, Devlin, & Kolm, 2012b), and predators (Gonda et al., 2009a,b, 2011; Walsh et al., 2016), play an important role in brain size plasticity and brain size evolution (see also Gonda, Herczeg, & Merila, 2013). These latter studies exploring the connection between predators and selection on brain size have largely compared populations where adults are susceptible to predators (Gonda et al., 2009a,b, 2011; Walsh et al., 2016). For example, Gonda et al. (2009a,b, 2011) compared patterns of brain size variation in sticklebacks from divergent aquatic habitats. Sticklebacks in environmentally complex marine habitats experience high levels of predation and lower densities, while simple pond environments lack predators (Gonda et al., 2011). Results from this work showed that wild‐caught sticklebacks from marine habitats exhibited smaller brains than fish from ponds (Gonda et al., 2009a). Such trends largely parallel those observed in Rivulus between sites with and without large predators (for males only) (Walsh et al., 2016) although the brain size differences in sticklebacks were not maintained in common garden‐reared fish (Gonda et al., 2011). Conversely, work on captive populations of guppies showed that selection for a larger brain is associated with enhanced survival in risky habitats (Kotrschal et al., 2015a). This growing body of work clearly provides a connection between predators and brain size, although the contradictory nature of these results currently limits our understanding of the manner in which predatory selection acts on brain size.
Our study advances work exploring connections between predation and brain size because it examines populations that are exposed to predation during a brief, discrete interval of time. Despite extensive research demonstrating a link between mortality targeted at immature age classes and resultant selection on a suite of adult characteristics (Hutchings, 1993; Reznick & Endler, 1982; Sparkes, 1996a; Stearns, 1992; Walsh & Reznick, 2010, 2011; Wellborn, 1994), we did not find an association between increased juvenile predation and evolutionary shifts in brain size. One potential implication of our results is that they provide a window into the time period in which selection does or does not act on brain size and indicates that variation in adult mortality may be a strong predictor of brain size evolution in nature. Direct tests of the influence of increased juvenile or adult mortality on the evolution of brain size are now needed.
5. Conclusions
Here, we tested the influence of early‐life mortality on brain size evolution. Despite a growing body of work illustrating a connection between predator‐induced mortality and the evolution of vertebrate brain size (van der Bijl et al., 2015; Burns & Rodd, 2008; Edmunds et al., 2016; Kotrschal et al., 2012b, 2015b; Shultz & Dunbar, 2006a; Walsh et al., 2016), we found that increased rates of juvenile mortality are not associated with evolutionary shifts in adult brain size. In contrast to much work illustrating a connection between juvenile mortality and evolutionary shifts in adult characteristics (Reznick & Endler, 1982; Sparkes, 1996a; Wellborn, 1994), one potential implication of our results is that mortality experienced early in life may not alter selection on adult brain size.
Conflict of interests
None declared.
Supporting information
Acknowledgments
We thank David Reznick for providing guidance and support. The original experiments were funded by an NSF FIBR grant to David Reznick. We also thank Doug Fraser and Matthew Shrader for help with fish collection.
Beston, S. M. , Broyles, W. and Walsh, M. R. (2017), Increased juvenile predation is not associated with evolved differences in adult brain size in Trinidadian killifish (Rivulus hartii). Ecology and Evolution, 7: 884–894. doi: 10.1002/ece3.2668
References
- Aiello, L. C. , & Wheeler, P. (1995). The expensive‐tissue hypothesis—the brain and the digestive‐system in human and primate evolution. Current Anthropology, 36, 199–221. [Google Scholar]
- Allen, K. L. , & Kay, R. F. (2012). Dietary quality and encephalization in platyrrhine primates. Proceedings of the Royal Society B, 279, 715–721. [DOI] [PMC free article] [PubMed] [Google Scholar]
- Amiel, J. J. , Tingley, R. , & Shine, R. (2011). Smart moves: Effects of relative brain size on establishment success of invasive amphibians and reptiles. PLoS ONE, 6, e18277. [DOI] [PMC free article] [PubMed] [Google Scholar]
- Archard, G. A. , & Braithwaite, V. A. (2011). Increased exposure to predators increases both exploration and activity level in Brachyrhaphis episcopi. Journal of Fish Biology, 78, 593–601. [DOI] [PubMed] [Google Scholar]
- Barrickman, N. L. , Bastian, M. L. , Isler, K. , & van Schaik, C. P. (2008). Life history costs and benefits of encephalization: A comparative test using data from long‐term studies of primates in the wild. Journal of Human Evolution, 54, 568–590. [DOI] [PubMed] [Google Scholar]
- Bauchot, R. , Bauchot, M. L. , Platel, R. , & Ridet, J. M. (1977). Brains of Hawaiian tropical fishes—Brain size and evolution. Copeia, 1977, 42–46. [Google Scholar]
- Bell, A. M. , & Sih, A. (2007). Exposure to predation generates personality in threespined sticklebacks Gasterosteus aculeatus . Ecology Letters, 10, 828–834. [DOI] [PubMed] [Google Scholar]
- Benavides, A. G. , Cancino, J. M. , & Ojeda, F. P. (1994). Ontogenic changes in gut dimensions and macroalgal digestibility in the marine herbivorous fish, Aplodactylus‐punctatus . Functional Ecology, 8, 46–51. [Google Scholar]
- Benson‐Amram, S. , Dantzer, B. , Stricker, G. , Swanson, E. M. , & Holekamp, K. E. (2016). Brain size predicts problem‐solving ability in mammalian carnivores. Proceedings of the National Academy of Sciences of the United States of America, 113, 2532–2537. [DOI] [PMC free article] [PubMed] [Google Scholar]
- van der Bijl, W. D. , & Kolm, N. (2016). Why direct effects of predation complicate the social brain hypothesis. BioEssays, 38, 568–577. [DOI] [PubMed] [Google Scholar]
- van der Bijl, W. D. , Thyselius, M. , Kotrschal, A. , & Kolm, N. (2015). Brain size affects the behavioural response to predators in female guppies Poecilia reticulata . Proceedings of the Royal Society B, 282, 116–124. [DOI] [PMC free article] [PubMed] [Google Scholar]
- Brown, G. E. (2003). Learning about danger: Chemical alarm cues and local risk assessment in prey fishes. Fish and Fisheries, 4, 227–234. [Google Scholar]
- Brydges, N. M. , Heathcote, R. J. P. , & Braithwaite, V. A. (2008). Habitat stability and predation pressure influence learning and memory in populations of three‐spined sticklebacks. Animal Behaviour, 75, 935–942. [DOI] [PubMed] [Google Scholar]
- Burns, J. G. , & Rodd, F. H. (2008). Hastiness, brain size and predation regime affect the performance of wild guppies in a spatial memory task. Animal Behaviour, 76, 911–922. [Google Scholar]
- Charlesworth, B. (1980). Evolution in age structured populations. UK: Cambridge University Press. [Google Scholar]
- Connor, R. C. (2007). Dolphin social intelligence: Complex alliance relationships in bottlenose dolphins and a consideration of selective environments for extreme brain size evolution in mammals. Philosophical Transactions of the Royal Society of London. Series B, 362, 587–602. [DOI] [PMC free article] [PubMed] [Google Scholar]
- Cousyn, C. , De Meester, L. , Colbourne, J. K. , Brendonck, L. , Verschuren, D. , & Volckaert, F. (2001). Rapid, local adaptation of zooplankton behavior to changes in predation pressure in the absence of neutral genetic changes. Proceedings of the National Academy of Sciences of the United States of America, 98, 6256–6260. [DOI] [PMC free article] [PubMed] [Google Scholar]
- Crile, G. , & Quiring, D. P. (1940). A record of the body weight and certain organ and gland weights of 3690 animals. The Ohio Journal of Science, 40, 219–259. [Google Scholar]
- Crispo, E. , & Chapman, L. J. (2010). Geographic variation in phenotypic plasticity in response to dissolved oxygen in an African cichlid fish. Journal of Evolutionary Biology, 23, 2091–2103. [DOI] [PubMed] [Google Scholar]
- DePasquale, C. , Wagner, T. , Archard, G. A. , Ferguson, B. , & Braithwaite, V. A. (2014). Learning rate and temperament in a high predation risk environment. Oecologia, 176, 661–667. [DOI] [PMC free article] [PubMed] [Google Scholar]
- Diamond, M. C. , Law, F. , Rhodes, H. , Lindner, B. , Rosenweig, M. R. , Krech, D. , Bennett, E. L. (1966). Increases in cortical depth and glia numbers in rats subjected to enriched environment. The Journal of Comparative Neurology, 1, 117–126. [DOI] [PubMed] [Google Scholar]
- Dingemanse, N. J. , Wright, J. , Kazem, A. J. N. , Thomas, D. K. , Hickling, R. , & Dawnay, N. (2007). Behavioural syndromes differ predictably between 12 populations of three‐spined stickleback. Journal of Animal Ecology, 76, 1128–1138. [DOI] [PubMed] [Google Scholar]
- Drake, J. M. (2007). Parental investment and fecundity, but not brain size, are associated with establishment success in introduced fishes. Functional Ecology, 21, 963–968. [Google Scholar]
- Edmunds, N. B. , Laberge, F. , & McCann, K. S. (2016). A role for brain size and cognition in food webs. Ecology Letters, 19, 948–955. [DOI] [PubMed] [Google Scholar]
- Fitzpatrick, J. L. , Almbro, M. , Gonzalez‐Voyer, A. , Hamada, S. , Pennington, C. , Scanlan, J. , & Kolm, N. (2012). Sexual selection uncouples the evolution of brain and body size in pinnipeds. Journal of Evolutionary Biology, 25, 1321–1330. [DOI] [PubMed] [Google Scholar]
- Fitzpatrick, S. W. , Torres‐Dowdall, J. , Reznick, D. N. , Ghalambor, C. K. , & Funk, W. C. (2014). Parallelism isn't perfect: Could disease and flooding drive a life‐history anomaly in trinidadian guppies? The American Naturalist, 183, 290–300. [DOI] [PubMed] [Google Scholar]
- Fraser, D. F. , Gilliam, J. F. , Daley, M. J. , Le, A. N. , & Skalski, G. T. (2001). Explaining leptokurtic movement distributions: Intrapopulation variation in boldness and exploration. The American Naturalist, 158, 124–135. [DOI] [PubMed] [Google Scholar]
- Fraser, D. F. , Gilliam, J. F. , MacGowan, M. P. , Arcaro, C. M. , & Guillozet, P. H. (1999). Habitat quality in a hostile river corridor. Ecology, 80, 597–607. [Google Scholar]
- Fraser, D. F. , & Lamphere, B. A. (2013). Experimental evaluation of predation as a facilitator of invasion success in a stream fish. Ecology, 94, 640–649. [DOI] [PubMed] [Google Scholar]
- Furness, A. I. , & Reznick, D. N. (2014). The comparative ecology of a killifish (Rivulus hartii) across aquatic communities differing in predation intensity. Evolutionary Ecology Research, 16, 249–265. [Google Scholar]
- Gadgil, M. , & Bossert, P. W. (1970). Life history consequences of natural selection. The American Naturalist, 104, 1–24. [Google Scholar]
- Gardmark, A. , & Dieckmann, U. (2006). Disparate maturation adaptations to size dependent mortality. Proceedings of the Royal Society B, 273, 2185–2192. [DOI] [PMC free article] [PubMed] [Google Scholar]
- Gilliam, J. F. , & Fraser, D. F. (2001). Movement in corridors: Enhancement by predation threat, disturbance, and habitat structure. Ecology, 82, 258–273. [Google Scholar]
- Gilliam, J. F. , Fraser, D. F. , & Alkinskoo, M. (1993). Structure of a tropical stream fish community—A role for biotic interactions. Ecology, 74, 1856–1870. [Google Scholar]
- Gittleman, J. L. (1994). Female brain size and parental care in carnivores. Proceedings of the National Academy of Sciences of the United States of America, 91, 5495–5497. [DOI] [PMC free article] [PubMed] [Google Scholar]
- Gonda, A. , Herczeg, G. , & Merila, J. (2009a). Adaptive brain size divergence in nine‐spined sticklebacks Pungitius pungitius? Journal of Evolutionary Biology, 22, 1721–1726. [DOI] [PubMed] [Google Scholar]
- Gonda, A. , Herczeg, G. , & Merila, J. (2009b). Habitat‐dependent and ‐independent plastic responses to social environment in the nine‐spined stickleback Pungitius pungitius brain. Proceedings of the Royal Society B, 276, 2085–2092. [DOI] [PMC free article] [PubMed] [Google Scholar]
- Gonda, A. , Herczeg, G. , & Merila, J. (2011). Population variation in brain size of nine‐spined sticklebacks Pungitius pungitius—Local adaptation or environmentally induced variation?. BMC Evolutionary Biology, 11, 1–11. [DOI] [PMC free article] [PubMed] [Google Scholar]
- Gonda, A. , Herczeg, G. , & Merila, J. (2013). Evolutionary ecology of intraspecific brain size variation: A review. Ecology and Evolution, 3, 2751–2764. [DOI] [PMC free article] [PubMed] [Google Scholar]
- Harris, S. , Ramnarine, I. W. , Smith, H. G. , & Pettersson, L. B. (2010). Picking personalities apart: Estimating the influence of predation, sex and body size on boldness in the guppy Poecilia reticulata . Oikos, 119, 1711–1718. [Google Scholar]
- Hembre, L. K. , & Peterson, L. A. (2013). Evolution of predator avoidance in a Daphnia population: Evidence from the egg bank. Hydrobiologia, 700, 245–255. [Google Scholar]
- Hudry, B. , Khadayate, S. , & Miguel‐Aliaga, I. (2016). The sexual identity of adult intestinal stem cells controls organ size and plasticity. Nature, 530, 344–348. [DOI] [PMC free article] [PubMed] [Google Scholar]
- Hutchings, J. A. (1993). Adaptive life histories affected by age‐specific survival and growth rate. Ecology, 74, 673–684. [Google Scholar]
- Ingley, S. J. , Rehm, J. , & Johnson, J. B. (2014). Size doesn't matter, sex does: A test for boldness in sister species of Brachyrhaphis fishes. Ecology and Evolution, 4, 4361–4369. [DOI] [PMC free article] [PubMed] [Google Scholar]
- Isler, K. , & van Schaik, C. (2006a). Costs of encephalization: The energy trade‐off hypothesis tested on birds. Journal of Human Evolution, 51, 228–243. [DOI] [PubMed] [Google Scholar]
- Isler, K. , & van Schaik, C. P. (2006b). Metabolic costs of brain size evolution. Biology Letters, 2, 557–560. [DOI] [PMC free article] [PubMed] [Google Scholar]
- Isler, K. , & van Schaik, C. P. (2009). The expensive brain: A framework for explaining evolutionary changes in brain size. Journal of Human Evolution, 57, 392–400. [DOI] [PubMed] [Google Scholar]
- Jackson, S. (1992). Do seabird gut sizes and mean retention times reflect adaptation to diet and foraging method. Physiological Zoology, 65, 674–697. [Google Scholar]
- Jarvis, E. D. , Gunturkun, O. , Bruce, L. , Csillag, A. , Karten, H. , Kuenzel, W. , … Butler, A. B. (2005). Avian brains and a new understanding of vertebrate brain evolution. Nature Reviews Neuroscience, 6, 151–159. [DOI] [PMC free article] [PubMed] [Google Scholar]
- Jonsson, B. , & Jonsson, N. (2014). Early environment influences later performance in fishes. Journal of Fish Biology, 85, 151–188. [DOI] [PubMed] [Google Scholar]
- Kaufman, J. A. , Hladik, C. M. , & Pasquet, P. (2003). On the expensive‐tissue hypothesis: Independent support from highly encephalized fish. Current Anthropology, 44, 705–707. [Google Scholar]
- Korn, H. (1992). Intestine lengths of southern African savanna rodents and insectivores—Intraspecific and interspecific comparisons. Journal of Zoology, 228, 455–460. [Google Scholar]
- Kotrschal, A. , Buechel, S. D. , Zala, S. M. , Corral‐Lopez, A. , Penn, D. J. , & Kolm, N. (2015a). Brain size affects female but not male survival under predation threat. Ecology Letters, 18, 646–652. [DOI] [PMC free article] [PubMed] [Google Scholar]
- Kotrschal, A. , Corral‐Lopez, A. , Amcoff, M. , & Kolm, N. (2015b). A larger brain confers a benefit in a spatial mate search learning task in male guppies. Behavioral Ecology, 26, 527–532. [DOI] [PMC free article] [PubMed] [Google Scholar]
- Kotrschal, A. , Corral‐Lopez, A. , Szidat, S. , & Kolm, N. (2015c). The effect of brain size evolution on feeding propensity, digestive efficiency, and juvenile growth. Evolution, 69, 3013–3020. [DOI] [PMC free article] [PubMed] [Google Scholar]
- Kotrschal, A. , Rogell, B. , Bundsen, A. , Svensson, B. , Zajitschek, S. , Brannstrom, I. , … Kolm, N. (2013a). Artificial selection on relative brain size in the guppy reveals costs and benefits of evolving a larger brain. Current Biology, 23, 168–171. [DOI] [PMC free article] [PubMed] [Google Scholar]
- Kotrschal, A. , Rogell, B. , Bundsen, A. , Svensson, B. , Zajitschek, S. , Brannstrom, I. , et al. (2013b). The benefit of evolving a larger brain: Big‐brained guppies perform better in a cognitive task. Animal Behaviour, 86, E4–E6. [DOI] [PMC free article] [PubMed] [Google Scholar]
- Kotrschal, A. , Rogell, B. , Maklakov, A. A. , & Kolm, N. (2012a). Sex‐specific plasticity in brain morphology depends on social environment of the guppy, Poecilia reticulata . Behavioral Ecology and Sociobiology, 66, 1485–1492. [Google Scholar]
- Kotrschal, A. , Sundstrom, L. F. , Brelin, D. , Devlin, R. H. , & Kolm, N. (2012b). Inside the heads of David and Goliath: Environmental effects on brain morphology among wild and growth‐enhanced coho salmon Oncorhynchus kisutch . Journal of Fish Biology, 81, 987–1002. [DOI] [PubMed] [Google Scholar]
- Kotrschal, A. , Szidat, S. , & Taborsky, B. (2014). Developmental plasticity of growth and digestive efficiency in dependence of early‐life food availability. Functional Ecology, 28, 878–885. [DOI] [PMC free article] [PubMed] [Google Scholar]
- Law, R. (1979). Optimal life histories under age‐specific predation. The American Naturalist, 114, 399–417. [Google Scholar]
- Lima, S. L. , & Dill, L. M. (1990). Behavioral decisions made under the risk of predation—A review and prospectus. Canadian Journal of Zoology, 68, 619–640. [Google Scholar]
- Lonnstedt, O. M. , McCormick, M. I. , & Chivers, D. P. (2012). Well‐informed foraging: Damage‐released chemical cues of injured prey signal quality and size to predators. Oecologia, 168, 651–658. [DOI] [PubMed] [Google Scholar]
- MacLean, E. L. , Hare, B. , Nunn, C. L. , Addessi, E. , Amici, F. , Anderson, R. C. , et al. (2014). The evolution of self‐control. Proceedings of the National Academy of Sciences of the United States of America, 111, E2140–E2148. [DOI] [PMC free article] [PubMed] [Google Scholar]
- Magurran, A. E. , & Seghers, B. H. (1994). A cost of sexual harassment in the guppy, Poecilia reticulata . Proceedings of the Royal Society B, 258, 89–92. [Google Scholar]
- Michod, R. E. (1979). Evolution of life histories in response to age‐specific mortality factors. The American Naturalist, 113, 531–550. [Google Scholar]
- Mink, J. W. , Blumenschine, R. J. , & Adams, D. B. (1981). Ratio of central nervous system to body metabolism in invertebrates—Its constancy and functional basis. American Journal of Physiology, 241, R203–R212. [DOI] [PubMed] [Google Scholar]
- Navarrete, A. , van Schaik, C. P. , & Isler, K. (2011). Energetics and the evolution of human brain size. Nature, 480, 91–U252. [DOI] [PubMed] [Google Scholar]
- Olsson, J. , Quevedo, M. , Colson, C. , & Svanbäck, R. (2007). Gut length plasticity in perch: Into the bowels of resource polymorphisms. Biological Journal of the Linnean Society, 90, 517–523. [Google Scholar]
- Overington, S. E. , Morand‐Ferron, J. , Boogert, N. J. , & Lefebvre, L. (2009). Technical innovations drive the relationship between innovativeness and residual brain size in birds. Animal Behaviour, 78, 1001–1010. [Google Scholar]
- Piersma, T. , & Lindstrom, A. (1997). Rapid reversible changes in organ size as a component of adaptive behaviour. Trends in Ecology & Evolution, 12, 134–138. [DOI] [PubMed] [Google Scholar]
- Plijanowska, J. , Weider, L. J. , & Lampert, W. (1993). Predator‐mediated genotypic shifts in a prey population: Experimental evidence. Oecologia, 96, 40–42. [DOI] [PubMed] [Google Scholar]
- Raichle, M. E. , & Gusnard, D. A. (2002). Appraising the brain's energy budget. Proceedings of the National Academy of Sciences of the United States of America, 99, 10237–10239. [DOI] [PMC free article] [PubMed] [Google Scholar]
- Reader, S. M. , Hager, Y. , & Laland, K. N. (2011). The evolution of primate general and cultural intelligence. Philosophical Transactions of the Royal Society of London. Series B, 366, 1017–1027. [DOI] [PMC free article] [PubMed] [Google Scholar]
- Reiff, T. , Jacobson, J. , Cognigni, P. , Antonello, Z. , Ballesta, E. , Tan, K. J. , … Miguel‐Aliaga, I. (2015). Endocrine remodelling of the adult intestine sustains reproduction in Drosophila. ELIFE, 4, e06930. [DOI] [PMC free article] [PubMed] [Google Scholar]
- Relyea, R. A. , & Auld, J. R. (2004). Having the guts to compete: How intestinal plasticity explains costs of inducible defences. Ecology Letters, 7, 869–875. [Google Scholar]
- Reznick, D. , & Endler, J. A. (1982). The impact of predation on life‐history evolution in Trinidadian guppies Poecilia reticulata. Evolution, 36, 160–177. [DOI] [PubMed] [Google Scholar]
- Rodd, F. H. , & Reznick, D. N. (1997). Variation in the demography of guppy populations: The importance of predation and life histories. Ecology, 78, 405–418. [Google Scholar]
- Savory, C. J. , & Gentle, M. J. (1976). Changes in food intake and gut size in Japanese quail in response to manipulation of dietary fiber content. British Poultry Science, 17, 571–580. [DOI] [PubMed] [Google Scholar]
- Shultz, S. , & Dunbar, R. I. M. (2006a). Both social and ecological factors predict ungulate brain size. Proceedings of the Royal Society B, 273, 207–215. [DOI] [PMC free article] [PubMed] [Google Scholar]
- Shultz, S. , & Dunbar, R. I. M. (2006b). Chimpanzee and felid diet composition is influenced by prey brain size. Biology Letters, 2, 505–508. [DOI] [PMC free article] [PubMed] [Google Scholar]
- Siems, D. P. , & Sikes, R. S. (1998). Tradeoffs between growth and reproduction in response to temporal variation in food supply. Environmental Biology of Fishes, 53, 319–329. [Google Scholar]
- Sih, A. , Kats, L. B. , & Maurer, E. F. (2003). Behavioural correlations across situations and the evolution of antipredator behaviour in a sunfish‐salamander system. Animal Behaviour, 65, 29–44. [Google Scholar]
- Sol, D. , Bacher, S. , Reader, S. M. , & Lefebvre, L. (2008). Brain size predicts the success of mammal species introduced into novel environments. The American Naturalist, 172, S63–S71. [DOI] [PubMed] [Google Scholar]
- Sol, D. , & Lefebvre, L. (2000). Behavioural flexibility predicts invasion success in birds introduced to New Zealand. Oikos, 90, 599–605. [Google Scholar]
- Sol, D. , Szekely, T. , Liker, A. , & Lefebvre, L. (2007). Big‐brained birds survive better in nature. Proceedings of the Royal Society B, 274, 763–769. [DOI] [PMC free article] [PubMed] [Google Scholar]
- Sparkes, T. C. (1996a). Effects of predation risk on population variation in adult size in a stream dwelling isopod. Oecologia, 106, 85–92. [DOI] [PubMed] [Google Scholar]
- Sparkes, T. C. (1996b). The effects of size dependent predation risk on the interaction between behavioral and life history traits in a stream dwelling isopod. Behavioral Ecology and Sociobiology, 39, 411–417. [Google Scholar]
- Starck, J. M. (1996). Phenotypic plasticity, cellular dynamics, and epithelial turnover of the intestine of Japanese quail Coturnix coturnix japonica. Journal of Zoology, 238, 53–79. [Google Scholar]
- Stearns, S. C. (1992). The evolution of life histories. Oxford, UK: Oxford University Press. [Google Scholar]
- Striedter, G. F. (2005). Principles of brain evolution. Sunderland, UK: Sinauer Associates. [Google Scholar]
- Sullam, K. E. , Dalton, C. M. , Russell, J. A. , Kilham, S. S. , El‐Sabaawi, R. , German, D. P. , Flecker, A. S. (2015). Changes in digestive traits and body nutritional composition accommodate a trophic niche shift in Trinidadian guppies. Oecologia, 177, 245–257. [DOI] [PubMed] [Google Scholar]
- Taylor, A. B. , & van Schaik, C. P. (2007). Variation in brain size and ecology in Pongo. Journal of Human Evolution, 52, 59–71. [DOI] [PubMed] [Google Scholar]
- Tebbich, S. , & Bshary, R. (2004). Cognitive abilities related to tool use in the woodpecker finch, Cactospiza pallida . Animal Behaviour, 67, 689–697. [Google Scholar]
- Tsuboi, M. , Husby, A. , Kotrschal, A. , Hayward, A. , Buechel, S. D. , Zidar, J. , … Kolm, N. (2015). Comparative support for the expensive tissue hypothesis: Big brains are correlated with smaller gut and greater parental investment in Lake Tanganyika cichlids . Evolution, 69, 190–200. [DOI] [PMC free article] [PubMed] [Google Scholar]
- Tulley, J. J. , & Huntingford, F. A. (1988). Additional information on the relationship between intraspecific aggression and anti‐predator behavior in the three spined stickleback, Gasterosteus aculeatus . Ethology, 78, 219–222. [Google Scholar]
- Urban, M. C. (2007). Risky prey behavior evolves in risky habitats. Proceedings of the National Academy of Sciences of the United States of America, 104, 14377–14382. [DOI] [PMC free article] [PubMed] [Google Scholar]
- Wagner, C. E. , McIntyre, P. B. , Buels, K. S. , Gilbert, D. M. , & Michel, E. (2009). Diet predicts intestine length in Lake Tanganyika's cichlid fishes. Functional Ecology, 23, 1122–1131. [Google Scholar]
- Walsh, M. R. , Broyles, W. , Beston, S. M. , & Munch, S. B. (2016). Predator‐driven brain size evolution in natural populations of Trinidadian killifish Rivulus hartii . Proceedings of the Royal Society B, 283, 20161075. [DOI] [PMC free article] [PubMed] [Google Scholar]
- Walsh, M. R. , Fraser, D. F. , Bassar, R. D. , & Reznick, D. N. (2011). The direct and indirect effects of guppies: Implications for life‐history evolution in Rivulus hartii . Functional Ecology, 25, 227–237. [Google Scholar]
- Walsh, M. R. , & Reznick, D. N. (2008). Interactions between the direct and indirect effects of predators determine life history evolution in a killifish. Proceedings of the National Academy of Sciences of the United States of America, 105, 594–599. [DOI] [PMC free article] [PubMed] [Google Scholar]
- Walsh, M. R. , & Reznick, D. N. (2009). Phenotypic diversification across an environmental gradient: a role for predators and resource availability on the evolution of life histories. Evolution, 63, 3201–3213. [DOI] [PubMed] [Google Scholar]
- Walsh, M. R. , & Reznick, D. N. (2010). Influence of the indirect effects of guppie son life history evolution in Rivulus hartii . Evolution, 64, 1583–1593. [DOI] [PubMed] [Google Scholar]
- Walsh, M. R. , & Reznick, D. N. (2011). Experimentally induced life history evolution in a killifish in response to the introduction of guppies. Evolution, 65, 1021–1036. [DOI] [PubMed] [Google Scholar]
- Wellborn, G. A. (1994). Size‐biased predation and prey life histories—A comparative study of freshwater amphipod populations. Ecology, 75, 2104–2117. [Google Scholar]
- Yang, Y. , & Joern, A. (1994). Gut size changes in relation to variable food quality and body size in grasshoppers. Functional Ecology, 8, 36–45. [Google Scholar]
- Yoshida, T. , Jones, L. E. , Ellner, S. P. , Fussmann, G. F. , & Hairston, N. G. (2003). Rapid evolution drives ecological dynamics in a predator–prey system. Nature, 424, 303–306. [DOI] [PubMed] [Google Scholar]
Associated Data
This section collects any data citations, data availability statements, or supplementary materials included in this article.
Supplementary Materials