

Visual sensitivity and activity in brain area V1 were studied in a paradigm that included saccadic eye movements and natural visual input. V1 responses and contrast sensitivity were significantly reduced compared with results in common laboratory paradigms. The parallel neural and perceptual effects of eye movements and stimulus complexity appear to be due to a form of rapid adaptation that carries across saccades.
Keywords: adaptation, contrast response, primary visual cortex, saccades
Abstract
Contrast sensitivity is fundamental to natural visual processing and an important tool for characterizing both visual function and clinical disorders. We simultaneously measured contrast sensitivity and neural contrast response functions and compared measurements in common laboratory conditions with naturalistic conditions. In typical experiments, a subject holds fixation and a stimulus is flashed on, whereas in natural vision, saccades bring stimuli into view. Motivated by our previous V1 findings, we tested the hypothesis that perceptual contrast sensitivity is lower in natural vision and that this effect is associated with corresponding changes in V1 activity. We found that contrast sensitivity and V1 activity are correlated and that the relationship is similar in laboratory and naturalistic paradigms. However, in the more natural situation, contrast sensitivity is reduced up to 25% compared with that in a standard fixation paradigm, particularly at lower spatial frequencies, and this effect correlates with significant reductions in V1 responses. Our data suggest that these reductions in natural vision result from fast adaptation on one fixation that lowers the response on a subsequent fixation. This is the first demonstration of rapid, natural-image adaptation that carries across saccades, a process that appears to constantly influence visual sensitivity in natural vision.
NEW & NOTEWORTHY Visual sensitivity and activity in brain area V1 were studied in a paradigm that included saccadic eye movements and natural visual input. V1 responses and contrast sensitivity were significantly reduced compared with results in common laboratory paradigms. The parallel neural and perceptual effects of eye movements and stimulus complexity appear to be due to a form of rapid adaptation that carries across saccades.
our ability to detect contrast, differences between light and dark, is the foundation for visual perception and the brain's coding of visual information. For well over a century, contrast sensitivity has been an important tool for quantifying the limits of vision in both normal and clinical situations (Arden 1978; Campbell and Green 1965; Fechner 1860; Robson 1993). It is useful for the assessment and early diagnosis of a variety of visual diseases (Arden and Jacobson 1978; Elliot et al. 1990; Sokol et al. 1985). Contrast sensitivity is also a valuable predictor of “real-world” vision because it influences the ability to recognize faces and objects as well as road signs, obstacles, and pedestrians while driving (Owsley and Sloane 1987; Wood and Owens 2005).
In the present study our goal was to measure and compare contrast sensitivity and neural contrast response functions under standard laboratory conditions and in a more naturalistic paradigm. Previous studies have reported macaque contrast sensitivity (De Valois et al. 1974) or contrast response functions (Albrecht and Hamilton 1982) in simple fixation paradigms. Palmer et al. (2007) recorded both V1 activity and behavioral responses as a function of contrast in a reaction-time detection paradigm. To our knowledge, our study is the first to make simultaneous assessments of the contrast sensitivity function and neuronal responses, and to demonstrate how these measures are altered in natural vision.
To test the effect of natural vision on brain activity and perception, we compared measurements made in a naturalistic paradigm, in which a saccadic eye movement brings a visual receptive field to a stimulus that is already present, with measurements made in a typical fixation paradigm with flashed stimuli. There has been an accumulation of evidence indicating that vision and visual responses in natural situations differ in significant ways from the results of more reduced experiments that lack stimulus complexity and saccades (Dorr and Bex 2013; Felsen and Dan 2005; Gallant et al. 1998; Kayser et al. 2003, 2004; Simoncelli and Olshausen 2001; Yu and Lee 2000). For example, researchers in several studies have found that visual responses evoked in primary visual cortex by complex stimuli and/or eye movements appear to reflect a more sparse code than responses to isolated stimuli under sustained fixation (Hubel 1958; Livingstone et al. 1996; MacEvoy et al. 2008; Vinje and Gallant 2000).
In a previous study of macaque V1, we found that neural responses recorded in a naturalistic paradigm, which includes complex stimuli and saccades, are significantly lower in amplitude compared with responses in a standard laboratory paradigm (Ruiz and Paradiso 2012). This suggests that more contrast may be required to produce the same V1 response in a naturalistic experimental paradigm than in a typical fixation paradigm. This simple inference may have significant implications for natural vision because of the importance of contrast sensitivity. In this study we test the hypothesis that in naturalistic vision, perceptual contrast sensitivity will be reduced and that this will be accompanied by corresponding reductions in the contrast response functions of V1 neurons.
We have found that the relationship between V1 activity and contrast detection is similar in reduced and naturalistic paradigms; there appears to be a rather fixed relationship between the firing rate of V1 neurons and the ability to detect contrast. The effect of a naturalistic paradigm is to significantly lower V1 responses, and this is accompanied by lower perceptual sensitivity. It appears that a novel form of rapid adaptation to a complex image, which carries across saccades, is responsible for the reduced visual performance in the more natural situation. Presumably, this adaptation is always at work in natural vision. Because contrast sensitivity is important in characterizing normal and pathological vision, the findings suggest that it may be best to measure contrast sensitivity with a more natural paradigm to most accurately assess day-to-day visual function.
MATERIALS AND METHODS
Experimental subjects and preparation.
Three male rhesus macaques were used in these experiments (monkey F weighed 10.4 kg, monkey S weighed 9.9 kg, and monkey Z weighed 14.5 kg). All animal procedures conformed to National Institutes of Health guidelines and were approved by the Brown University Institutional Animal Care and Use Committee. In separate aseptic surgical procedures, each animal was implanted with a custom titanium head post and a 96-channel “Utah” array (Blackrock Microsystems). The array of 1-mm electrodes was placed in area V1 of the right hemisphere.
Physiological recordings.
Electrode recordings were made while animals sat in a primate chair (Crist Instrument) and performed the behavioral tasks described below. A Cerebus recording system (Blackrock Microsystems) recorded local field potentials and spiking activity at 30 kHz. A preliminary isolation of single-unit activity was made online and later confirmed with Offline Sorter (Plexon). In some sessions, multiunit responses were recorded (see Data analysis). Receptive fields (RFs) were hand-mapped with a small bar of light, and the minimum response field was measured. All RFs were located in the lower left visual field; the average eccentricities of RFs in the 3 animals were 3.6° (SD 0.9°) in monkey F, 4.5° (SD 0.5°) in monkey S, and 4.5° (SD 0.4°) in monkey Z. Histological reconstructions have not been made because the animals are involved in ongoing follow-up experiments; on the basis of electrode length, RF organization, and tuning properties, the neurons studied were likely in cortical layer 3. Before beginning the primary experiments that quantified contrast sensitivity, fixation tasks were used to measure the optimal spatial frequency and orientation with Gabor stimuli. Optimized stimuli were used in the subsequent contrast experiments.
Eye position was recorded at 1 kHz using an EyeLink 1000 infrared eye tracker (SR Research) and was used to monitor behavioral performance. Calibrated eye position was continuously reported to the experimental control system and saved by the Cerebus recording system for offline analysis.
Visual stimuli.
The test stimulus was a small static Gabor patch on a full-screen natural-image background or a uniform gray background. All stimuli were presented in a dimly lit room on a cathode ray tube monitor with a P22 phosphor (Iiyama ViewMaster HM204DT). The refresh rate was 120 Hz, and the resolution was 1,280 × 1,024 pixels. The visual display was 63 cm from the subject and subtended 33° wide × 26° high. The two-dimensional Gabor stimuli had spatial frequencies of 1, 2, 4, 6, or 8 cycles per degree (cpd) and variable Michelson contrast. The natural scene used as a background was taken from the van Hateren database of grayscale images (van Hateren and van der Schaaf 1998). In all experiments and conditions presented in this article, the same natural image was used. Variation in RF location effectively created unique stimuli for each neuron. The mean luminance of the natural scene was 55 cd/m2; when a uniform gray background was used, it had the same luminance as the entire natural-image background.
Stimuli were generated in MATLAB (The MathWorks, Natick, MA), using customized scripts with Psychtoolbox (Brainard 1997; Kleiner et al. 2007; Pelli 1997), and saved as JPEG images. During experiments, these stimuli were presented using the MonkeyLogic experimental control system (Asaad et al. 2013), which is essentially a MATLAB toolbox running under Microsoft Windows in conjunction with other display software (DirectX) to provide nearly real-time command of experiments. The Cerebus system recorded photodiode input, which indicated stimulus onset, at 10 kHz as well as input from the EyeLink tracker. The response latency of the eye tracker is 2 ± 0.5 ms, and this small delay was factored into the comparison with the visual stimulus timing reported by the photodiode. If there was any possibility that temporal jitter in the visual stimulation system interfered with stimulus presentation during the saccade in the Saccade condition, a trial was discarded. Stimulus onset times, eye position, and neural responses were all recorded by the same Cerebus system, allowing for alignment of all the signals used during data analysis.
Experimental design.
Monkeys were trained on the two-alternative forced-choice (2AFC) task shown in Fig. 1A. A Gabor stimulus was presented at one of two locations on a natural-scene background, and the animal indicated at which location the Gabor appeared. Behavioral and neuronal data were collected simultaneously. As described in detail below, two versions of the experiment were run (Flash and Saccade) that mimicked a common laboratory fixation condition and a more natural condition, respectively.
Fig. 1.

Flash and Saccade versions of the contrast sensitivity experiment and exemplary single-unit responses. The background in the task was a natural image; for clarity in the figure, contrast and brightness in the natural image have been reduced. The test stimulus was a Gabor patch presented either in the receptive field (RF) of a neuron (yellow circle; not shown in experiment) or at a comparable eccentricity above the horizontal midline (possible Gabor locations are suggested by the white circles that were not actually present). To prevent the natural image from entering the RF, a gray “buffer patch,” with a diameter wider than the classical RF, covered the RF and the Gabor was superimposed on the buffer. The buffer was sized such that the natural-image background would not enter the RF under study as long as the eyes stayed within the fixation window. An identical buffer patch covered the other possible stimulus location. A: in the Flash condition, the Gabor was presented after fixation was held for 150 ms at the second (central) fixation point. Red arrows represent saccades. B: in the Saccade condition, a saccade brought the RF onto a Gabor that was turned on during the saccade. The difference between conditions is that in the Flash condition, there is a forced 150-ms fixation (illustrated by middle panel in A). In the Saccade condition, there is no 150-ms fixation period, and the saccade brings the yellow RF to a stimulus that is already present on the scene (as in natural vision). C and D: exemplary responses of 2 single units across the entire extent of Flash (top) and Saccade (bottom) trials. The time axis in the Flash trials is longer because it includes the 150-ms hold period, preceding presentation of the Gabor, during which fixation 2 was verified. Gray bars indicate trials in which a Gabor is flashed in the RF, green bars show trials in which the Gabor comes into the RF by a saccade, and light purple bars show trials in which the Gabor is presented outside the RF. Overlap of data with stimuli inside and outside the RF is shown in dark purple (top) and dark green (bottom). Bin width is 10 ms, and data are aligned to the time at which the stimulus is fully within the RF. Blue and yellow shading at the bottom of each PSTH indicates the duration of the first and second fixations, respectively. Pointers in D indicate eye movement responses. Fix, fixation; Stim, stimulation; spk/s, spikes/s.
Trials began with the presentation of a red spot (0.3° in diameter) located 7° to the right of the screen center. For the trial to proceed, the animal had to acquire this fixation point within 2 s and hold fixation for 400 ms. After 400 ms, a second red fixation point appeared at the center of the screen (7° to the left of the first point) and the first fixation point was extinguished. The animal was required to saccade to the second fixation point within 200 ms of it being turned on and to complete this saccade within 80 ms once initiated. This 80-ms restriction was implemented to catch any trials in which the animal attempted to make multiple saccades within the 200-ms interval. A trial was aborted if the animal moved its eyes more than 0.8° from the first or second fixation point during the fixation period. In the vicinity of the second fixation point were two small circular gray patches, slightly larger than the RF, which had the same mean luminance as the entire background image and were superimposed on it. One of these “buffer patches” was below and to the left of the fixation point on the visual display and would encompass the RF of one or more neurons after the saccade (electrode arrays in all animals were placed such that RFs were in the lower left visual quadrant). The other buffer patch was at an equal eccentricity superior to the fixation point. The buffer patches were used to prevent the natural-image background from stimulating the RF (minimum response field). To this end, the size of each buffer patch was set to be larger than the sum of the RF and the allowable eye jitter during fixation (0.8°). During or after the saccade used to acquire the second fixation point (see condition details below), a Gabor stimulus appeared in the upper or lower buffer patch. The buffer patch ensured that only the Gabor stimulus, and not the natural-scene background, stimulated the classical RF(s). In half of the trials the stimulus was presented at the RF location, and in the other half of the trials the stimulus was presented at the other location. The location of the stimulus and the type of condition were randomized.
Two variations of the experiment were run to compare contrast sensitivity in a more natural paradigm with sensitivity in a more typical laboratory condition. For brevity, we refer to these paradigms by the way in which the test stimulus entered an RF: Flash or Saccade. The Flash condition (Fig. 1A) was meant to replicate typical behavioral neurophysiology paradigms in which a stimulus is flashed on after an animal holds fixation for a short period of time. In the present study, the animal acquired the second fixation point and was required to hold fixation for 150 ms while the gray buffer patch covered the RF; only after this delay was the Gabor flashed on at one of the two stimulus locations. The Saccade condition (Fig. 1B) was designed to be as natural as possible within the experimental constraints. As in natural vision, the Gabor stimulus was present in the visual scene before it entered an RF. Rather than flashing on, it entered an RF by the sweep of a saccade. To have the Gabor present before it appeared in an RF but prevent the animal from investigating it during the first fixation, the eye tracker detected saccade onset and turned the Gabor stimulus on at one of the two locations during the saccade to the second fixation point. Thus the saccade took the RF onto the already present Gabor stimulus (and buffer patch). Response latency in the Saccade condition was measured relative to the time that the Gabor stimulus was first fully within the RF, the time at which the eye position was measured to be over the central fixation point. In both Flash and Saccade conditions, the animals maintained fixation on the central point and the Gabor stimulus was left on for ∼200 ms. In the Saccade condition, due to slight variability in the stimulus presentation time relative to saccade onset, the Gabor patch was left on for 2–3 frames (16.6 to 24.9 ms) longer than in the Flash condition. This ensured that the stimulus was left on for at least 200 ms inside the RF in all conditions. Importantly, this small difference in display time cannot account for our findings: even the early portions of the Flash and Saccade neural responses were different, and behavioral performance was notably worse in the Saccade condition even though this condition experienced a slightly longer stimulus duration.
After the Gabor was turned off, a small red spot was presented in each of the two buffer patches. When the central fixation point was extinguished, the animals indicated the location where the Gabor stimulus had appeared by making an eye movement to one of the two spots within 300 ms. Correct responses were immediately followed by a juice reward. Incorrect responses were not rewarded, and 2 s were added to the intertrial interval as a time-out. The intertrial interval was 2–4 s, varying for different animals and for certain types of errors made during the experiment. For example, early or extraneous saccades resulted in a longer intertrial “time-out” period.
Contrast sensitivity experiment.
The main goal of the study was to measure perceptual contrast sensitivity functions (CSFs) and neural contrast response functions in natural (saccade) and laboratory (flash) situations. This main experiment was performed in all three animals. Contrast sensitivity and contrast responses were measured with the method of constant stimuli. Five or six contrasts were used for each of the Flash and Saccade conditions, giving 10 or 12 subconditions. For each of these subconditions, trials were run with the Gabor stimulus in the lower visual field and upper visual field, which produced 20 or 24 total conditions per session. Typical sessions resulted in 30–40 completed trials per condition, or about 600–800 total trials.
The contrast range chosen for each neuron was determined by the spatial frequency of the Gabor stimulus (optimized for each neuron, chosen from 1, 2, 4, 6, or 8 cpd) and the eccentricity of the RF under study. The contrast range was set such that at the lowest contrasts tested, the animal was at or near chance performance in the 2AFC task. The highest contrast tested was such that the animal was at or near 100% correct. The range of Michelson contrasts was typically 5–20%; the values were generally similar for different neurons because RF eccentricity was in a narrow range for neurons recorded on the electrode arrays, and the arrays were similarly positioned in the three animals.
Spatial frequency experiment.
To test a hypothesis that arose after conducting the contrast sensitivity experiment, we performed further experiments, using monkey S, in which spatial frequency rather than contrast was varied. In each of these 16 recording sessions, contrast was set to a moderately high value (10–48%, with an average of 27%) to elicit a strong neural response. The upper bound of 48% contrast was used because that was the contrast used in the study by Ruiz and Paradiso (2012); the lower bound of 10% was chosen because at this value (and above) neurons showed clear stimulus-induced responses and the animals performed well-above chance. The method of constant stimuli was used to measure responses at spatial frequencies of 1, 2, 4, 6, and 8 cpd in the same flash and saccade conditions as the main contrast sensitivity experiment.
Diminished-adaptation experiment.
To test a hypothesis about underlying mechanisms, we altered the visual stimulus present in the RF on the first fixation (fixation to the right of screen center). This experiment was performed in 20 sessions with monkey F. The only difference from the main contrast sensitivity experiment was that two gray buffer patches were placed near the first fixation point in addition to the two buffer patches near the second fixation point. Thus, at the two retinotopic locations where a Gabor stimulus might appear on fixation 2, there were buffer patches covering the natural-scene background on fixation 1. The intent was to eliminate adaptation on fixation 1 to the natural-scene background at the retinotopic locations where test stimuli would be placed on fixation 2.
Data analysis.
Custom scripts in MATLAB were used to analyze both physiological and psychophysical data. With few exceptions, two psychometric curves were created each day from the psychophysics data, one for the Flash condition and one for the Saccade condition. Each curve was then fit with a logistic function using the Palamedes toolbox in MATLAB (Prins and Kingdom 2014). Contrast threshold was defined as the contrast at which the subject correctly reported the Gabor location on 80% of the trials. Contrast sensitivity is reported as the inverse of the contrast threshold.
Single-unit and multiunit responses were classified and discriminated using Offline Sorter. To avoid resampling from the same neuron(s) across recording sessions, activity from each electrode was recorded in only one session. Multiunit responses were analyzed only if there was a clearly defined RF. We did not observe any clear differences between multi- and single-unit responses, so they were combined in the population analyses. For population analyses, neural responses on different days were often normalized before being averaged. Unit responses were normalized by dividing the peristimulus time histograms (PSTHs) in both Flash and Saccade conditions by the peak response across the two conditions. When baseline firing rate was used for comparison, it was calculated as the average firing rate during the no-stimulus Flash condition: in this condition, only the gray buffer patch was present in the RF.
Eye position was used to monitor performance during the tasks and was examined offline. Careful analysis of eye position was made to estimate “stimulus onset” in the saccade condition. In that case, stimulus onset time (time 0 on response plots) was defined as the time at which the Gabor stimulus was first fully within the RF at the end of a saccade. The criterion used was the time at which the saccade velocity fell to 0.6% of the peak velocity. We found, across three animals, that this objective procedure, combined with the test for fixation location, reliably matched stimulus onset times estimated by eye.
Choice probability (CP) analysis was performed on 40 units from the main contrast sensitivity experiment for which contrast was varied over a significant range and behavioral performance varied from near chance (∼50% correct) to above threshold (80% correct). Choice probability analysis is a form of receiver operating characteristic (ROC) analysis, in which a criterion threshold is swept across firing rate distributions of correct and incorrect behavioral responses to yield a measure of choice-related neuronal activity (Britten et al. 1996). For our analysis, we included all conditions (contrasts) with at least three correct and three incorrect choices. We only used trials in which the stimulus was presented in the RF (omitting trials where the stimulus was presented in the upper visual field). Thus “correct” means that the animal indicated that the Gabor stimulus was in the lower visual field RF, whereas “incorrect” means the animal indicated the Gabor was in the upper visual field. Because we performed the analysis to examine the overall relationship between contrast sensitivity and V1 firing rates, we combined Saccade and Flash trials. An ROC curve was created by sweeping a criterion value across the firing rate distributions for correct and incorrect responses and measuring the hit and false alarm rates at each criterion step. The hit rate is the fraction of correct responses made on trials with response rates above the criterion; the false alarm rate is the fraction of incorrect responses made with response rates above the criterion. After plotting the hit rates vs. false alarm rates at each criterion step, we calculated the area under the curve (AUC) using the trapezoidal integration method (in MATLAB). The AUC represents the probability that, given a randomly selected firing rate from a correct trial and a randomly selected firing rate from an incorrect trial, an observer would be able to correctly classify which trial led to a correct choice by the animal. For this reason, the AUC is referred to as choice probability. A CP value of 0.5 represents chance performance, and a CP value of 1.0 represents perfect performance in classifying the animal's choice based on firing rate.
As in Britten et al. (1996), we applied a permutation test to determine significance for each of our CPs in each condition: we measured a CP value and then randomly reassigned “correct” or “incorrect” labels to the firing rates. We then recalculated an ROC curve and measured the AUC. This was repeated 3,000 times for each condition, yielding 3,000 possible CPs. If the actual CP was in the 5% tails of this distribution, it was considered significant.
Next, for each unit, we took any conditions in which there were at least three correct and three incorrect responses and z-scored the data within these conditions. We then aggregated the data across conditions and repeated the ROC procedure to create CP values for individual V1 units. We repeated the permutation test to examine the significance of these choice probabilities.
Finally, a “grand choice probability” was calculated by combining all of the z-scored data from all units and generating an ROC, again followed by the permutation test.
Curve fitting.
Custom scripts in MATLAB were used to analyze both physiological and psychophysical data. Psychophysical performance on contrast detection was measured over a range of contrast values in both Flash and Saccade conditions. To fit psychometric functions for each of the two conditions, logistic functions from the Palamedes toolbox in MATLAB were used (Prins and Kingdom 2014). Sigmoid functions were of the form
where α is the detection threshold, β is a slope factor, γ is the guess rate (50%), and λ is the lapse rate. All parameters were fit using maximum likelihood estimation. Contrast threshold was defined as the contrast at which the subject correctly reported the Gabor location on 80% of the trials. Contrast sensitivity is reported as the inverse of the contrast threshold.
To describe aggregate neural responses across contrasts (Fig. 4), we fit a Naka-Rushton equation as in Albrecht and Hamilton (1982). Least-squares parameter estimates were made with the fitNakaRushton function in Psychtoolbox (Brainard 1997). The equation used is
Fig. 4.

Firing rates in the 50–200 ms stimulus interval at each contrast tested in each cell. Black symbols represent Flash condition; gray symbols represent Saccade condition. Crosses denote responses in trials when the monkey correctly detected the Gabor patch inside the RF, and open circles show neural responses from incorrect behavioral trials. Only trials that yielded responses at least 2 SE above the baseline firing rate were included in this plot, and responses over 100 spikes/s are not displayed (there were 8 such data points). Solid lines represent Naka-Rushton equation fits to the data from the correct trials. The difference between overall average Flash and average Saccade responses was significant (P < 0.0001, right-tailed t-test); there was no significant difference between neural responses from correct vs. incorrect trials within either the Flash or Saccade condition (P > 0.05, right-tailed t-test). The inset represents an exemplary single unit from monkey F, showing the difference in average firing rate between the Flash (black) and Saccade (gray) conditions as contrast increases from 4% to 12%. The data in the inset are not divided into correct and incorrect trials.
where R is the neuronal response (in spikes/s), C is contrast, Rmax is the maximum neural response, C50 is the contrast that gives a half-maximal response, and M is the average baseline firing rate.
In Fig. 7 the sigmoidal relationship between the contrast detection rate (F) and neural response (x), is fit with a logistic function of the form
Fig. 7.
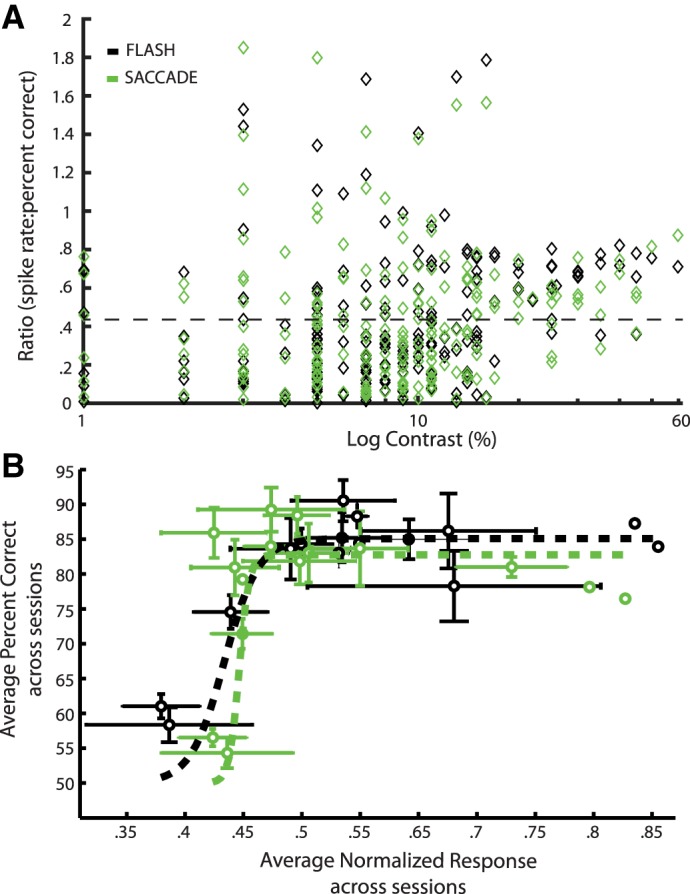
Relationships between contrast detection and neural responses. A: for each contrast used in each cell, the average stimulus response was divided by percent correct in the detection task. These values represent the “neural activity-to-behavioral performance” ratio. The variance of this ratio decreases as threshold contrasts are reached (7–17% contrast). The dotted line shows the mean ratio (0.43), which was the same in Flash and Saccade conditions. The Flash and Saccade ratios were not significantly different (P = 0.93, t-test). B: for each of 15 contrast bins, average percent correct is plotted against the average normalized neuronal responses in the Flash (black) and Saccade (green) conditions. Data were partitioned into bins of 3% contrast width (e.g., 1–3%, 4–6%, etc.). These data come from 40 sessions in 3 animals in which contrast was varied. Error bars represent ±SE along both axes. Dotted lines represent logistic function fits constrained to begin at 50% correct.
where x50 is the neural response rate at the inflection point, L is the saturation, and β is the slope.
RESULTS
The experiments reported in this article had several interrelated aims: to simultaneously measure behavioral contrast sensitivity and neural contrast sensitivity functions, to compare behavioral and neural performance, and to test the hypothesis that behavioral and neural performance are reduced in a parallel fashion in a naturalistic paradigm (when stimuli are brought into view via saccades rather than being flashed on). The latter aim was actually the starting point for the study, because previous experiments in our laboratory found that an optimal stimulus entering a RF by saccade across a complex background produces a significantly weaker response than the same stimulus flashed into the RF of a fixating animal (Ruiz and Paradiso 2012). Because most of the published data on V1 visual responses come from experiments with flashed stimuli, this finding may have important implications for our understanding and assessment of vision in more natural situations. To properly compare vision with conventional flashed stimuli and stimuli acquired by saccades, we were led to consider behavioral and neural responses more generally, as well as the relationship between them.
V1 responses to optimal stimuli in Flash and Saccade paradigms.
The basis for the hypothesis that macaque contrast sensitivity is lower in a Saccade paradigm, compared with a Flash paradigm, is data showing that V1 responses to an optimal stimulus are lower in the Saccade condition (Ruiz and Paradiso 2012). We began with a 2AFC experiment to confirm this fundamental finding. Figure 1, C and D, show the activity of two exemplary neurons recorded during the tasks in Fig. 1, A and B; top panels show activity throughout the Flash condition, and bottom panels show neural activity throughout the Saccade condition. Blue and yellow shading over the x-axes shows the durations of the first and second fixations in Fig. 1, respectively. The gap between the fixations indicates the intervening saccade. Note that the Flash condition involves an extra 150-ms fixation period at the second fixation site, corresponding to the extra panel in Fig. 1A. As in all standard fixation experiments, this is the hold time during which fixation is verified before flashing on the test stimulus. There is no hold time in the Saccade condition, because this was meant to mimic natural vision in which a saccade brings a new stimulus immediately into view. In both Flash and Saccade conditions, data are aligned to the onset of the stimulus inside the RF.
For cells in Fig. 1, C and D, and the overall population, the response was relatively low on the first fixation. This was expected because the RF on the first fixation contained an arbitrary and suboptimal portion of the natural-scene background that varied cell to cell depending on the retinotopic location of the RF. Visual input on the first fixation was identical in Flash and Saccade conditions and, not surprisingly, the neural responses were very similar (gray vs. purple Flash data, green vs. purple Saccade data). In Flash and Saccade conditions for both cells, there is a large response to the optimal Gabor stimulus that enters the RF on fixation 2. In general, response differences in the two conditions became apparent only after the Gabor stimulus entered the RF. That said, there were occasional exceptions to this rule, as shown in Fig. 1D, top, where there is a weak response just before the Gabor is presented in the Flash condition. As discussed previously (Ruiz and Paradiso 2012), these weak transient responses seen in some cells appear to result from stimulation of the RF by the complex background as it moves across the RF during the saccade. In the Flash condition, the saccade occurs well before the Gabor stimulus appears and the eye movement-related response is seen before Gabor onset at 0 ms (pointer). On the other hand, in the Saccade condition, the saccade brings the RF onto the already present Gabor stimulus. Thus, if there is an eye movement-related response, it overlaps in time with the response to the Gabor stimulus. This is clearly seen in the saccade condition for the cell in Fig. 1D by comparing responses when the Gabor is inside and outside the RF (pointer). It is crucial to note that despite any possible contribution from eye movement-related activity, Saccade condition responses were generally lower than Flash condition responses, not higher.
Figure 2 shows the average response of 64 V1 units to a Gabor stimulus of preferred spatial frequency either flashed into the RF of a fixating animal or brought into the RF via saccade. These data come from responses to the highest contrast Gabor stimulus tested within each of the recording sessions, which totaled 9,011 trials (the complete data set, including all contrast levels, was composed of 38,683 trials). Consistent with the previous findings, a Gabor stimulus flashed in the RF of a fixating animal (Flash condition, solid black line) gave a larger V1 response than the same stimulus brought into the RF by a saccade across a natural scene background (Saccade condition, solid gray line). The response latency is similar in the Flash and Saccade conditions, but the peak response is significantly greater in the former. The responses in the two conditions begin to converge after about 150 ms. These results show that for the same stimulus contrast, there is a lower peak response and lower sustained response out to 150 ms in the Saccade condition. As discussed below and in Ruiz and Paradiso (2012), the Flash/Saccade response differences do not appear to result from movement of the Gabor stimulus or buffer patch edge through the RF during the saccade.
Fig. 2.
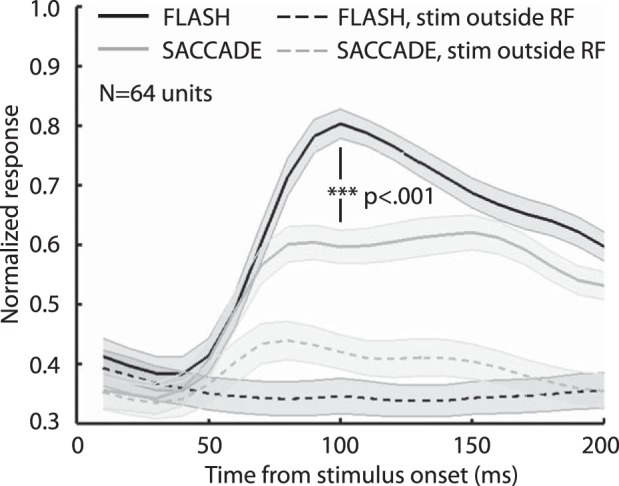
Average responses of 64 V1 neurons in Flash and Saccade conditions. Solid lines show responses to the Gabor test stimulus when it appeared in the RF (optimal spatial frequency and orientation for each neuron). Dotted lines show responses when the Gabor was presented at a similar eccentricity but above the horizontal meridian (i.e., not in the RF). Shaded regions are ±SE. The response was significantly higher in the Flash condition compared with the Saccade condition at the peak response time (***P < 0.001, right-tailed t-test) and also in the 50–200 ms time period (P = 0.005, right-tailed t-test). These data come from 36 units in monkey F, 24 units in monkey S, and 4 units in monkey Z. Normalization was performed on individual units' data sets by dividing the smoothed average response by the peak response across conditions. Shown are the averages of the smoothed normalized plots from individual V1 units' responses to the highest contrasts tested.
Figure 2 also shows average V1 responses when the Gabor was presented in the upper visual field (i.e., well outside the classical RF). As expected, the response to a Gabor flashed outside the RF is flat (black dashed line). However, there is a weak response in the Saccade condition average even when the Gabor appears at a location distant from the RF (dashed gray line). As discussed in Ruiz and Paradiso (2012), this appears to be a result of the eye movement-related responses seen in some cells (e.g., Fig. 1D). Nonetheless, the average response to a Gabor in the RF is lower in the Saccade condition, not higher. Because eye movement-related activity might have sometimes contributed to responses in the Saccade condition, we examined our neural data in two time epochs: 0–50 ms and 50–200 ms from stimulus onset. Most of the Gabor-induced responses occurred after 50 ms, and much of the eye movement-related activity was seen before 50 ms, so we believe the period from 50 to 200 ms best represents response differences to the stimulus with as little eye movement-related activity as possible.
Table 1 summarizes the Flash and Saccade response differences in the two time epochs. In the 50–200 ms epoch, which contains virtually all of the Gabor responses, many more cells gave a larger response (P < 0.05, t-test) in the Flash condition (34/64) than in the Saccade condition (5/64). The ratio is less biased in the 0–50 ms epoch (22/64 vs. 14/64) because of the early eye movement-related activity that sometimes occurred in the Saccade condition. Of the 30 neurons that did not display significantly stronger responses in the Flash condition (50–200 ms), many showed a large eye movement-related response. Thus the Flash/Saccade response difference would almost surely have been significant in more cells if not for a contribution from the eye movement-related activity. Because our goal was to compare a common laboratory paradigm with naturalistic vision, we feel it is appropriate (and more conservative) to not subtract any contribution from eye movement responses, since this is a normal component of natural vision. It is also important to keep in mind that, on average, the saccade-related response is much weaker than the response to the Gabor stimulus (Fig. 2).
Table 1.
Significance of flash/saccade response differences
| Animal | Flash Neural Response Larger, 0–50 ms from Stimulus Onset | Flash Neural Response Larger, 50–200 ms from Stimulus Onset | Saccade Neural Response Larger, 0–50 ms from Stimulus Onset | Saccade Neural Response Larger, 50–200 ms from Stimulus Onset |
|---|---|---|---|---|
| Monkey F | 13/36 | 17/36 | 10/36 | 3/36 |
| Monkey S | 7/24 | 16/24 | 4/24 | 2/24 |
| Monkey Z | 2/4 | 1/4 | 0/4 | 0/4 |
| Total | 22/64 | 34/64 | 14/64 | 5/64 |
The number of significantly stronger responses in Flash and Saccade conditions is shown for 2 time epochs (0–50 ms and 50–200 ms). Significance was calculated by t-test (right-tailed, α = 0.05) on the average firing rates across trials.
The results shown in Fig. 2 and Table 1 confirm that the response to a Gabor stimulus is lower in the Saccade condition than in the Flash condition, at least at a superthreshold contrast and at the single spatial frequency tested for each cell. We next set out to examine contrast sensitivity and contrast response functions in the Saccade and Flash conditions.
Contrast sensitivity and V1 contrast response functions.
Previous studies have quantified the contrast response functions of neurons in area V1, but in those experiments contrast sensitivity was not measured (Albrecht and Hamilton 1982; Barlow et al. 1987; Boynton et al. 1999; Tolhurst et al. 1983). Our aim was to measure contrast responses at multiple spatial frequencies in both saccade and flash conditions for the same neurons and to pair this with perceptual measurements. Figure 3A shows exemplary PSTHs for one cell in monkey F as contrast was varied (using the optimal spatial frequency, which was 1 cpd for this unit). We generally found that at the lowest contrast that evoked a significant response (contrast = 11% for this cell), the Flash response was already significantly greater than the Saccade response. The solid lines in Fig. 3B show the behavioral performance of the animal during the neural recordings in Fig. 3A. As contrast increases, performance rises from chance levels and eventually saturates at around 14% contrast. The dashed lines in Fig. 3B show the average firing rate of the neuron in the 50–200 ms time epoch. Firing rate increases with contrast, but it does not saturate at the same contrasts as behavioral performance.
Fig. 3.

Single-cell contrast responses and psychometric functions. A: thick lines show Flash (black) and Saccade (green) responses (10-ms bins) to a Gabor stimulus in the RF of a neuron from monkey F. Michelson contrast varied from 5% to 17%. Thin lines show responses when the Gabor stimulus was presented outside the RF. Shaded regions are ±SE. Brackets at the top of the plots show the interval from 50 to 200 ms from which we calculated average firing rates in Flash and Saccade conditions and the significance of response differences (right-tailed t-test, **P values displayed on brackets). In this case, Flash and Saccade responses to the Gabor stimulus became significantly different at a contrast of 11%. B: black (Flash) and green (Saccade) symbols show contrast detection (left vertical axis) in the same single session from which the neural recordings in A were made. Continuous lines are logistic function fits to the raw data (see Data analysis). The dashed lines and red symbols show the average neural response (right vertical axis) calculated from the cell recorded during the task. These data points show the average neural activity in the interval from 50 to 200 ms indicated by brackets in A.
The exemplary neural data in Fig. 3A show that Flash responses are consistently higher than Saccade responses with contrasts ranging from threshold to superthreshold. Figure 3B shows, consistent with the physiology data, that contrast detection is better in the Flash condition than in the Saccade condition. Behavioral performance is presumably based on the activity of many neurons (e.g., Palmer et al. 2007) and, not surprisingly, does not perfectly correlate with the responses of the single neuron in Fig. 3. The relationship between neuronal and behavioral data is examined below.
Contrast responses are shown in Fig. 4 for 40 V1 neurons recorded with simultaneous contrast sensitivity measurements (for this plot, we excluded units in which only a single contrast was used or units for which spatial frequency was varied). The inset in Fig. 4 shows a standard contrast response function for one neuron; the response in the 50–200 ms time epoch rose progressively as contrast increased from 4% to 12%, and Flash responses (black) were larger than Saccade responses (gray). Figure 4 shows the response of each of 40 neurons to each of the contrasts at which it was tested. The symbol color denotes the stimulus condition (black = Flash, gray = Saccade), and the symbol shape indicates whether the animal correctly (cross sign) or incorrectly (open circle) detected the Gabor patch. The difference in overall average firing rates was significant between Flash and Saccade conditions (P < 0.0001, right-tailed t-test), but the correct and incorrect trial responses were not significantly different. In this case we do not observe an obvious difference in correct/incorrect response rates for the population as a whole, but we analyze this neural/behavioral link more thoroughly below.
Note that Fig. 4 is built from the contrast response functions of 40 neurons with a range of visual sensitivities; for clarity, the 40 pairs of contrast response curves for individual cells are not shown (the individual curves look like the inset but are shifted horizontally and vertically). Our presumption is that behavioral performance is determined by the activities of many neurons, and for this reason, we show aggregate contrast responses with Naka Rushton equation fits to the correct trials in Flash and Saccade conditions. In aggregate, firing rate increases with contrast and eventually saturates around 30% contrast. The cell-to-cell variability we observed in contrast response functions and the saturation points are comparable to those reported in Albrecht and Hamilton (1982).
The plot in Fig. 3B shows behavioral performance at a single spatial frequency that was optimal for one neuron under study. To construct contrast sensitivity functions, behavioral data were obtained over a range of spatial frequencies and in both Flash and Saccade conditions. The psychometric curves in Fig. 5A show the effect that contrast had on detection at three exemplary spatial frequencies in monkey F. Each panel shows performance for a separate recording session. The horizontal dashed lines show the 80% correct level that we used as a measure of contrast threshold. The vertical dashed lines show the contrast needed to achieve this level of performance in Flash (black) and Saccade (gray) conditions. There was a large Flash/Saccade difference in contrast threshold at 1 cpd, a smaller difference at 4 cpd, and no difference at 8 cpd. Sensitivity to contrast is summarized for two animals in Fig. 5B, which plots contrast sensitivity (inverse of threshold) as a function of spatial frequency. As expected for nonhuman primates, the contrast sensitivity functions in both Flash and Saccade conditions have an inverted U-shape. Although there are differences in the CSFs of monkey S and monkey F, overall the functions are similar: sensitivity is low at 1 cpd and increases to a peak at intermediate spatial frequencies (2–4 cpd) before declining again at 6–8 cpd. In both animals, at lower spatial frequencies, sensitivity is reduced in the Saccade condition compared with the Flash condition. The reductions in contrast sensitivity from the value in the Flash condition are large, about 25% at 1–2 cpd in monkey S and 24.5% (1 cpd) and 7.9% (2 cpd) in monkey F. At 6–8 cpd, the Flash and Saccade curves converge and become nearly identical. To our knowledge, a 2AFC task has not been previously used to measure monkey contrast sensitivity, especially not with natural-image backgrounds. Nonetheless, the general CSF shapes and the locations of the peaks we find are comparable with what has been previously reported using forced-choice paradigms with isolated grating stimuli. For example, De Valois et al. (1974) reported that sensitivity values peak between 3 and 5 cpd in both human and macaque.
Fig. 5.

Contrast sensitivity in 2 animals. A: detection performance in monkey F at 3 different spatial frequencies (SF; cpd, cycles/degree) in the Flash (black) and Saccade (gray) conditions. Curves show logistic function fits to the data. Dashed lines locate the threshold contrast required to achieve 80% correct. B: summary contrast sensitivity functions for monkeys F and S where sensitivity is the inverse of the contrast threshold indicated in A. The data for these contrast sensitivity functions were collected with Gabor stimuli at a fixed orientation, size, and eccentricity.
The CSFs shown in Fig. 5 are based on measurements at a fixed eccentricity (3.6°) and with fixed Gabor orientation and size as in typical human CSF measurements. The CSF curves come from about 4,000 completed behavioral trials per animal. Although the procedure used to collect these psychophysical data is a standard one (vary spatial frequency with fixed stimulus eccentricity, orientation, and size), it is not the most efficient approach when the goal is to make simultaneous behavioral and neural measurements. The reason for this is the specificity of V1 neural responses: fixing the stimulus eccentricity, orientation, and size will make most neurons unresponsive and, at each particular spatial frequency tested, an even smaller fraction will be activated. Thus we also measured contrast sensitivity with a second procedure, different from that represented by Fig. 5, which was more compatible with the neural recordings. In this case the stimulation parameters were optimized for each neuron. Each day the eccentricity of the stimulus used for behavioral testing was set to the RF location of a neuron under study. Likewise, the orientation, spatial frequency, and size of the Gabor stimulus reflected the tuning of the RF. On the next day a different neuron was studied, and behavioral performance was measured with the parameters appropriate for that neuron. The test stimuli were not always at the same retinotopic location because eccentricity was determined each day by the location of the RF(s). However, the small size of the recording array limited the scatter of the test locations (i.e., the locations of the RFs).
Table 2 summarizes contrast sensitivity measurements based on 33,613 trials in 2 animals (monkeys S and F) made during neural recordings with optimized Gabor stimuli. Each day, contrast sensitivity was measured in Flash and Saccade paradigms, and the difference was calculated. In Table 2, the sensitivity differences obtained at the same spatial frequency on different days are averaged.
Table 2.
Contrast sensitivity differences across spatial frequency
| Spatial Frequency, cpd | Average Contrast Sensitivity Difference (Flash minus Saccade) | No. of Sessions | Significance Above Zero, P Value | Sensitivity Decrease Associated with Saccade, % |
|---|---|---|---|---|
| 1 | 1.39 | 15 | 0.003 | 14.88 |
| 2 | 0.751 | 17 | 0.005 | 7.29 |
| 4 | 1.72 | 16 | 0.008 | 13.65 |
| 6 | 1.21 | 5 | 0.123 (n.s) | 10.80 |
| 8 | 0.63 | 6 | 0.055 (n.s.) | 7.89 |
Contrast sensitivity was measured while physiological recordings were made at a neuron's optimal spatial frequency. Sensitivity measurements at the same spatial frequency were averaged across recording sessions. For each spatial frequency at which contrast sensitivity was measured, the average contrast sensitivity difference (Flash condition minus Saccade condition), the number of sessions contributing to the sensitivity values, the significance of the sensitivity difference (right-tailed t-test), and the percent drop in contrast sensitivity in the Saccade condition compared with the Flash condition are shown. n.s., No significance.
Positive sensitivity differences (Table 2) mean that sensitivity was better in the Flash condition, which was always the case. At spatial frequencies below 6 cpd, the data in Table 2 are consistent with the claim based on Fig. 5, that contrast sensitivity is reduced after a saccade compared with sensitivity with a stimulus flashed to a fixating animal. Additionally, Table 2 shows the same intriguing result as Fig. 5: the Flash/Saccade difference is significant at lower spatial frequencies (nearly 15% difference), but the difference is not significant at higher spatial frequencies. One cautionary note here is that few cells were identified that preferred higher spatial frequencies. Thus contrast sensitivity was measured in fewer sessions at higher spatial frequencies, and this may have influenced the Flash/Saccade sensitivity differences. Nonetheless, with the use of a conventional CSF paradigm as in Fig. 5, there is a spatial frequency bias to the Flash/Saccade sensitivity difference, and the results of the experiments with optimal spatial frequency, reported in this section, are consistent with this finding. We conclude that the differences in contrast sensitivity between Flash and Saccade paradigms are similar whether the sensitivity measurements are based on a standard CSF obtained with fixed stimulus parameters (Fig. 5) or on measurements with parameters optimized each day to suit the neural recordings and facilitate behavioral-neural comparisons (Table 2).
Having found that Flash/Saccade differences in contrast sensitivity occur primarily at lower spatial frequencies, we were interested in whether V1 activity is similarly affected by spatial frequency. The physiological results presented to this point were based on experiments that used the optimal spatial frequency for each neuron. However, few neurons preferred higher spatial frequencies, and this made it problematic to compare Flash/Saccade response differences over a range of spatial frequencies. Also, it was not possible to vary both spatial frequency and contrast in individual experiments because this created too many trials for the monkeys to complete within a recording session.
To facilitate neural response comparisons across spatial frequency, we conducted additional experiments in a subset of cells, testing each at five spatial frequencies while Gabor contrast was fixed (see materials and methods). Figure 6 shows responses averaged over 16 neurons for which complete data sets were obtained at 5 different spatial frequencies in both the Flash and Saccade conditions. The responses at 1, 2, and 4 cpd are similar to plots shown previously in Figs. 2 and 3. At these lower spatial frequencies, the Saccade condition has a lower peak response and lower sustained response out to about 150 ms, compared with the Flash response. The Saccade response is significantly weaker than the Flash response (P < 0.05, right-tailed t-test) at 1, 2, and 4 cpd but not at 6 and 8 cpd. Examining individual neural responses in the time interval from 50 to 200 ms, we found that there was a significantly reduced response in the Saccade condition in about half of the units at low spatial frequencies but in fewer units at higher frequencies (7/16 units at 1 cpd, 8/16 at 2 cpd, 7/16 at 4 cpd, 3/16 at 6 cpd, and 3/16 at 8 cpd; t-test performed on average spiking rates, α = 0.05, right-tailed). The responses in Fig. 6 are consistent with the hypothesis that Flash/Saccade contrast sensitivity differences biased toward lower spatial frequencies (Fig. 5) are accompanied by V1 response differences that are similarly biased. Complexities associated with this finding are covered in discussion.
Fig. 6.

Average normalized responses to Gabor stimuli at 5 spatial frequencies. The responses shown come from 16 neurons in monkey S. Single-cell responses were normalized so that each cell contributed equally to the average. Normalization was performed separately at each spatial frequency by dividing responses by the peak response observed. Responses in the Flash condition are shown in black, and responses in the Saccade condition are shown in gray. Shaded regions represent the SE of the average normalized response.
Comparing neural contrast responses and perceptual contrast sensitivity.
The results above show, not surprisingly, that both neural responses and contrast detection rates increase as contrast increases. The data also show reliable differences in both neural contrast responses and contrast sensitivity between Flash and Saccade paradigms. We examine the relationship between neural responses and behavioral performance in several different ways (both within and across the 2 paradigms).
First, across the range of contrasts used, we plotted V1 spike rates divided by percent correct in the detection task (Fig. 7A). This ratio is a measure of the detection value that V1 action potentials might carry. These data come from 40 recording sessions (3 animals) in which two or more contrasts were used. Each neuron is represented by two or more symbols in the plot for each of the contrasts at which it was tested, irrespective of the magnitude of the neural response or the detection rate. Spike/detection ratios shown as black symbols in Fig. 7A come from Flash trials, and ratios indicated by green symbols are from Saccade trials. There is a great deal of variation in the spike/detection ratio at low contrasts, and the ratios obtained in Flash and Saccade conditions show considerable overlap. The mean ratio, across all contrasts, was 0.43 in both flash and saccade conditions (dashed line in Fig. 7A). At higher contrasts there is much less variability. It is noteworthy that the decrease in the variance of the ratio begins at contrasts that were typical detection thresholds. For example, in Fig. 5B, the contrast sensitivity of two animals varies between about 5 and 14 across the spatial frequencies tested, corresponding to threshold contrasts of 7–17%. This contrast range is comparable to the region in Fig. 7A (about 10–20% contrast) where the variance of the ratio decreases. If we assume V1 contributes to contrast detection, the spike/detection ratios found at higher contrasts (near and above the detection threshold) suggest that each V1 spike carries a roughly fixed amount of value for detection across a range of contrasts and in both Flash and Saccade conditions.
A second complementary perspective on the relationship between V1 spike rates and contrast detection is given in Fig. 7B. To make this plot, the contrast levels used across neurons were grouped into bins spanning 3% (i.e., 1–3% contrast, 4–6% contrast, and so on), allowing us to compute standard errors despite small cell-to-cell differences in the contrasts used. For each of the contrast bins, average normalized spike rates and percent correct were computed and plotted. Dotted lines represent logistic function fits to the data and error bars represent ±SE. The relationships between spike rate and detection rate in both Flash (black) and Saccade (green) conditions are well-described by the sigmoidal curves. Assuming V1 is involved in the detection task, these curves show how to translate average neuron firing rates into behavioral detection rates over a wide range of contrasts. A further question is whether the relationship between spike rates and detection is different in the Flash and Saccade conditions. A permutation test was used to address this question. For each of 15 contrast bins, there were response-rate/detection-rate pairs for both the Flash and Saccade conditions (i.e., 30 pairs total). A permutation consisted of randomly assigning each of the 30 response-rate/detection-rate pairs to be Flash or Saccade, plotting as in Fig. 7B, computing logistic function fits, and then calculating the sum-of-squares difference between the fitted curves. A total of 3,000 permutations were made and a distribution of sum-of-squares differences made. For the difference between the actual Flash and Saccade curves in Fig. 7B to be significant, we required the actual sum-of-squares difference to be in the 5% tails of the permutation distribution. After conducting the test, we found that 36% of the sum-of-squares permutations were lower than the actual value. Thus there is no basis for concluding that the relationship between V1 responses and behavioral performance shown in Fig. 7B is different in Flash and Saccade conditions. We conclude that there appears to be a fixed relationship between V1 neural activity and contrast detection, and the reduced detection rate in the saccade condition is more likely associated with the reduced neural response than with a fundamentally different spike-detection relationship.
The third approach we took to compare neural and behavioral performance was to calculate choice probabilities (Britten et al. 1996) to assess whether V1 activity carried any information about the decision the animal made. On each trial, the animal chose which of two locations a stimulus appeared at; we examined the trials in which a stimulus was in the RF to see if correct decisions were associated with greater neural responses than incorrect decisions. Given a randomly chosen firing rate from a correct trial and a randomly chosen rate from an incorrect trial, the choice probability (CP) gives the probability that an ideal observer would be able to correctly identify which rate was associated with a correct response by the monkey. Thus a perfect CP value would be 1.0, and a CP value of 0.5 would indicate chance performance. Values significantly above (or below) 0.5 suggest that a neuron carries information about the animal's decision in the 2AFC detection task.
We performed this analysis on 40 V1 units at each contrast for which the animal made at least 3 correct and 3 incorrect decisions. Figure 8A shows the resulting distribution of CPs for the 122 combinations of cells and contrasts that met this criterion. Thirteen of the 122 combinations (10.6%; shaded gray in Fig. 8) yielded a significant CP (by permutation test). Eight of the significant combinations had a CP above 0.5 and 5 were below 0.5. The average CP was 0.514 (SD 0.098).
Fig. 8.

Choice probability analysis. A: for the 3 animals, behavioral choices were tallied for trials in which the Gabor stimulus was in the RF. Data were analyzed only for contrasts at which the animal made at least 3 correct (stimulus in RF) and 3 incorrect responses (see Data analysis). Receiver operating characteristic (ROC) curves were constructed, and the area under the curve (AUC) was calculated for each condition. These AUCs are reported as choice probabilities (CP). The average CP value is 0.514 (SD 0.098) for 122 unique conditions across 40 V1 units. Thirteen of the 122 conditions (10.6%) yielded a significant CP. B: CP were calculated for each of 40 units, including data from all conditions where at least 3 correct and 3 incorrect choices were made by the animals. Five of 40 units (12.5%) were significant as shown by a permutation test. The average CP value was 0.520 (SD 0.067). The inset shows the ROC and CP for a unit that yielded the highest CP value (0.791).
We did not find large changes in choice probability across contrasts, so we calculated a single CP value for each neuron by aggregating z-scored firing rates from each condition that yielded at least three correct and three incorrect responses (Fig. 8B). Using a permutation test, we found that 5 of 40 units (12.5%) showed significant CP values (2 above 0.5 and 3 below). The average CP was 0.521 (SD 0.070). The inset of Fig. 8B shows an exemplary single unit's ROC and associated CP; this unit had the highest CP in our data set (CP = 0.791).
We also calculated a “grand choice probability” by aggregating all the z-scored data from the single-unit CP analysis and then creating a “grand ROC” for our pool of V1 units. The grand CP value was 0.511. Using a permutation test (3,000 permutations), we found the grand CP value to be within the permutation distribution, and thus not significantly different from 0.5. Even though about 10% of individual neurons had significant CP values, the scatter of CP values above and below 0.5, combined with the insignificant grand choice probability, suggests that V1 carries rather little choice information in our task.
In summary, we find that there is a consistent relationship between activity in area V1 and the ability of animals to detect contrast. However, there was relatively little choice information in the V1 responses.
Possible mechanisms of differences in natural vision.
Beyond establishing the effects of contrast on macaque contrast detection and V1 activity, a key goal of the present study was to examine the effect that a more naturalistic visual paradigm has on the sensitivity to contrast. Because saccades across complex scenes are a fundamental component of natural vision, we sought to understand why the Saccade paradigm gives neural and behavioral responses that are significantly different from the Flash paradigm and why these differences might depend on spatial frequency. We first considered the possibility that stimulus movement underlies the response difference in the two paradigms: in the Saccade condition, but not the Flash condition, the Gabor moves through the RF. We reasoned that if a Gabor moving through the RF affects a cell's response, it would enhance the response rather than suppress it. Nonetheless, we consistently found that responses are reduced rather than augmented in the Saccade condition. In previous studies we further examined a possible role of stimulus motion (MacEvoy et al. 2008; Ruiz and Paradiso 2012). Responses in Flash and Saccade conditions were compared with test stimuli oriented either parallel or perpendicular to saccades. We reasoned that motion perpendicular to the bars in a stimulus would give a significantly greater response, on average, than motion parallel to bar stimuli. Nonetheless, we found no correlation between preferred orientation and the Flash/Saccade difference. Finally, in the “diminished-adaptation experiment” discussed below, the Flash/Saccade response difference is eliminated even though the Gabor still moves across the RF. For all these reasons we concluded that Gabor motion during the saccade in the saccade condition is unlikely to underlie the Flash/Saccade response difference.
A second possibility is that an eye movement signal (corollary discharge) reduces brain responses to a stimulus and that this effect is specific to lower spatial frequencies. Such an explanation is reminiscent of studies investigating saccadic suppression that report that perceptual sensitivity is reduced, but only at lower spatial frequencies (Burr et al. 1994; Hass and Horwitz 2011). Perhaps the saccadic suppression effect extends long into the postsaccade fixation, accounting for reduced contrast sensitivity and V1 contrast response functions. Finally, it is possible that something about the complex scene, such as adaptation, alters contrast sensitivity and neural responses.
To examine the corollary discharge and adaptation explanations, we began by entirely removing the complex background scene from the paradigm and again measuring contrast sensitivity in one animal. Thus the behavioral aspects of the experiment were kept the same, including the eye movement (and presumed corollary discharge), but we removed any effect that the natural scene could have exerted on the perceptual and neuronal responses. The experiment had the same timing parameters as shown in Fig. 1, except that the natural-image background was not present; the luminance of the homogenous gray background was set to 55 cd/m2, which was the same as the luminance of the natural-image background. Figure 9A shows the Flash and Saccade CSFs of monkey S in this experiment, and comparison CSFs from the experiment in Fig. 1, A and B, for the same animal are shown in Fig. 9B. In the absence of the background scene, the CSF difference between Saccade and Flash conditions is virtually gone, even at lower spatial frequencies. It is noteworthy that without the background image, contrast sensitivity is generally higher than with the complex background. Also note that without the background image, it was no longer possible for the animal to discern the locations of the two gray buffer patches where the Gabor might appear. Performance was better in this situation despite the added spatial uncertainty.
Fig. 9.
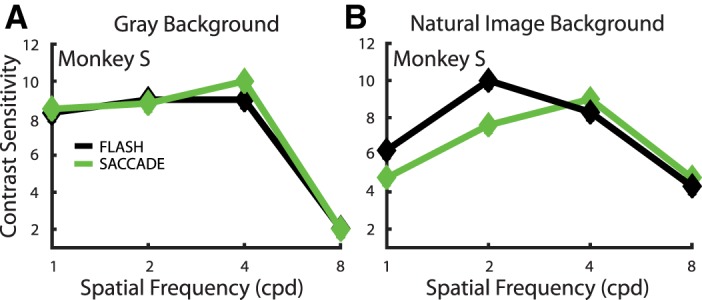
Comparison of contrast sensitivity in monkey S with a gray background (A) and a natural-image background (B). Sensitivity values are shown for Flash (black) and Saccade (green) conditions. The natural-image data (B) are the same as in Fig. 5B. The experimental paradigm used to collect the data in A was identical to that depicted in Fig. 1 except that the background scene was completely removed and replaced by a uniform gray that had the same luminance as the mean of the Gabor stimuli and the natural-image background previously used.
The clear increase in contrast sensitivity, coupled with the loss of the Flash/Saccade difference at low spatial frequencies, led us to infer that the natural image, rather than a corollary discharge signal (which would still be present), is the main determinant of the Flash/Saccade sensitivity difference. We considered adaptation to be a possible mechanism for the background image effect because there is a small but unavoidable difference between the Flash and Saccade conditions: At the start of each trial, in both the flash and saccade conditions, the RF under study sits on the complex background for 400 ms, during which time adaptation may occur. In the Saccade condition this is followed by an eye movement and immediate stimulation by the Gabor at the end of the saccade. However, in the Flash condition there is a period of 150 ms when the RF sits on a gray buffer patch before the Gabor is presented. This delay before flashing the Gabor stimulus is a requisite component of standard fixation tasks as fixation of the new target is tested during this time. Perhaps during this 150-ms interval, adaptation to the natural image, which occurs during the previous fixation, is lost or diminished in the Flash condition, something that could not happen in the Saccade condition. In other words, the Saccade condition may yield lower contrast sensitivity and contrast responses because of adaptation that occurs during the previous 400-ms fixation and carries across the eye movement. Rapid contrast adaptation in V1 has been previously reported (Muller et al. 1999), but to our knowledge this effect has not been studied across eye movements in either neuronal recordings or perceptual paradigms with a natural image and has never been studied with such low-contrast stimuli.
To investigate whether contrast adaptation during fixation might be the cause of the Flash/Saccade neural and behavioral differences, we ran another experiment in which we restored the natural image background but placed gray patches over the RF location (and corresponding upper visual field location) on the first fixation. Thus we diminished the amount of adaptation that could occur at the first 400-ms fixation, but the natural-image background was otherwise present and a saccade was made across it (Fig. 10, A and B). This “diminished-adaptation” experiment was conducted on monkey F. The contrast sensitivity measurements are shown in Fig. 10C, along with dashed traces showing CSF data from the original experiment that were first presented in Fig. 5B.
Fig. 10.

Effects of reduced adaptation. A and B: diminished-adaptation stimulus paradigm. The paradigm was the same as that shown in Fig. 1 except that 2 additional gray buffer patches were added, the first at the location of the RF on fixation 1 and a second at the same eccentricity in the upper visual field (i.e., the retinotopic location at which the Gabor stimulus might appear on fixation 2). These patches eliminated any adaptation to the complex background on fixation 1. In other experiments, the same paradigm was used but the natural-scene background was entirely removed. C: contrast sensitivity in the diminished-adaptation task. Sensitivity values for monkey F are shown for the Flash (black) and Saccade (green) conditions. Gabor size, orientation, and eccentricity were the same at the 5 spatial frequencies tested in separate sessions. The dashed black and gray lines represent CSFs for Flash and Saccade conditions, respectively, for the same monkey when the natural image was present (same data as Fig. 5B). D: averaged normalized responses of 20 V1 units in monkey F to Gabor stimuli in the diminished-adaptation experiment shown in A and B. Thick lines show responses to the Gabor stimulus in the RF, and thin lines show responses when the Gabor was presented outside the RF. Data come from the highest contrasts tested for each of the 20 units. Shaded areas represent the standard error of the average normalized response.
The gray buffer patches on the first fixation prevented the natural image from stimulating the RF. Even with the natural image in the background, and a saccade made across it, the Flash and Saccade CSFs were nearly identical. Note that, similar to the previous gray background experiment, the overall sensitivity values are higher when the natural image is prevented from stimulating the RF on the first fixation (in both Saccade and Flash conditions). We conclude that in a more natural paradigm, it is likely that contrast sensitivity is significantly reduced by 400 ms of adaptation on the first fixation and that this adaptation carries across a 7° saccade.
The results of the diminished-adaptation experiment also suggest that the Flash/Saccade differences we observe are not due to saccadic suppression, which is known to decrease contrast sensitivity around the time of an eye movement, particularly at low spatial frequencies (Burr et al. 1994; Hass and Horwitz 2011; but see Dorr and Bex 2013 for a differing view). In the diminished-adaptation experiment an eye movement, any normal corollary discharge, and a complex background were all still present, but we did not observe any decrements in contrast sensitivity or neural sensitivity. To our knowledge, saccadic suppression has not been demonstrated to be dependent entirely on presaccadic visual stimulation. Our data also show differences in V1 responses that extend well beyond the time (50 ms postsaccade) at which saccadic suppression is generally said to end (e.g., Diamond et al. 2000). Furthermore, the reduced sensitivity and V1 responses we see in the naturalistic condition occur at 1–4 cpd which is notably higher than the 1 cpd upper cutoff often reported for saccadic suppression (Burr et al. 1994; Ross et al. 2001).
With a possible adaptation explanation in hand for the reduced contrast sensitivity we observed in the more natural saccade condition, we returned to the neural recordings. Figure 10D shows monkey F's neuronal responses to Gabor stimuli presented in the diminished-adaptation experiment (gray buffer patches in the RFs on the first fixation). The spatial frequencies were optimized for each of these 20 units, and the contrast was set with the same criteria as the main contrast sensitivity experiment. Figure 10D shows the average normalized responses to the highest contrast Gabor tested during each of the sessions (as in Fig. 2). Without the background image in the RF on the first fixation, the Saccade response was no longer reduced compared with the Flash response. Only 2/20 single units (10%) in the diminished-adaptation experiment displayed a significantly reduced response in the Saccade condition during the stimulus response period from 50 to 200 ms (P < 0.05, right-tailed t-test). This is to be compared with 34/64 units (53%) in the experiment above in which the complex background stimulated the RF on the first fixation. This finding is consistent with the hypothesis that adaptation to the complex background normally occurs on the first fixation (at the RF location) and the adaptation carries across to the second fixation. The response latency was shorter in the Saccade condition because of a response at the end of the eye movement that can be seen in both the Saccade condition and the no-stimulus saccade condition (the peaks in both green curves at about 60 ms). As mentioned above, this early response is presumably a result of visual stimulation during the saccade. An early peak is not expected (and not seen) in the flash condition because of the 150-ms fixation time preceding stimulus onset (i.e., the peak would be at a negative time in Fig. 10D). We also note that there is a smaller difference here between the Saccade responses with and without a Gabor stimulus compared with Fig. 2. This might be related to adaptation on the first fixation; in the diminished-adaptation condition, the lack of adaptation on the first fixation may be associated with larger responses to the natural-scene background during the saccade. Finally, we note that the finding that the Flash/Saccade response difference is largely eliminated simply by adding buffer patches on the first fixation argues strongly against the possibility that the lower response in the Saccade condition results from stimulation of the RF by the edge of the buffer patch or the Gabor stimulus during the saccade.
DISCUSSION
In the study reported, we examined contrast sensitivity because it is a common and important measure of visual performance and because it is a valuable tool in the assessment of visual disorders. The experiments simultaneously quantified macaque contrast sensitivity and V1 contrast responses; this gave us the ability to compare behavioral and neural measures and to make comparisons between a standard laboratory condition (Flash) and a more naturalistic condition (Saccade). The contrast sensitivity and contrast response values we obtained in the Flash condition are comparable to values obtained previously in separate psychophysical and physiological studies. For example, De Valois et al. (1974) found peaks in the macaque CSF at 3–5 cpd (absolute sensitivity was higher in that study, presumably because the stimuli were foveal). Concerning V1 contrast response functions, Albrecht and Hamilton (1982) reported a striking diversity in neural response curves. There was a wide range for the contrast at which responses saturated, but they were frequently in the range of 10–30%. Our data are consistent with the heterogeneity they observed and with saturation commonly in the range of 10–30% contrast. Comparing the neural and behavioral measurements, we find that there is a correlation between V1 activity and contrast sensitivity and that this relationship is similar in the Flash and Saccade conditions. Across the two conditions and a wide range of contrasts, one can infer approximate contrast sensitivity on the basis of the average V1 response rate (Fig. 7B).
Comparing measurements made with the Flash and Saccade paradigms, our results are consistent with the hypothesis, based on previous physiological data from our laboratory, that V1 responses and contrast sensitivity are significantly reduced in natural vision. Indeed, sensitivity at moderate spatial frequencies was lower by nearly 25% (there was little or no Flash/Saccade difference at higher spatial frequencies). The loss of perceptual sensitivity correlates with a natural vision decrease in V1 responses. We considered multiple mechanisms that might be responsible for decreased V1 responses and contrast sensitivity in the Saccade condition, and it appears most likely that these effects result from rapidly forming adaptation that carries across saccadic eye movements. Visual adaptation is generally studied with stimuli presented for many seconds or minutes, although adaptation that occurs in less than a second has been reported in a few instances (Dargoi et al. 2002; Muller et al. 1999). To our knowledge, quickly forming natural-image adaptation of visual responses has never been shown to carry across saccadic eye movements and affect perception or neural activity on subsequent fixations. The findings suggest that natural vision involves constant temporal interactions between objects seen on different fixations, interactions that affect a low-level measure of visual sensitivity. Below we examine in more detail a number of key points impacted by our findings.
Comparison with other natural vision studies.
A variety of studies have reported differences in V1 activity with naturalistic paradigms (David et al. 2004; Guo et al. 2005; Kayser et al. 2003; Vinje and Gallant 2000). Our findings might appear to be at odds with several previous studies that reported saccades do not alter the responses of V1 neurons (e.g., Gawne and Martin 2002; Wurtz 1969). A key point is that these experiments were conducted with isolated stimuli on uniform backgrounds. In reality, the results of the present study are consistent with the earlier work in that we find no difference in neural responses or contrast sensitivity when the complex background image is replaced by a uniform background.
Two previous studies reported that V1 neurons respond more strongly to a stimulus when it is flashed on after a forced fixation than when a saccade brings the RF to a stimulus embedded in a natural scene (Ruiz and Paradiso 2012; Yu and Lee 2000). Our results build on these previous studies in four important ways. First, we find that there is a reliable and similar relationship between V1 activity and contrast sensitivity in both laboratory and naturalistic paradigms. Second, neural responses and contrast sensitivity are reduced in a naturalistic paradigm, and both effects are particularly strong at lower spatial frequencies. Third, it is the combination of a background image with saccadic target acquisition that makes the naturalistic visual response differ from the flashed stimulus response. Finally, it appears that rapid adaptation may underlie both the neural and perceptual differences in naturalistic vision.
A previous human psychophysical study examined contrast detection after saccades, and superficially, the results may appear to be at odds with ours. In a study by Dorr and Bex (2013), subjects watched a movie, and their task was to detect randomly timed contrast increments in a small portion of the scene. In an active version of the experiment, natural eye movements were made, and in a passive version, eye movements were played back while subjects maintained fixation. The data show that the detection rate was higher when saccadic eye movements were made than during passive fixation. This may appear to contradict our finding that contrast sensitivity is lower when saccades are made. However, the experiments are actually fundamentally different: using our terminology, both the active and passive conditions in the Dorr and Bex study were “Flash” conditions because the test stimulus generally appeared after the end of a saccade and a period of fixation.
Adaptation.
Adaptation to grating patterns is known to affect both contrast sensitivity and visual cortical activity (Blakemore and Campbell 1968), and it occurs on multiple timescales (Baccus and Meister 2002; Wark et al. 2009; Webster 2011). In experiments with real-world scenes, fixations vary from below 50 ms to over 1,000 ms, and average about 330 ms in humans (Henderson and Hollingworth 1999) and about 380 ms in nonhuman primates (Kayser et al. 2006). Thus the 400-ms initial fixation period in our experiments is in the range of normal fixation durations. We show in the present study that rapidly forming adaptation to a natural scene, occurring within the duration of a normal fixation, appears to carry across 7° saccadic eye movements and reduce contrast sensitivity and V1 cortical responses. Previous studies have shown adaptation effects that occur after lengthy (seconds to minutes) viewing of natural images (Bex et al. 2009; Webster and Miyahara 1997) and rapid adaptation to orientation (Dragoi et al. 2002) and motion (Glasser et al. 2011). Though theirs was not an adaptation study, Eriksson et al. (2010) showed that the response of a V1 neuron can be significantly altered by the response to a 250-ms stimulus on a previous fixation.
Also relevant is a macaque V1 study by Gawne and Woods (2003) that examined responses to a Walsh pattern stimulus seen after a saccade as influenced by a Walsh pattern seen on a previous fixation. Importantly, as in our study, the stimuli were presented for a duration similar to a typical fixation (235 ms). They found that V1 responses to the second stimulus were lower when the first stimulus was a Walsh pattern than uniform gray. They also found that the degree of response reduction on the second fixation was greatest when the first and second stimuli were identical. Their conclusion, which our data are consistent with, was that adaptation to brief stimuli occurs and carries across saccades.
Other retinotopic adaptation effects are known to carry across eye movements. For example, the tilt aftereffect (Gibson and Radner 1937) occurs even when a saccade occurs between the adaptor and test stimulus (Melcher 2005, 2009). However, the adaptor duration used to study the tilt aftereffect is typically several seconds, much longer than the duration of natural fixations and fixations in our experiments.
The changes in V1 contrast response functions we have quantified are reminiscent of contrast gain control (Blakemore and Campbell 1968; Bonds 1991; Ohzawa et al. 1985). The previous studies showed that exposure to a grating stimulus raised the contrast threshold for a subsequent grating of the same spatial frequency. Consistent with our findings, contrast gain adjustments can be observed with short stimulus durations and low contrasts (Bonds 1991; Ohzawa et al. 1985). In cats, contrast gain control appears to occur in V1 when inputs from the two eyes first converge (Ohzawa et al. 1985; Truchard et al. 2000). Contrast gain control has been observed in macaque MT, but it is likely based on adaptation earlier in visual processing (Kohn and Movshon 2003). In humans, contrast gain adjustments are seen as early as V1 as well as in later areas (Gardner et al. 2005). There are too many differences between our study and the earlier experiments to infer that the adaptation we observed is contrast gain control. For example, we do not know if contrast gain control would occur on brief fixations and persist across saccades or if the earlier findings would be altered with complex visual stimuli. If contrast gain control is involved in our findings, one could speculate that the rapid adaptation occurs first in primary visual cortex.
Spatial frequency-specific effects.
Our experiments show that contrast sensitivity and V1 responses are reduced more at low than high spatial frequencies. Natural scenes are known to be dominated by low spatial frequencies (Burton and Moorhead, 1987; Tolhurst et al. 1992; van der Schaaf and van Hateren 1996), and a two-dimensional fast Fourier transform demonstrated that this was also true of the natural image we used and the portion of the image corresponding to the aggregate area of the RFs studied (Fig. 11). Moreover, we computed the spectra for the fixation 1 image areas of all the individual RFs studied and consistently found the greatest power at low spatial frequencies (Fig. 11C). Thus our results are consistent with the claim that low spatial frequency adaptation is the basis for the effect we observed (but see below). Low-frequency-biased adaptation to natural images has been reported with longer duration adaptation in human psychophysical studies by Webster and Miyahara (1997) and Bex et al. (2009). Our findings may be based on similar adaptation, but at a much shorter timescale and across saccades.
Fig. 11.

Background image power spectra, RF locations, and adaptation. A: the locations of RFs are indicated by 1° yellow circles (the average RF size) at their locations on the background image during fixation 1. Adaptation appears to have occurred in the RFs on the first fixation and been over into the second fixation. The red square indicates the aggregate RF area for all neurons studied. In addition to the RFs, we show white circles to indicate the corresponding upper visual field locations where stimuli would appear on the second fixation; these were included for the 2AFC behavioral task, and presumably, adaptation occurred at these sites as well. B, left: a 2-dimensional (2-D) FFT (MATLAB fft2) of the entire background image (blue border). The red boxes show the aggregate RF area on the background image and its 2-D FFT. In both the overall image and the aggregate RF area, low spatial frequencies were dominant. C: radially averaged power spectra are shown for three 1° background-image RF areas used in the contrast sensitivity task (cyc/deg, cycles/degree). We examined the power spectra of all background-image RF areas and found them to be similarly dominated by lower spatial frequencies.
Our psychophysical data clearly demonstrate that the contrast sensitivity function in the Saccade condition is reduced primarily at lower spatial frequencies compared with the Flash condition (Table 2 and Fig. 5). The neural data in Fig. 6 and the percentage of cells showing effects at each spatial frequency (results) show that V1 responses in the Saccade condition are also reduced primarily at lower spatial frequencies. Thus, to the extent to which these data can address the spatial frequency specificity, there is a correspondence between V1 activity and the CSF. However, two factors complicate this comparison. First, most of the neurons we studied, and V1 cells in general (De Valois et al. 1982), prefer lower spatial frequencies (1–4 cpd). Conceivably, if we were able to find and study more neurons that prefer higher spatial frequencies, more high-frequency response differences might be detected.
Second, it is possible that the low power found at higher spatial frequencies in natural images influences the frequencies at which V1 response differences are observed. Confirmation of the low-frequency bias of V1 flash/saccade response differences will require more extensive testing that specifically targets adaptation over a larger population of neurons and a larger range of stimulus conditions. That said, if one views our sample of V1 neurons as representative of the overall population, there is a low-frequency bias in the saccade condition effects on neurons as there is on behavior.
Correlations between perceptual contrast sensitivity and V1 activity.
Our data suggest that there is a significant correlation between neuronal activity in V1 and contrast sensitivity. Figure 7 demonstrates, at least at superthreshold contrasts, an approximate ratio between the number of spikes fired by V1 neurons and contrast sensitivity measured behaviorally. In this sense, V1 spikes have a relatively fixed “exchange rate” when converted into contrast perception. Figure 7B further suggests that there is a roughly fixed sigmoidal relationship between spike rate and contrast sensitivity. One can infer approximate contrast sensitivity from the average response of V1 neurons. We saw no evidence that the correlation between spikes and detection differs in the Flash and Saccade conditions. This suggests, to the extent V1 is involved in contrast perception, that the naturalistic paradigm reduces V1 responses and that this change is sufficient to account for the reduced contrast sensitivity. Our working hypothesis is that rapid adaptation causes the reduced responses in the Saccade condition.
We also computed choice probabilities (CP) to see if V1 neurons carry information associated with the detection decision the animals made. We found that 12.5% of the neurons examined did show significant CP. However, the significant CP values were roughly equally spaced to the two sides of 0.5, and the grand choice probability for the units we studied was not significant. These observations necessitate caution when inferring the importance of apparent choice information in V1, particularly because other studies have reported relatively little choice information in this cortical area (e.g., Grunewald et al. 2002; Nienborg and Cumming 2006). That said, the limited choice information we observed may be related to the number of trials we were able to acquire with our paradigms compared with the large trial numbers needed to achieve significant CP values (Britten et al. 1996). It is also important to note that significant V1 choice information was obtained by Palmer et al. (2007), who measured V1 contrast responses and behavioral decisions in a reaction-time detection experiment.
Taken together, the analyses we conducted suggest that there is a reliable relationship between firing rate and detection performance (Fig. 7) but that, at least with the number of cells and trials we have, behavioral performance cannot be predicted by single-unit firing rate on a trial-by-trial basis.
In addition to showing a link between contrast sensitivity and V1 neuronal activity, our findings demonstrate significant differences in contrast sensitivity and neuronal responses in natural vision conditions compared with typical laboratory conditions. Our data suggest that, even with natural-duration fixations and saccades, adaptation is always at work affecting brain activity and perceptual abilities. The implication is that the makeup of natural scenes, which are typically dominated by low spatial frequencies, influences the V1 response from fixation to fixation in daily vision. These results show that common laboratory methods used to quantify contrast sensitivity, which avoid saccades and complex images, can overestimate natural visual performance. More specifically, performance in a more naturalistic situation with saccadic eye movements is degraded relative to tests with flashed stimuli, and this difference is predominantly observable at lower spatial frequencies. Thus, compared with typical laboratory measurements with flashed stimuli, natural vision gives a somewhat high-pass representation of the visual environment. Because contrast sensitivity measurements are frequently used in clinical assessment, our results suggest that the testing paradigm could be optimized to better reflect normal visual ability.
GRANTS
This work was supported by National Science Foundation Grant BCS-1261433. J. E. Niemeyer was supported by National Eye Institute Training Grant T32 EY018080 from the National Institutes of Health, a Fox Postdoctoral Research Fellowship from Brown University, and an award from the Brown University Center for Vision Research.
DISCLOSURES
No conflicts of interest, financial or otherwise, are declared by the authors.
AUTHOR CONTRIBUTIONS
J.E.N. performed experiments; J.E.N. analyzed data; J.E.N. and M.A.P. interpreted results of experiments; J.E.N. prepared figures; J.E.N. and M.A.P. drafted manuscript; J.E.N. and M.A.P. edited and revised manuscript; J.E.N. and M.A.P. approved final version of manuscript.
ACKNOWLEDGMENTS
We thank Aaron Gregoire for invaluable assistance with the experiments.
REFERENCES
- Albrecht DG, Hamilton DB. Striate cortex of monkey and cat: contrast response function. J Neurophysiol 48: 217–237, 1982. [DOI] [PubMed] [Google Scholar]
- Arden GB. The importance of measuring contrast sensitivity in cases of visual disturbance. Br J Ophthalmol 62: 198–209, 1978. [DOI] [PMC free article] [PubMed] [Google Scholar]
- Arden G, Jacobson J. A simple grating test for contrast sensitivity: preliminary results indicate value in screening for glaucoma. Invest Ophthalmol Vis Sci 17: 23–32, 1978. [PubMed] [Google Scholar]
- Asaad WF, Santhanam N, McClellan S, Freedman DJ. High-performance execution of psychophysical tasks with complex visual stimuli in MATLAB. J Neurophysiol 109: 249–260, 2013. [DOI] [PMC free article] [PubMed] [Google Scholar]
- Baccus SA, Meister M. Fast and slow contrast adaptation in retinal circuitry. Neuron 36: 909–919, 2002,. [DOI] [PubMed] [Google Scholar]
- Barlow HB, Kaushall TP, Hawken M, Parker AJ. Human contrast discrimination and the threshold of cortical neurons. J Opt Soc Am A 4: 2366–2371, 1987. [DOI] [PubMed] [Google Scholar]
- Bex PJ, Solomon SG, Dakin SC. Contrast sensitivity in natural scenes depends on edge as well as spatial frequency structure. J Vis 9: 1–19, 2009. [DOI] [PMC free article] [PubMed] [Google Scholar]
- Blakemore C, Campbell F. Adaptation to spatial stimuli. J Physiol 200: 11–13, 1968. [PubMed] [Google Scholar]
- Bonds AB. Temporal dynamics of contrast gain in single cells of the cat striate cortex. Vis Neurosci 6: 239–255, 1991. [DOI] [PubMed] [Google Scholar]
- Boynton GM, Demb JB, Glover GH, Heeger DJ. Neuronal basis of contrast discrimination. Vision Res 39: 257–269, 1999. [DOI] [PubMed] [Google Scholar]
- Brainard D. The psychophysics toolbox. Spat Vis 10: 433–436, 1997. [PubMed] [Google Scholar]
- Britten KH, Newsome WT, Shadlen MN, Celebrini S, Movshon JA. A relationship between behavioral choice and the visual responses of neurons in macaque MT. Vis Neurosci 13: 87–100, 1996. [DOI] [PubMed] [Google Scholar]
- Burr DC, Morrone MC, Ross J. Selective suppression of the magnocellular visual pathway during saccadic eye-movements. Nature 371: 511–513, 1994. [DOI] [PubMed] [Google Scholar]
- Burton GJ, Moorhead IR. Color and spatial structure in natural scenes. Appl Opt 26: 157–170, 1987. [DOI] [PubMed] [Google Scholar]
- Campbell FW, Green EG. Optical and retinal factors affecting visual resolution. J Physiol 181: 576–593, 1965. [DOI] [PMC free article] [PubMed] [Google Scholar]
- Crapse TB, Basso MA. Insights into decision making using choice probability. J Neurophysiol 114: 3039–3049, 2015. [DOI] [PMC free article] [PubMed] [Google Scholar]
- David SV, Vinje WE, Gallant JL. Natural stimulus statistics alter the receptive field structure of V1 neurons. J Neurosci 24: 6991–7006, 2004. [DOI] [PMC free article] [PubMed] [Google Scholar]
- De Valois RL, Albrecht DG, Thorell LG. Spatial frequency selectivity of cells in macaque visual cortex. Vision Res 22: 545–559, 1982. [DOI] [PubMed] [Google Scholar]
- De Valois RL, Morgan H, Snodderly DM. Psychophysical studies of monkey vision. III. Spatial luminance contrast sensitivity tests of macaque and human observers. Vision Res 14: 74–81, 1974. [DOI] [PubMed] [Google Scholar]
- Diamond MR, Ross J, Morrone MC. Extraretinal control of saccadic suppression. J Neurosci 20: 3449–3455, 2000. [DOI] [PMC free article] [PubMed] [Google Scholar]
- Dorr M, Bex PJ. Peri-saccadic natural vision. J Neurosci 33: 1211–1217, 2013. [DOI] [PMC free article] [PubMed] [Google Scholar]
- Dragoi V, Sharma J, Miller E, Sur M. Dynamics of neuronal sensitivity in visual cortex and local feature discrimination. Nat Neurosci 5: 883–891, 2002. [DOI] [PubMed] [Google Scholar]
- Elliot DB, Hurst MA, Weatherill J. Comparing clinical tests of visual function in cataract with the patient's perceived visual disability. Eye 4: 712–717, 1990. [DOI] [PubMed] [Google Scholar]
- Eriksson D, Valentiniene S, Papaioannou S. Relating information, encoding and adaptation: decoding the population firing rate in visual areas 17/18 in response to a stimulus transition. PLoS One 5: 1–14, 2010. [DOI] [PMC free article] [PubMed] [Google Scholar]
- Fechner GT. [Elemente der Psychophysik. Leipzig: Breithopf und Hertel, 1860.] In: Elements of Psychophysics, edited by Howes DH and Boring EC; translated by Adler HE. New York: Holt, Rinehart, and Winston, 1966. [Google Scholar]
- Felsen G, Dan Y. A natural approach to studying vision. Nat Neurosci 8: 1643–1646, 2005. [DOI] [PubMed] [Google Scholar]
- Gallant JL, Connor CE, Van Essen DC. Neural activity in areas V1, V2, and V4 during free viewing of natural scenes compared to controlled viewing. Neuroreport 9: 2153–2158, 1998. [DOI] [PubMed] [Google Scholar]
- Gardner JL, Sun P, Waggoner RA, Ueno K, Tanaka K, Cheng K. Contrast adaptation and representation in human early visual cortex. Neuron: 607–620, 2005. [DOI] [PMC free article] [PubMed] [Google Scholar]
- Gawne TJ, Martin JM. Responses of primate visual cortical neurons to stimuli presented by flash, saccade, blink, and external darkening. J Neurophysiol 88: 2178–2186, 2002. [DOI] [PubMed] [Google Scholar]
- Gawne TJ, Woods JM. The responses of visual cortical neurons encode differences across saccades. Neuroreport 14: 105–109, 2003. [DOI] [PubMed] [Google Scholar]
- Gibson JJ, Radner M. Adaptation, after-effect and contrast in the perception of tilted lines. I. Quantitative studies. J Exp Psychol 20: 453–467, 1937. [Google Scholar]
- Glasser DM, Tsui JM, Pack CC, Tatin D. Perceptual and neural consequences of rapid motion adaptation. Proc Natl Acad Sci USA 108: 18215–18216, 2011. [DOI] [PMC free article] [PubMed] [Google Scholar]
- Grunewald A, Bradley DC, Andersen RA. Neural correlates of structure-from-motion perception in V1 and MT. J Neurosci 22: 6195–6207, 2002. [DOI] [PMC free article] [PubMed] [Google Scholar]
- Guo K, Robertson RG, Mahmood S, Young MP. Center-surround interactions in response to natural scene stimulation in the primary visual cortex. Eur J Neurosci 21: 536–548, 2005. [DOI] [PubMed] [Google Scholar]
- Hass CA, Horwitz GD. Effects of microsaccades on contrast detection and V1 responses in macaques. J Vis 11: 1–17, 2011. [DOI] [PMC free article] [PubMed] [Google Scholar]
- Henderson JM, Hollingworth A. High-level scene perception. Annu Rev Psychol 50: 243–271, 1999. [DOI] [PubMed] [Google Scholar]
- Hubel DH. Single unit activity in striate cortex of unrestrained cats. J Physiol 147: 226–238, 1958. [DOI] [PMC free article] [PubMed] [Google Scholar]
- Kayser C, Cording K, Konig P. Processing of complex stimuli and natural scenes in the visual cortex. Curr Opin Neurobiol 14: 468–473, 2004. [DOI] [PubMed] [Google Scholar]
- Kayser C, Nielsen KJ, Logothetis NK. Fixations in natural scenes: interaction of image structure and image content. Vision Res 46: 2535–2545, 2006. [DOI] [PubMed] [Google Scholar]
- Kayser C, Salazar RR, Konig P. Responses to natural scenes in cat V1. J Neurophysiol 90: 1910–1920, 2003. [DOI] [PubMed] [Google Scholar]
- Kleiner M, Brainard D, Pelli D. What's new in Psychtoolbox-3? Perception 36, Suppl 1: 1–16, 2007. [Google Scholar]
- Kohn A, Movshon JA. Neuronal adaptation to visual motion in area MT of the macaque. Neuron 39: 681–691, 2003. [DOI] [PubMed] [Google Scholar]
- Livingstone MS, Freeman DC, Hubel DH. Visual responses in V1 of freely viewing monkeys. Cold Spring Harb Symp Quant Biol 61: 27–37, 1996. [PubMed] [Google Scholar]
- MacEvoy SP, Hanks TD, Paradiso MA. Macaque V1 activity during natural vision: effects of natural scenes and saccades. J Neurophysiol 99: 460–472, 2008. [DOI] [PMC free article] [PubMed] [Google Scholar]
- Melcher D. Selective attention and the active remapping of object features in trans-saccadic perception. Vision Res 49: 1249–1255, 2009. [DOI] [PubMed] [Google Scholar]
- Melcher D. Spatiotopic transfer of visual-form adaptation across saccadic eye movements. Curr Biol 15: 1745–1748, 2005. [DOI] [PubMed] [Google Scholar]
- Muller JR, Metha AB, Krauskopf J, Lennie P. Rapid adaptation in visual cortex to the structure of images. Science 285: 1405–1408, 1999. [DOI] [PubMed] [Google Scholar]
- Nienborg H, Cumming BG. Macaque V2 neurons, but not V1 neurons, show choice-related activity. J Neurosci 26: 9567–9578, 2006. [DOI] [PMC free article] [PubMed] [Google Scholar]
- Ohzawa I, Sclar G, Freeman RD. Contrast gain control in the cat's visual system. J Neurophysiol 54: 651–667, 1985. [DOI] [PubMed] [Google Scholar]
- Owsley C, Sloane ME. Contrast sensitivity, acuity, and the perception of ‘real-world’ targets. Br J Ophthalmol 71: 791–796, 1987. [DOI] [PMC free article] [PubMed] [Google Scholar]
- Palmer C, Cheng S, Seidemann E. Linking neuronal and behavioral performance in a reaction-time visual detection task. J Neurosci 27: 8122–8137, 2007. [DOI] [PMC free article] [PubMed] [Google Scholar]
- Pelli D. The VideoToolbox software for visual psychophysics: transforming numbers into movies. Spat Vis 10: 437–442, 1997. [PubMed] [Google Scholar]
- Prins N, Kingdom FA. Palamedes: Matlab routines for analyzing psychophysical data. (Online). http://www.palamedestoolbox.org [10 Apr. 2014]. [Google Scholar]
- Robson JG. Contrast sensitivity: one hundred years of clinical measurement. In: Contrast Sensitivity, edited by Shapley R and Lam DM. Boston, MA: MIT Press, 1993. [Google Scholar]
- Ross J, Morrone C, Goldberg M, Burr D. Changes in visual perception at the time of saccades. Trends Neurosci 24: 113–121, 2001. [DOI] [PubMed] [Google Scholar]
- Ruiz O, Paradiso MA. Macaque V1 representations in natural and reduced visual contexts: spatial and temporal properties and influence of saccadic eye movements. J Neurophysiol 108: 324–333, 2012. [DOI] [PMC free article] [PubMed] [Google Scholar]
- Simoncelli EP, Olshausen BA. Natural image statistics and neural representation. Annu Rev Neurosci 24: 1193–1216, 2001. [DOI] [PubMed] [Google Scholar]
- Sokol S, Moskowitz A, Skarf B, Evans R, Molitch M, Senior B. Contrast sensitivity in diabetics with and without background retinopathy. Arch Ophthalmol 103: 51–54, 1985. [DOI] [PubMed] [Google Scholar]
- Tolhurst DJ, Movshon JA, Dean AF. The statistical reliability of signals in single neurons in cat and monkey visual cortex. Vision Res 23: 775–785, 1983. [DOI] [PubMed] [Google Scholar]
- Tolhurst DJ, Tadmor Y, Chao T. Amplitude spectra of natural images. Ophthalmic Physiol Opt 12: 229–232, 1992. [DOI] [PubMed] [Google Scholar]
- Truchard AM, Ohzawa I, Freeman RD. Contrast gain control in the visual cortex: monocular versus binocular mechanisms. J Neurosci 20: 3017–3032, 2000. [DOI] [PMC free article] [PubMed] [Google Scholar]
- van der Schaaf A, van Hateren JH. Modelling the power spectra of natural images: statistics and information. Vision Res 36: 2759–2770, 1996. [DOI] [PubMed] [Google Scholar]
- van Hateren JH, van der Schaaf A. Independent component filters of natural images compared with simple cells in primary visual cortex. Proc R Soc Lond B Biol Sci 265: 359–366, 1998. [DOI] [PMC free article] [PubMed] [Google Scholar]
- Vinje WE, Gallant JL. Sparse coding and decorrelation in primary visual cortex during natural vision. Science 287: 1273–1276, 2000. [DOI] [PubMed] [Google Scholar]
- Wark B, Fairhall A, Rieke F. Timescales of inference in visual adaptation. Neuron 61: 750–761, 2009. [DOI] [PMC free article] [PubMed] [Google Scholar]
- Webster MA. Adaptation and visual coding. J Vis 11: 1–23, 2011. [DOI] [PMC free article] [PubMed] [Google Scholar]
- Webster MA, Miyahara E. Contrast adaptation and the spatial structure of natural images. J Opt Soc Am A 14: 2355–2366, 1997. [DOI] [PubMed] [Google Scholar]
- Wood JM, Owens DA. Standard measures of visual acuity do not predict drivers' recognition performance under day or night conditions. Optom Vis Sci 82: 698–705, 2005. [DOI] [PubMed] [Google Scholar]
- Wurtz RH. Comparison of effects of eye movements and stimulus movements on striate cortex neurons of the monkey. J Neurophysiol 32: 987–994, 1969. [DOI] [PubMed] [Google Scholar]
- Yu SX, Lee TS. What do V1 neurons tell us about saccadic suppression? J Neural Comput 32: 271–277, 2000. [Google Scholar]